Copyright
©The Author(s) 2022.
World J Clin Cases. Nov 16, 2022; 10(32): 11789-11803
Published online Nov 16, 2022. doi: 10.12998/wjcc.v10.i32.11789
Published online Nov 16, 2022. doi: 10.12998/wjcc.v10.i32.11789
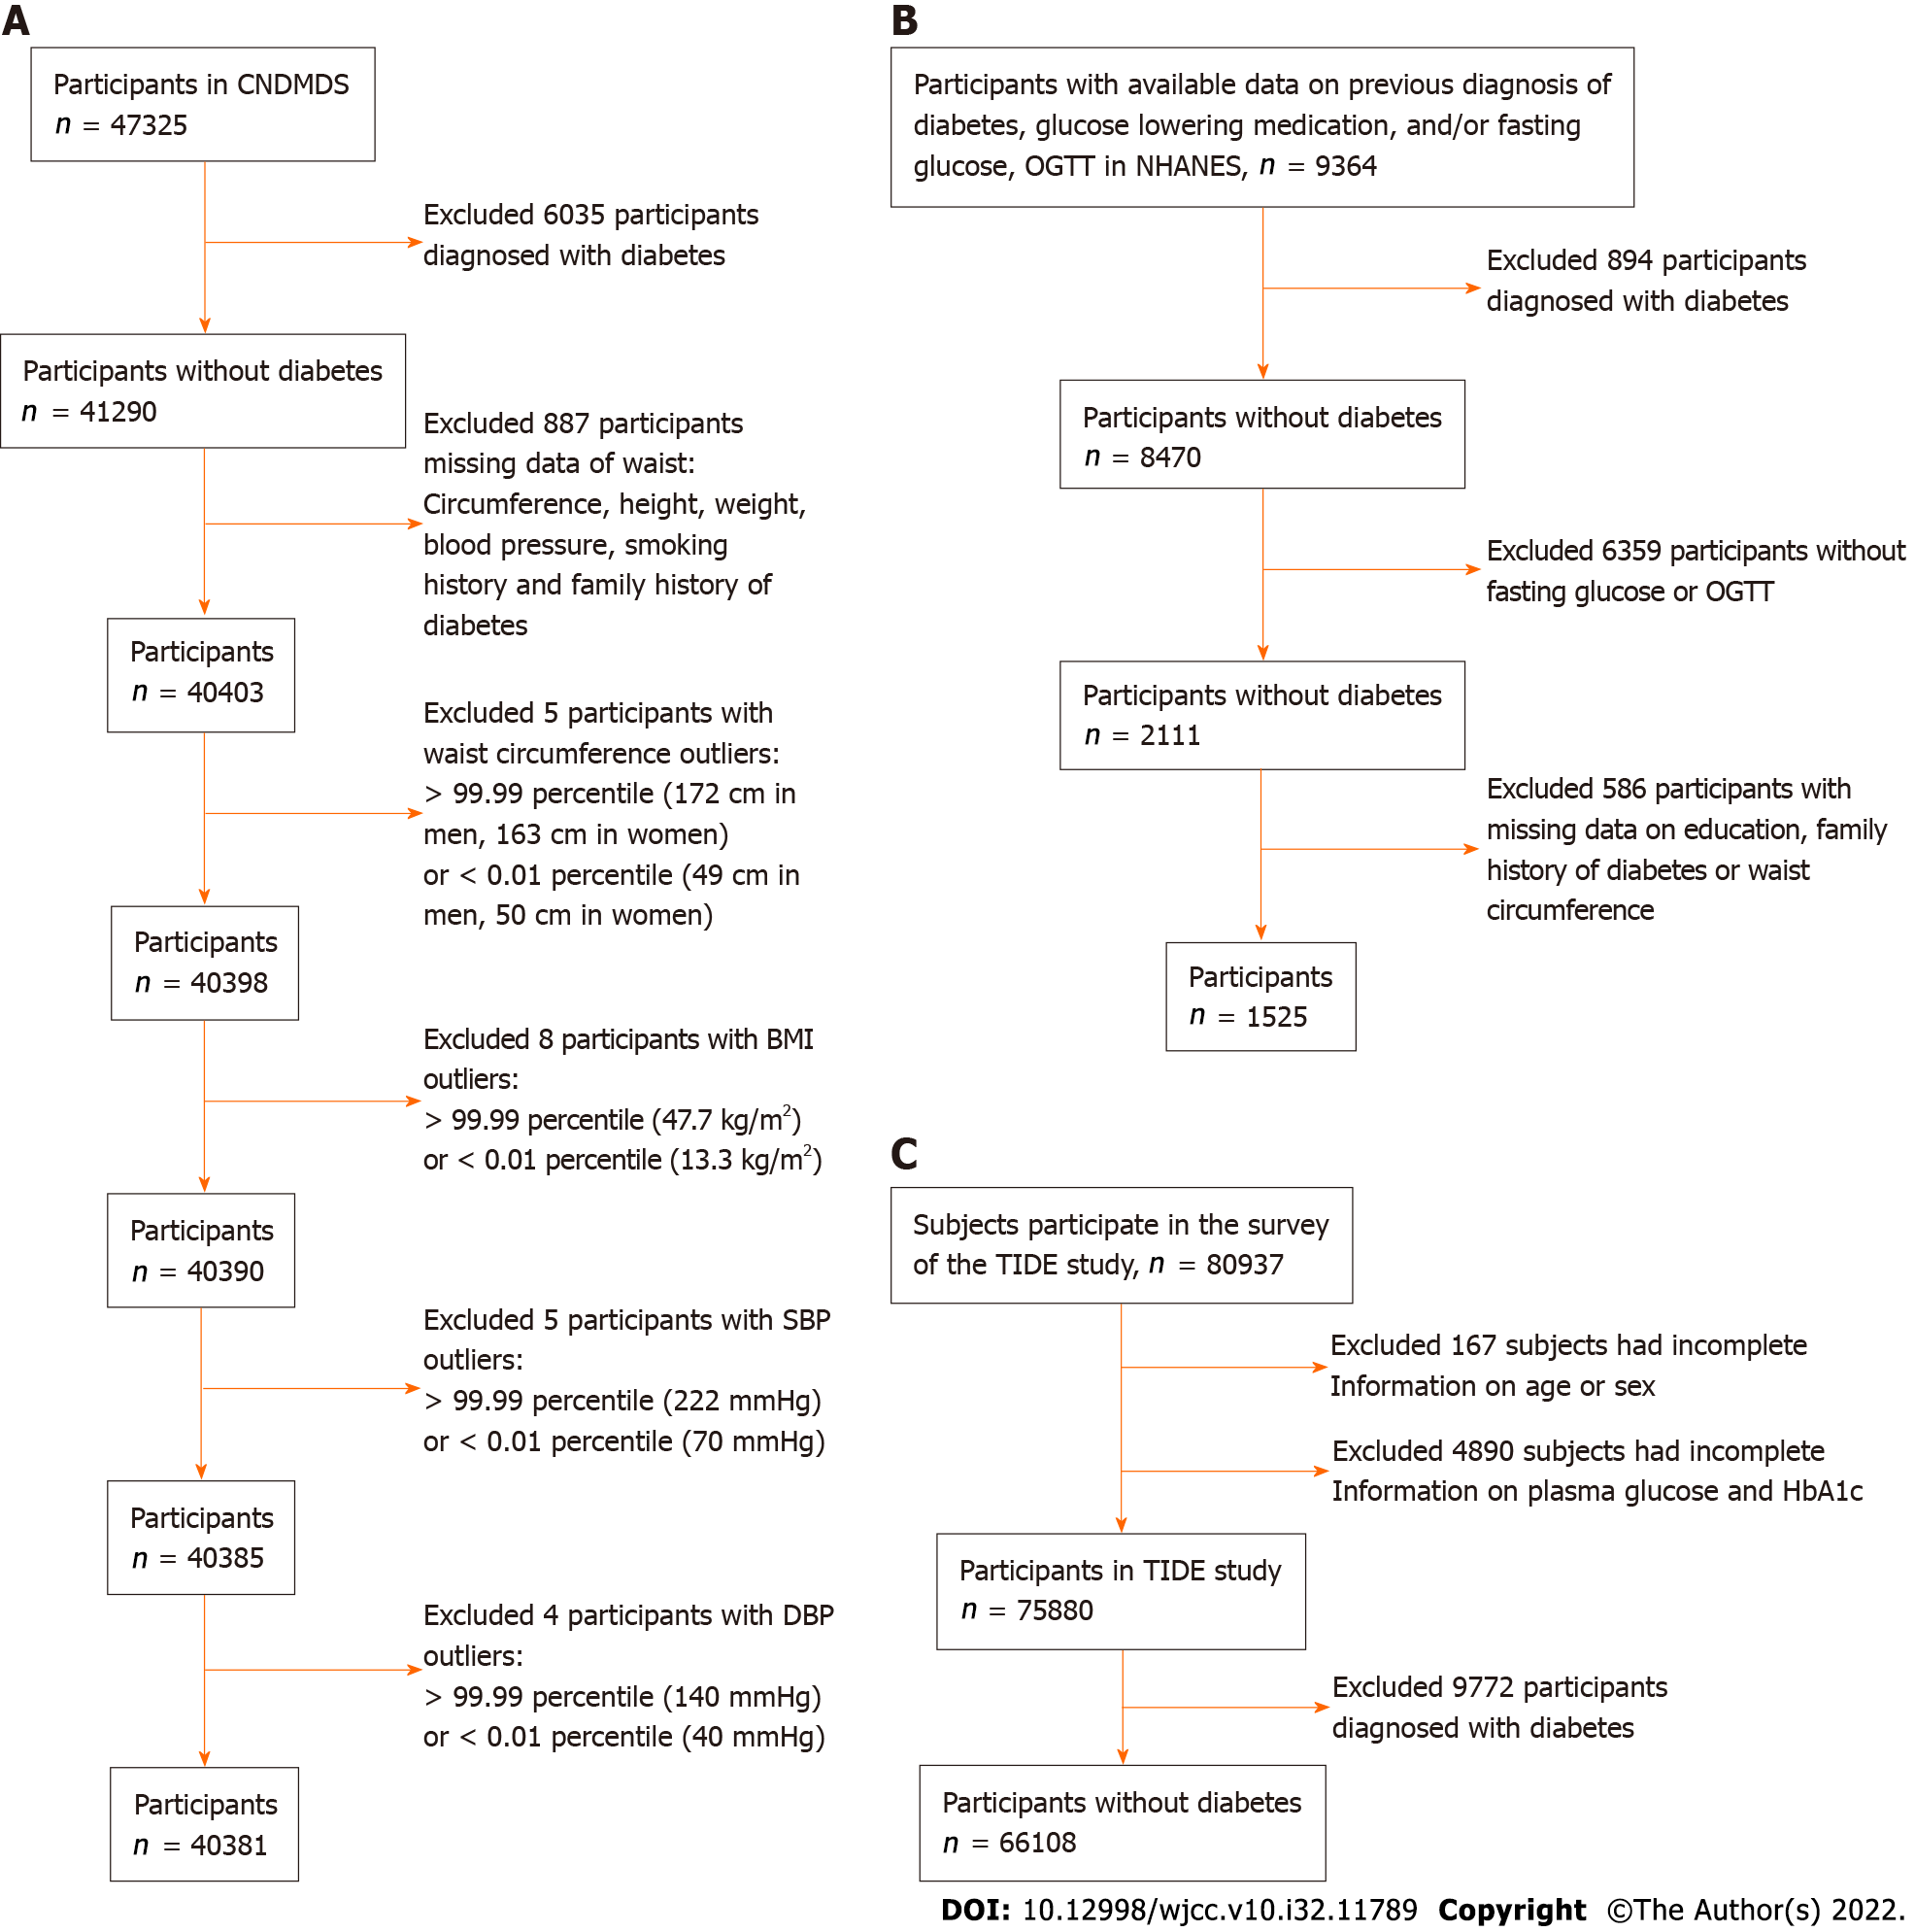
Figure 1 Flowchart for trimmed data in the China National Diabetes and Metabolic Disorders Study derivation dataset, data cleaning in the National Health and Nutrition Examination Survey validation dataset and data arrangement in the Thyroid Disorders, Iodine Status and Diabetes Epidemiological Survey study.
A: In the China National Diabetes and Metabolic Disorders Study (CNDMDS) study, 47325 completed the survey. After excluding 6035 participants diagnosed with diabetes and 887 with missing information on key variables, there were 40403 nondiabetic participants available for our analysis. After excluding those with outlier influences of waist circumference, body mass index, systolic blood pressure and diastolic blood pressure, 40381 participants were ultimately included in the derivation dataset for model development and internal validation; B: In National Health and Nutrition Examination Survey, data from 9364 participants were available. After excluding 894 participants diagnosed with diabetes and 6359 with missing fasting glucose level or oral glucose tolerance test data, there were 2111 nondiabetic participants available for our analysis. After excluding the 586 participants with missing key variables, 1525 nondiabetic individuals were available for external validation; C: In the TIDE study, 80937 subjects participated in the survey. A total of 5057 subjects were excluded due to a lack of information on age, sex, glucose levels or HbA1c. A total of 9772 participants diagnosed with diabetes were further excluded, leaving 66108 participants in the analysis. CNDMDS: China National Diabetes and Metabolic Disorders Study; DBP: Diastolic blood pressure; OGTT: Oral glucose tolerance test; NHANES: National Health and Nutrition Examination Survey; TIDE: Thyroid disorders, Iodine status and Diabetes Epidemiological survey.
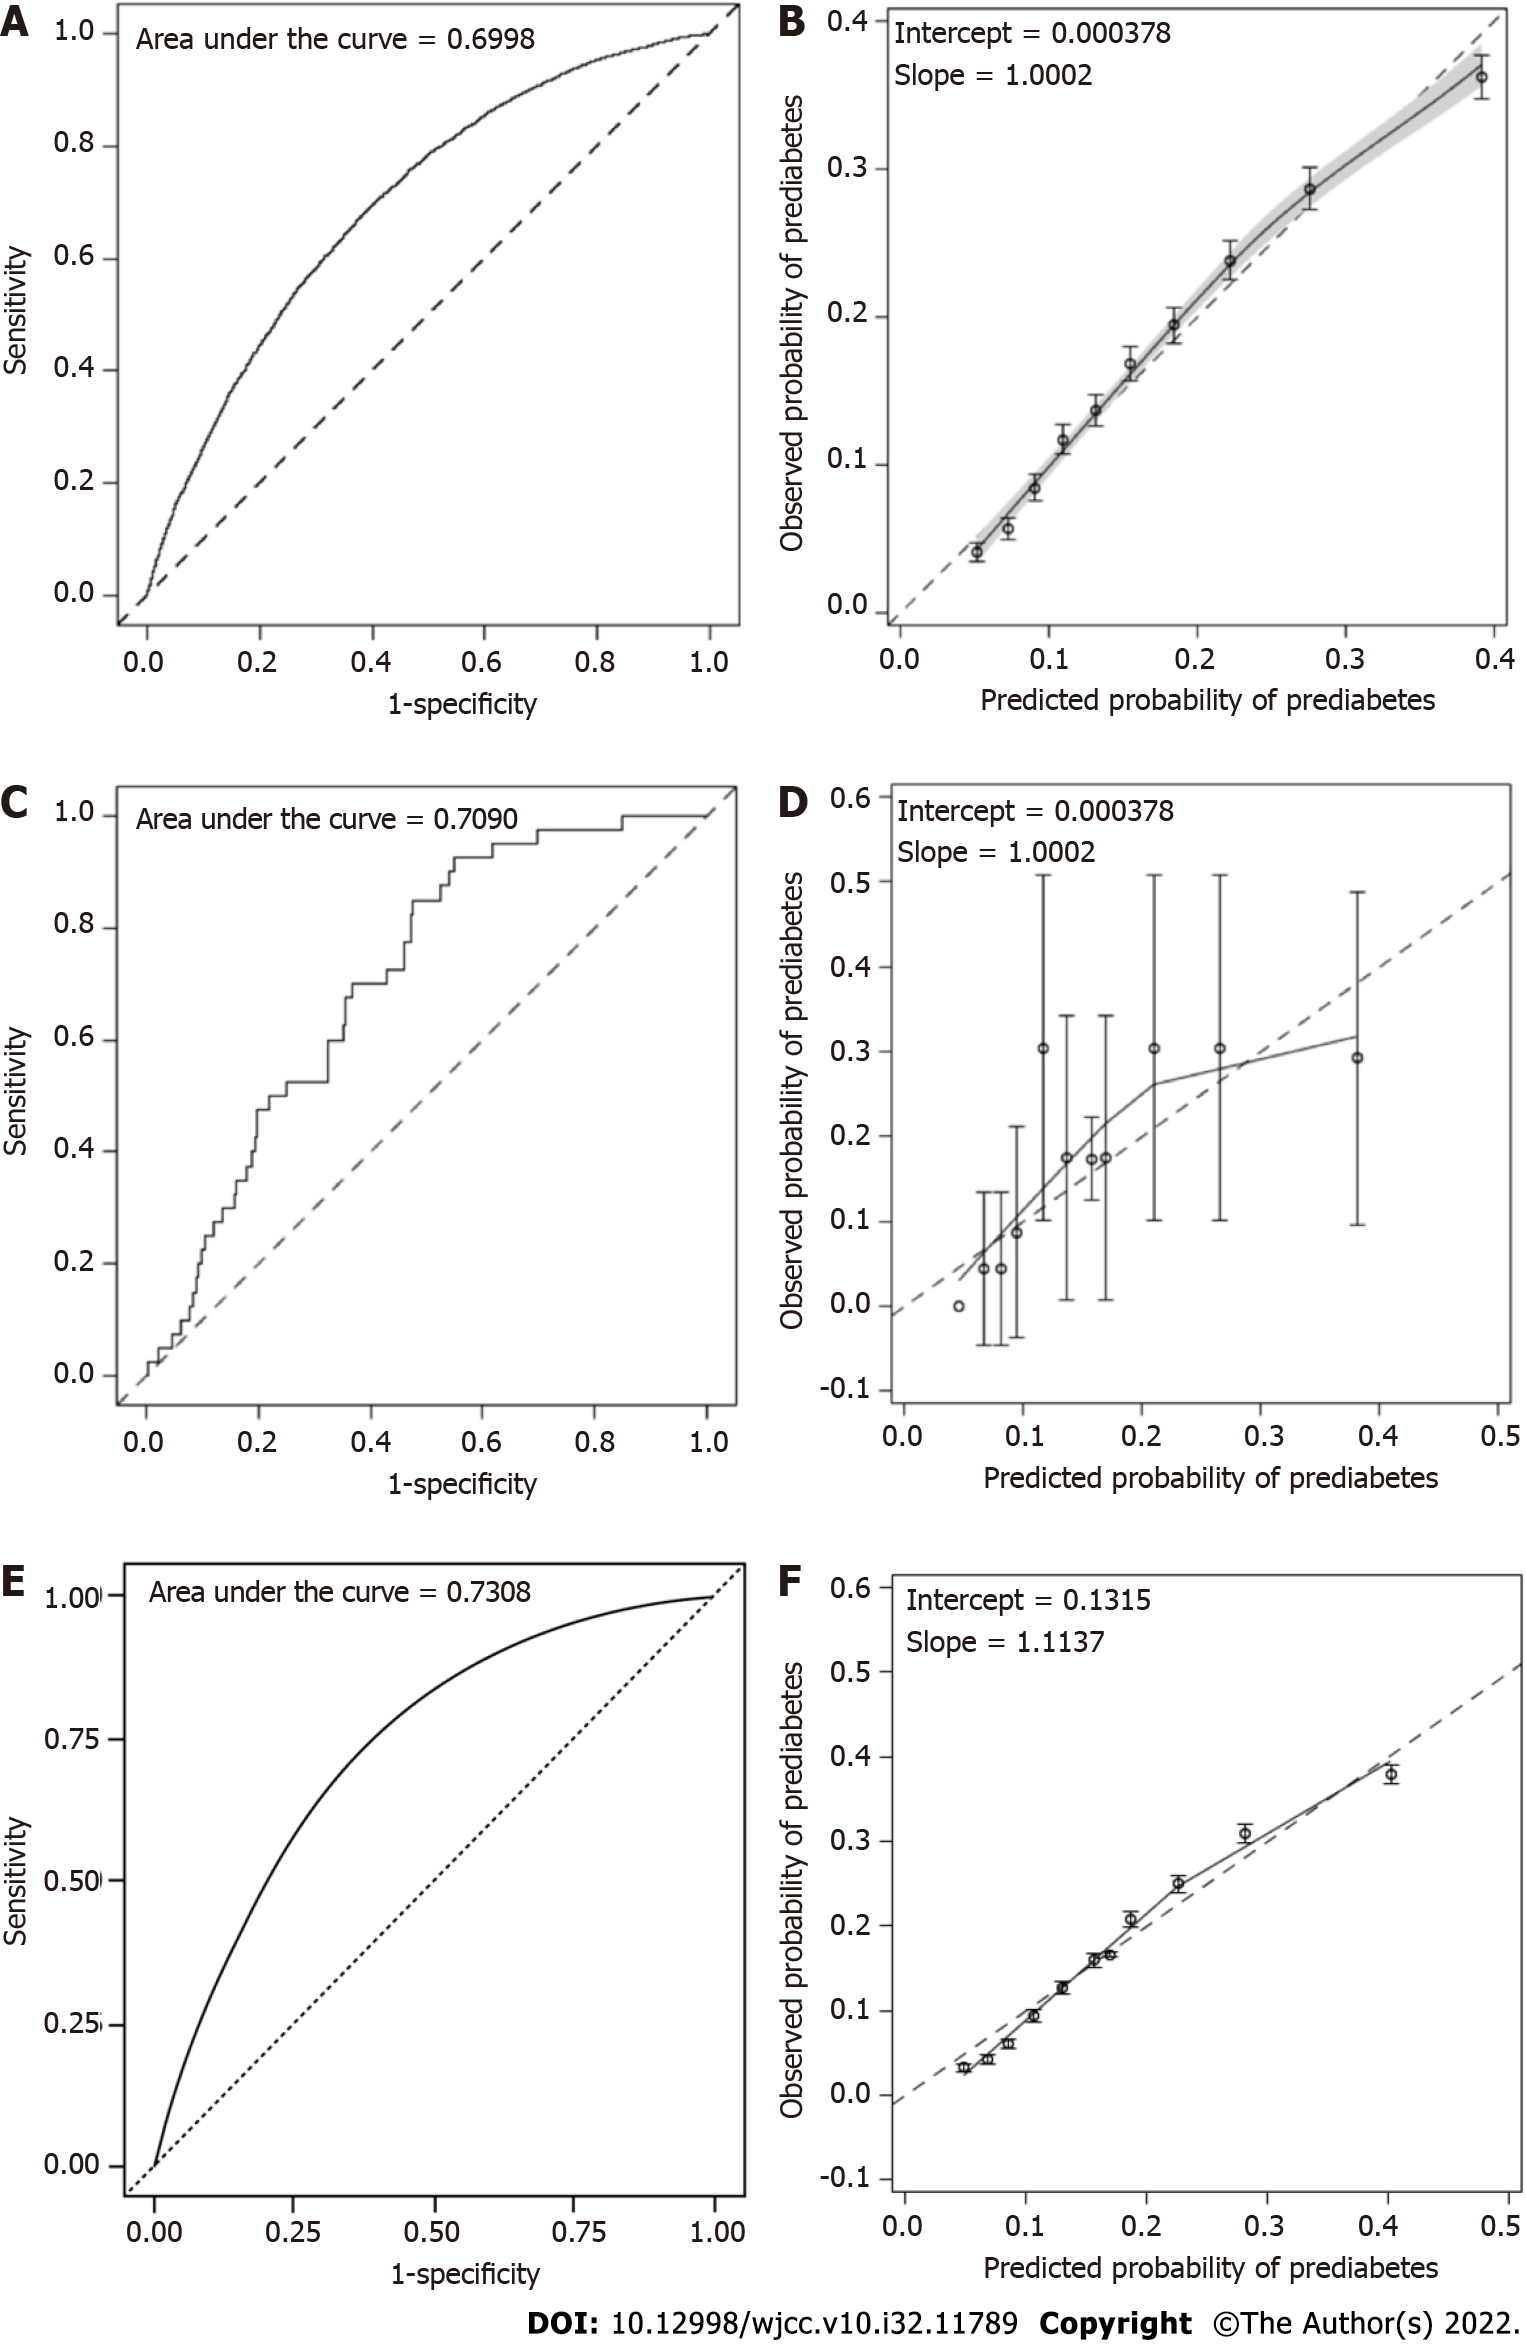
Figure 2 Discrimination and calibration of the prediabetes assessment model in the original population of the China National Diabetes and Metabolic Disorders Study, Asian population of the National Health and Nutrition Examination Survey and population of the Thyroid disorders, Iodine status and Diabetes Epidemiological survey study.
A: Area under the curve (AUC) of the original assessment model in the original population of the China National Diabetes and Metabolic Disorders Study (CNDMDS): The assessment model demonstrated acceptable discrimination, with apparent C statistics of 0.6998 (0.6933, 0.7063) and optimism-corrected C statistics of 0.6992. After recalibration, the C statistics remained the same, and the estimate (95%CI) was 0.6999 (0.6933 to 0.7064); B: Calibration plot of the assessment model in the original population of the CNDMDS: the calibration slope was 1.0002, and the intercept was 0.000378; C: AUC of the prediabetes assessment model: The C statistic was 0.7090 (95%CI: 0.6324 to 0.7857) in the Asian population in National Health and Nutrition Examination Survey (NHANES); D: Calibration plot of the assessment model: The calibration slope was 0.9238, and the intercept was 0.000376 in the Asian population in the NHANES; E: AUC of the prediabetes assessment model: The C statistic was 0.7308 (95%CI: 0.7260 to 0.7357) in the population of the Thyroid disorders, Iodine status and Diabetes Epidemiological survey (TIDE) study; F: Calibration plot of the assessment model: the calibration slope was 1.1137, and the intercept was 0.1315 in the population of the TIDE study.
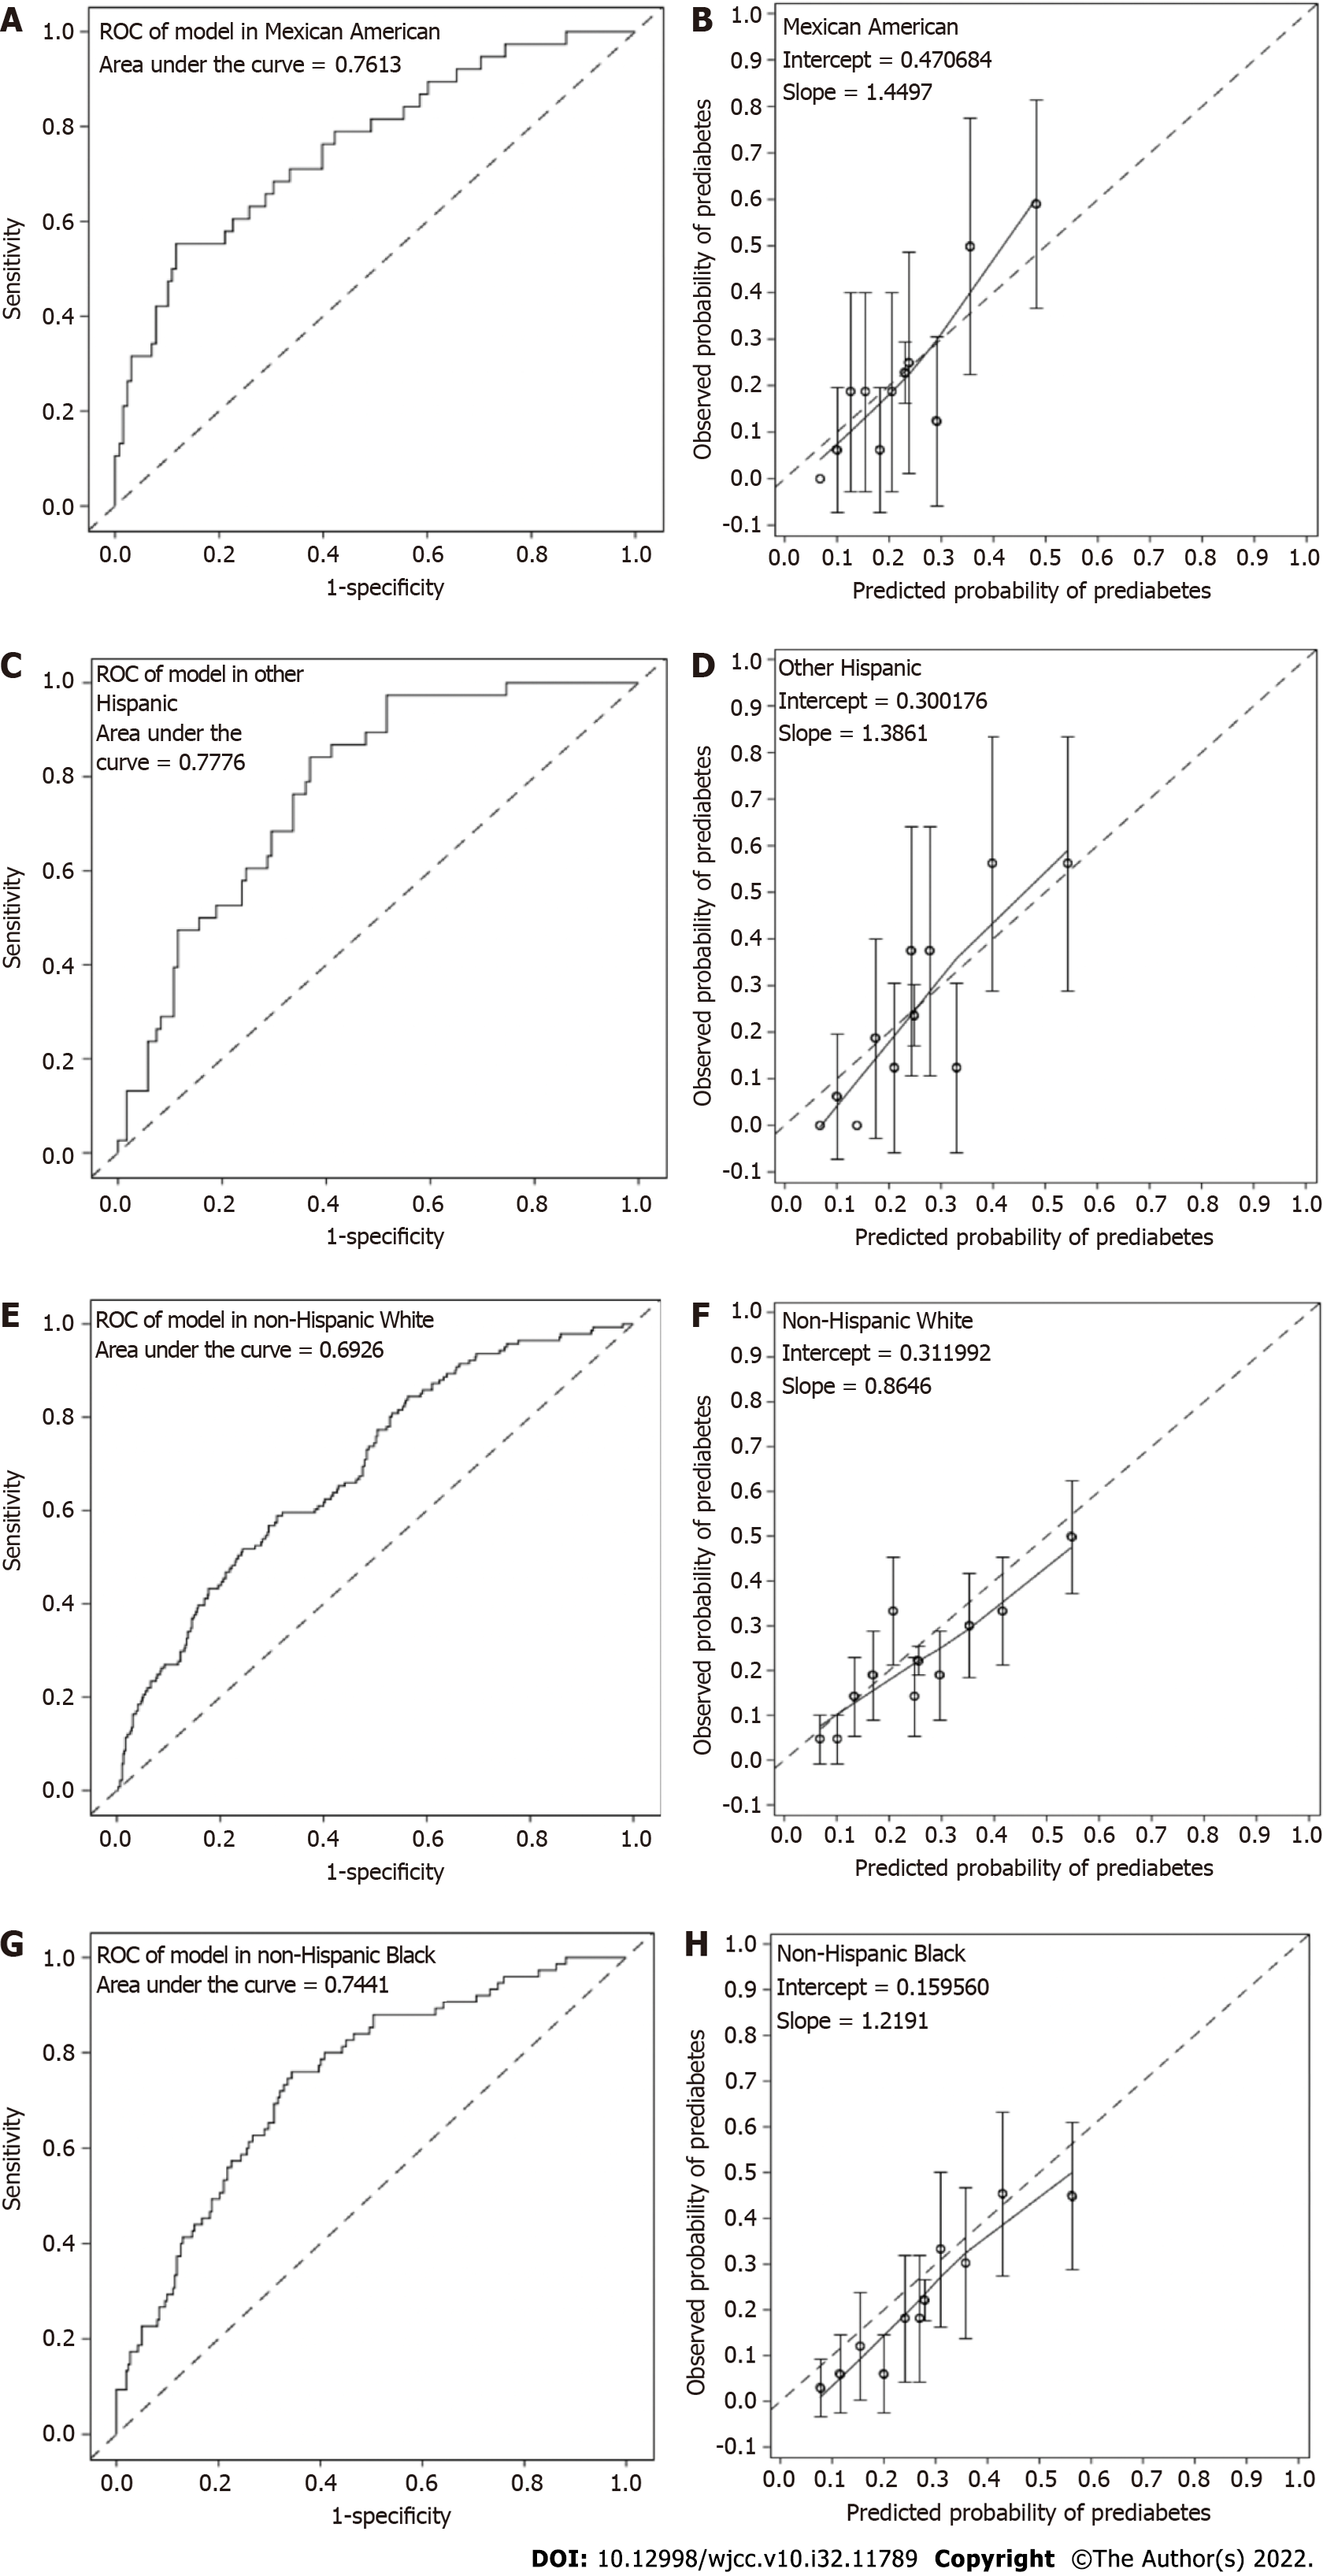
Figure 3 Discrimination and calibration of the prediabetes prediction model in external validation among diverse populations in National Health and Nutrition Examination Survey.
A: Area under the curve (AUC) of the model validated in Mexican American. The estimates (95% confidence interval) were 0.7613 (0.6725, 0.8502) in Mexican American; B: Calibration plot of the model in Mexican American. Hosmer-Leme show tests indicated good calibration of the model in Mexican American (P > 0.05); C: AUC of the model validated in other Hispanic. The estimates (95% confidence interval) were 0.7776 (0.7022, 0.8530) in other Hispanic; D: Calibration plot of the model in other Hispanic. Hosmer-Leme show tests indicated good calibration of the model in other Hispanic (P > 0.05); E: AUC of the model validated in non-Hispanic White. The estimates (95% confidence interval) were 0.6926 (0.6449, 0.7404) in non-Hispanic White; F: Calibration plot of the model in non-Hispanic White. Hosmer-Leme show tests indicated poor calibration in the White population with overestimated prediabetes risk (P = 0.016); G: AUC of the model validated in non-Hispanic Black. The estimates (95% confidence interval) were 0.7441 (0.6828, 0.8053) in non-Hispanic Black; H: Calibration plot of the model in non-Hispanic Black. Hosmer-Leme show tests indicated good calibration of the model in non-Hispanic Black (P > 0.05).
- Citation: Yu LP, Dong F, Li YZ, Yang WY, Wu SN, Shan ZY, Teng WP, Zhang B. Development and validation of a risk assessment model for prediabetes in China national diabetes survey. World J Clin Cases 2022; 10(32): 11789-11803
- URL: https://www.wjgnet.com/2307-8960/full/v10/i32/11789.htm
- DOI: https://dx.doi.org/10.12998/wjcc.v10.i32.11789


