Copyright
©The Author(s) 2022.
World J Clin Cases. Nov 16, 2022; 10(32): 11726-11742
Published online Nov 16, 2022. doi: 10.12998/wjcc.v10.i32.11726
Published online Nov 16, 2022. doi: 10.12998/wjcc.v10.i32.11726
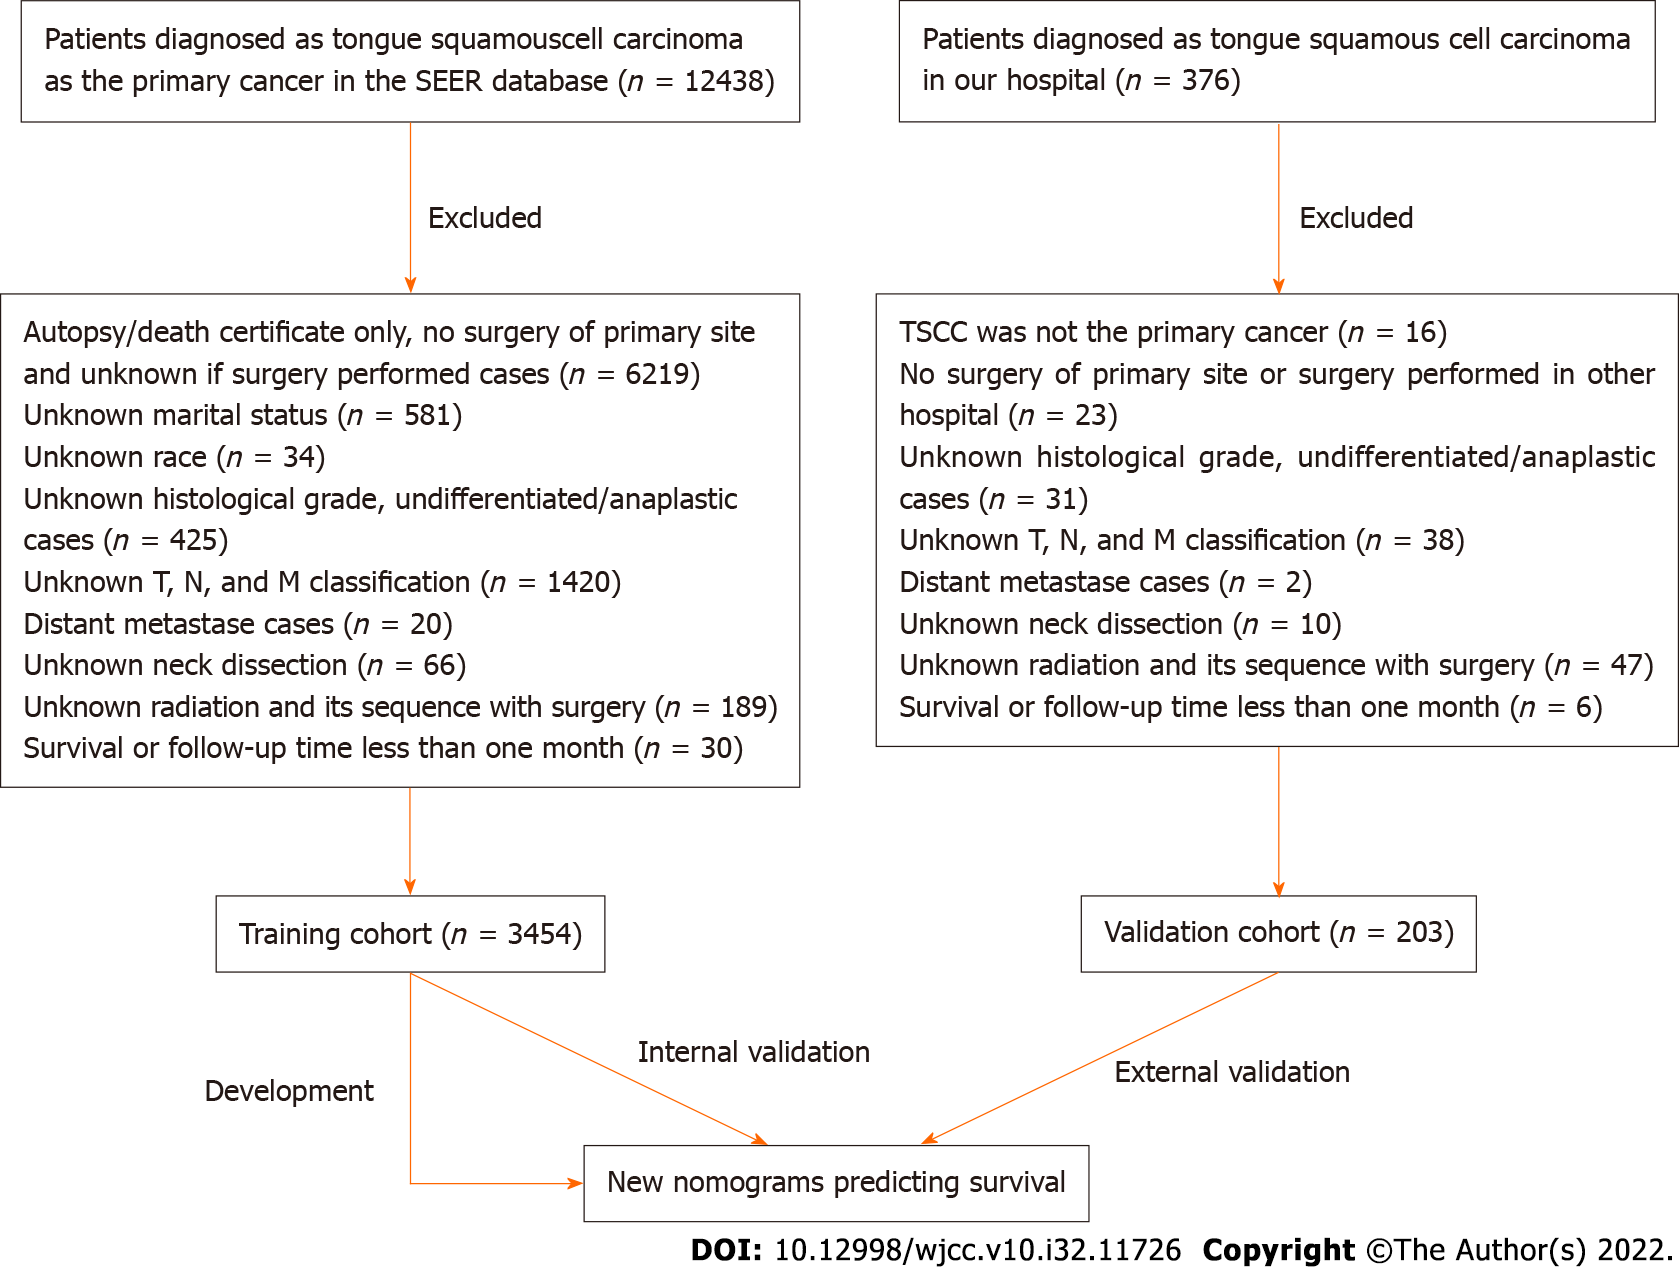
Figure 1 Flowchart of data selection.
SEER: Surveillance, Epidemiology, and End Results; TSCC: Tongue squamous cell carcinoma.
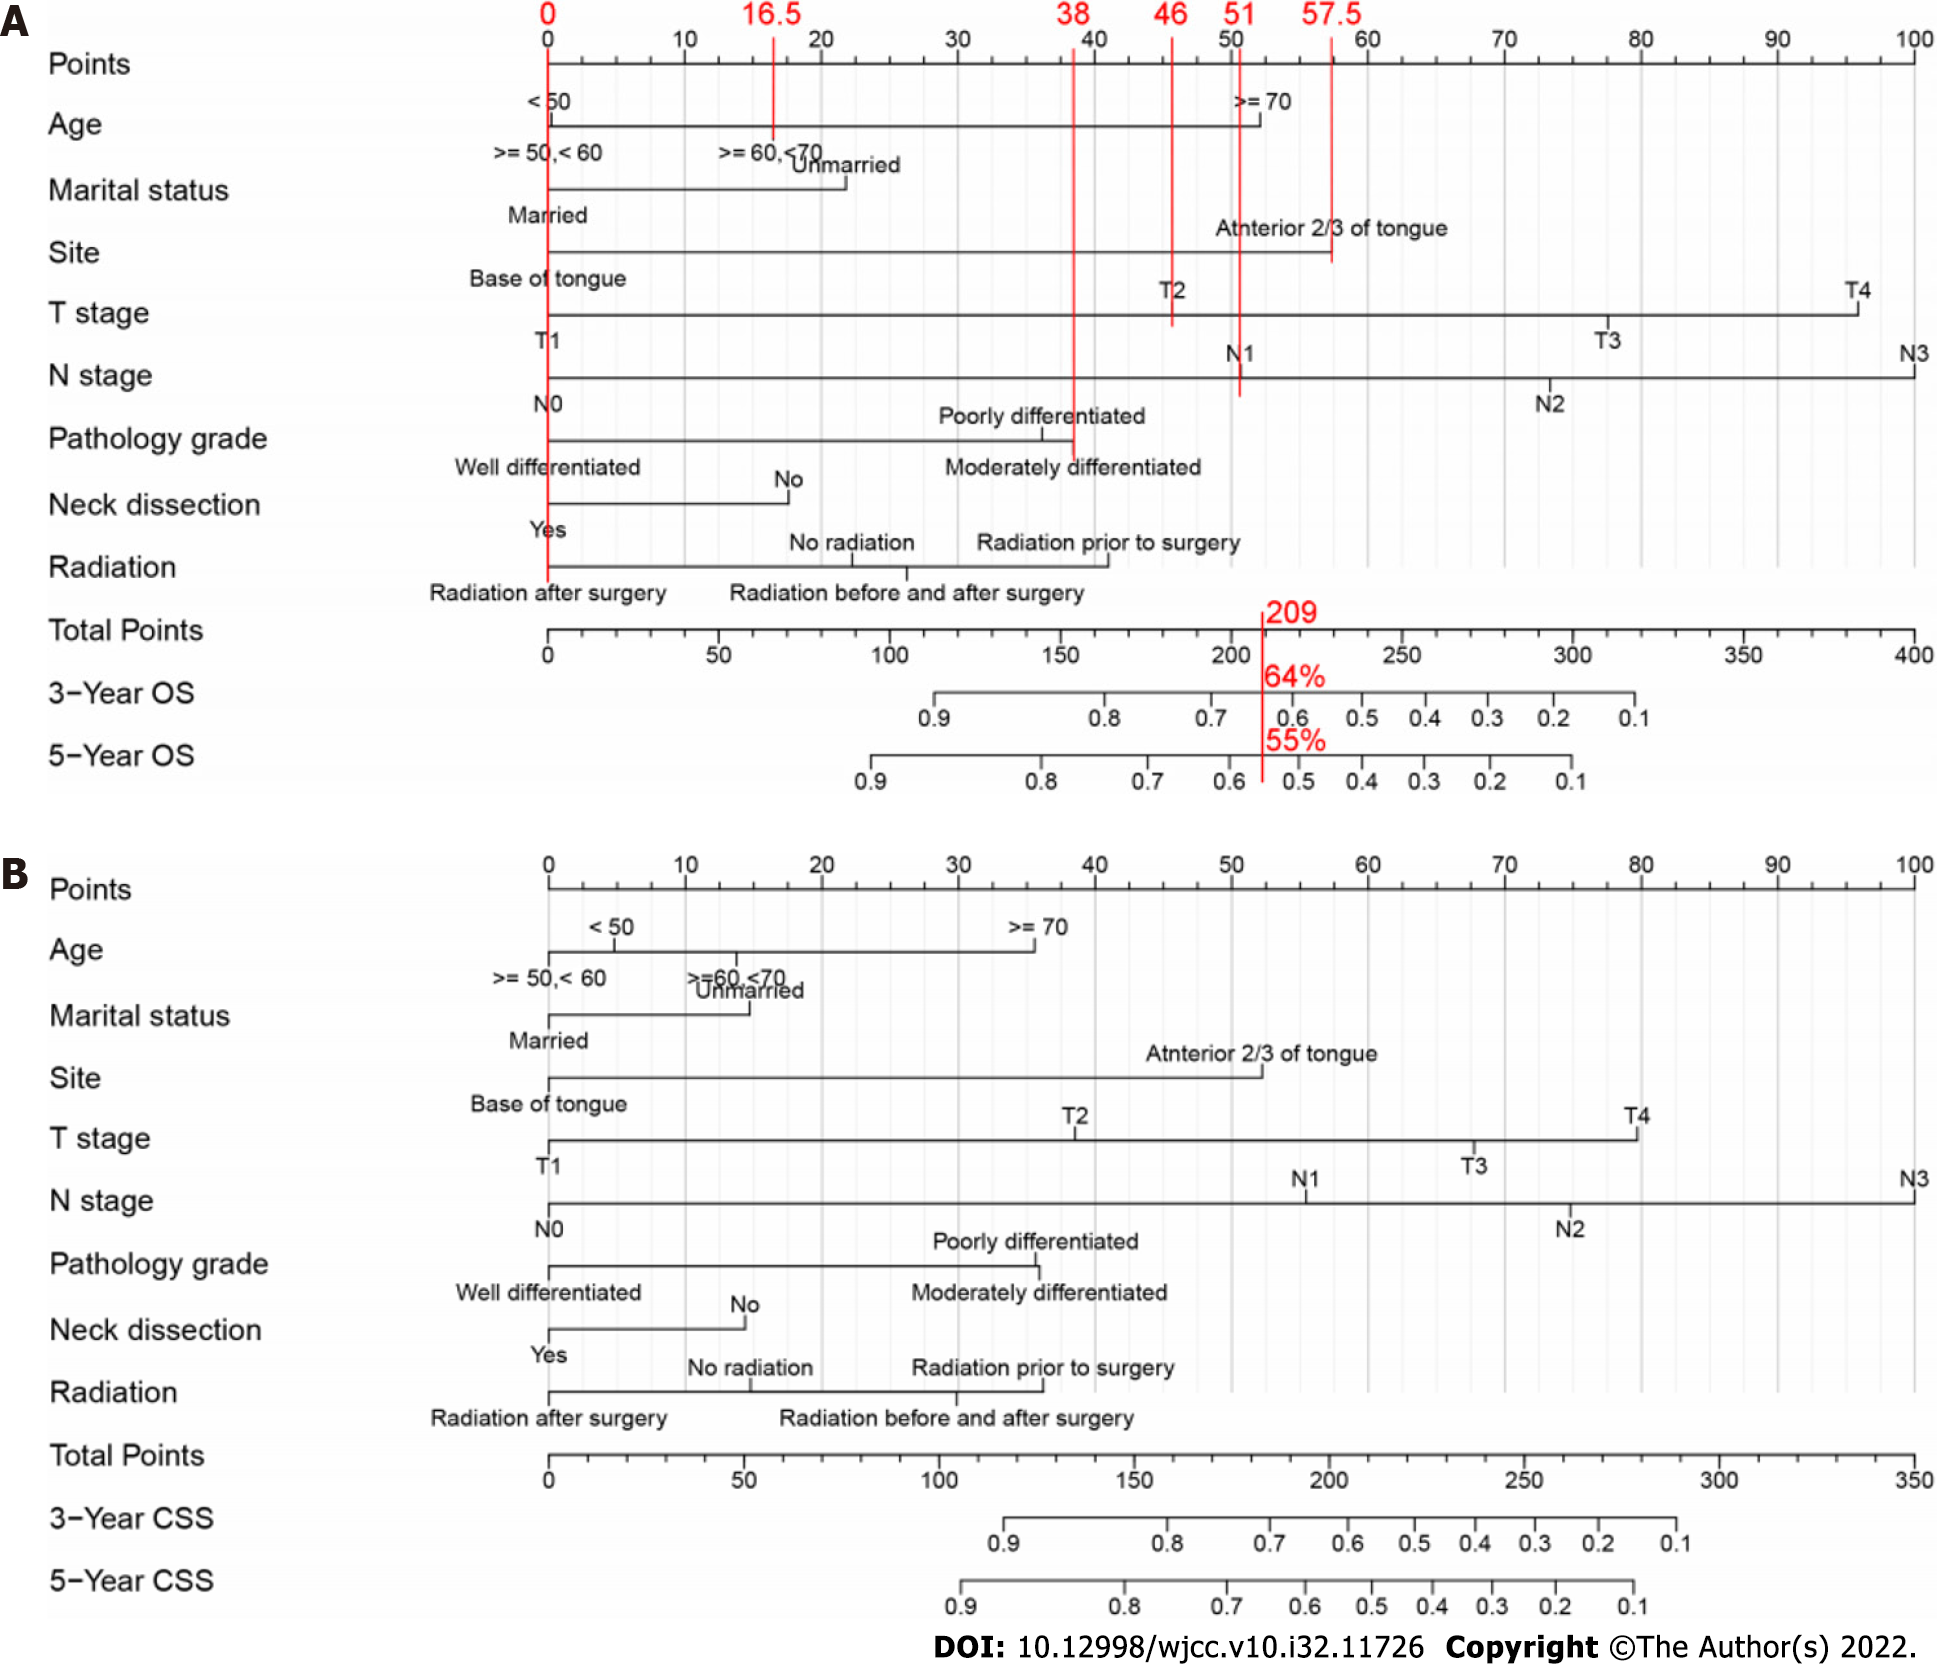
Figure 2 Nomograms predicting the 3- and 5-year overall survival and cancer-specific survival in patients with squamous cell carcinoma of the tongue.
A: Nomogram predicting the 3- and 5-year overall survival (OS) in patients with squamous cell carcinoma of the tongue (TSCC); B: Nomogram predicting the 3- and 5-year cancer-specific survival (CSS) in patients with TSCC. The points for each variable were summed, and the probabilities of 3- and 5-year OS and CSS were predicted based on the total number of points (shown at the bottom of the nomogram). For example, consider a 60-year-old unmarried patient with moderately differentiated T2 and N1 stage cancer on the anterior 2/3 of tongue who underwent neck dissection and postoperative chemotherapy. Top red lines represent the points for each variable, the sum (209) of these points is the total score, and the bottom red line indicates the probabilities of 3- (64%) and 5-year (55%) overall survival.
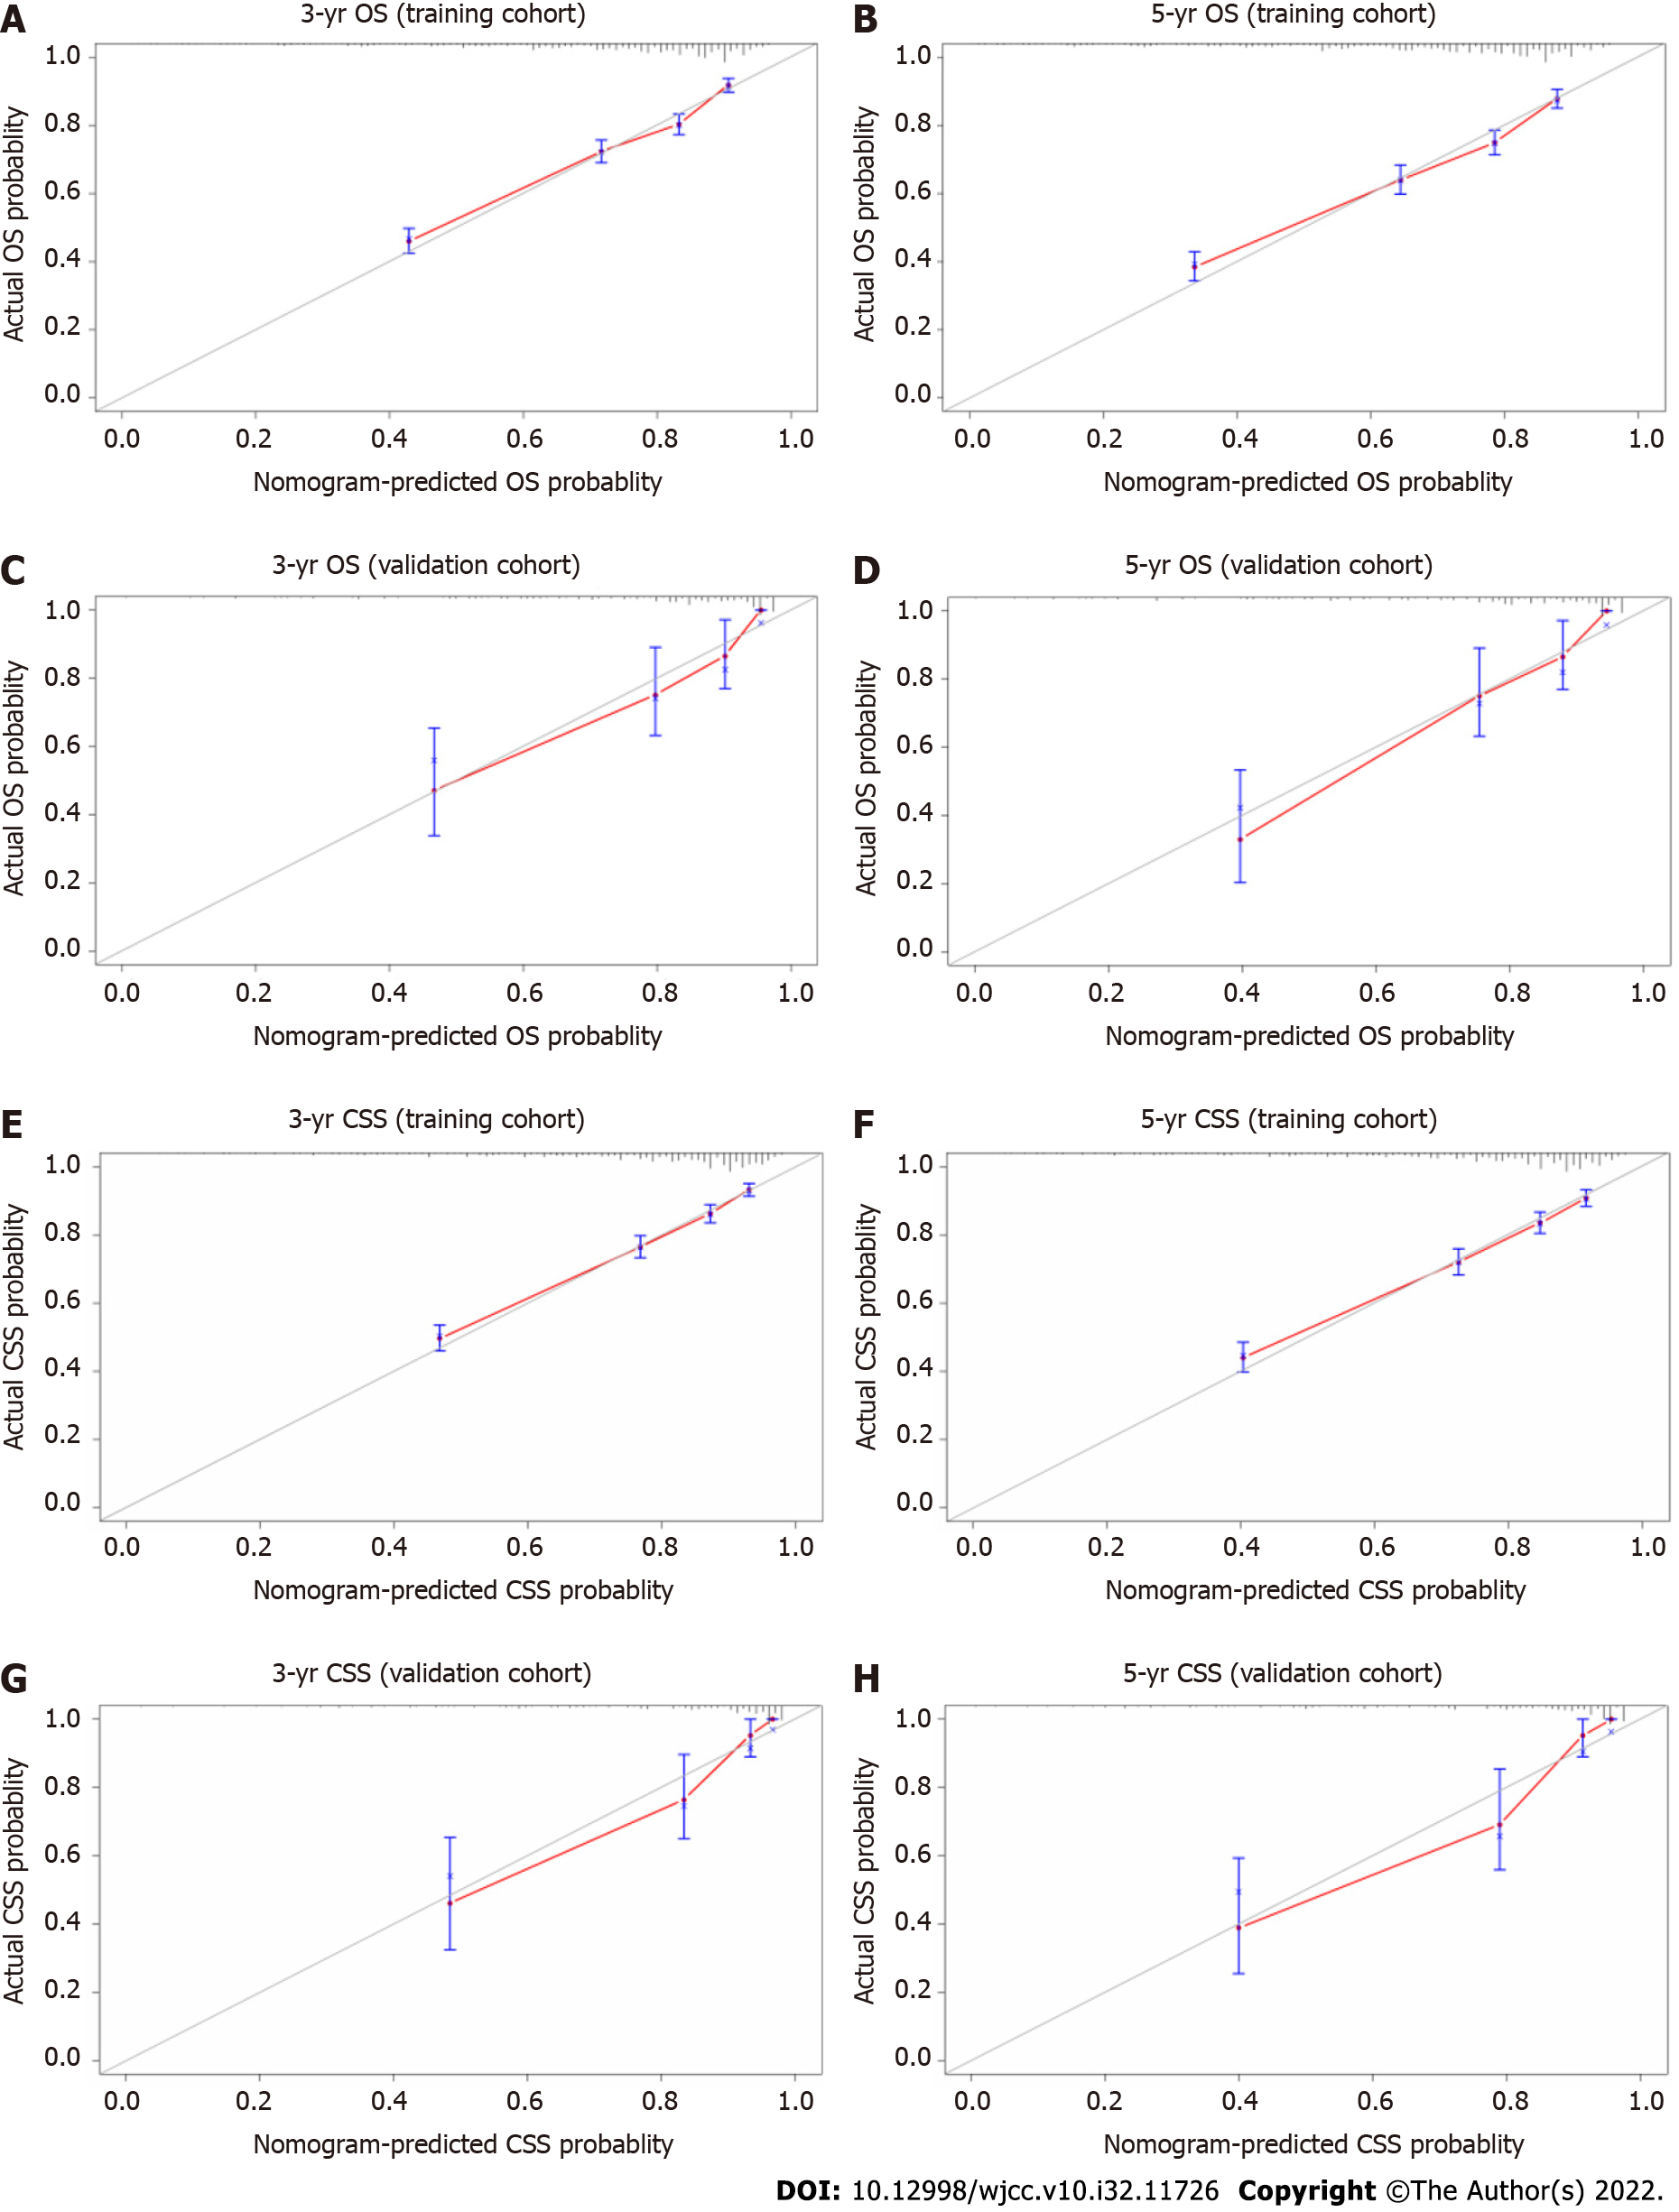
Figure 3 Calibration curves for 3- and 5-year overall survival and 3- and 5-year cancer-specific survival in patients with squamous cell carcinoma of the tongue.
A: Calibration curves for 3-year overall survival (OS) in the training cohort; B: Calibration curves for 5-year OS in the training cohort; C: Calibration curves for 3-year OS in the validation cohort; D: Calibration curves for 5-year OS in the validation cohort; E: Calibration curves for 3-year cancer-specific survival (CSS) in the training cohort; F: Calibration curves for 5-year CSS in the training cohort; G: Calibration curves for 3-year CSS in the validation cohort; H: Calibration curves for 5-year CSS in the validation cohort. The gray line indicates perfect prediction. Blue lines indicate 95% confidence intervals (CIs). The red line indicates nomogram performance. Red and gray lines close together indicates greater nomogram accuracy.
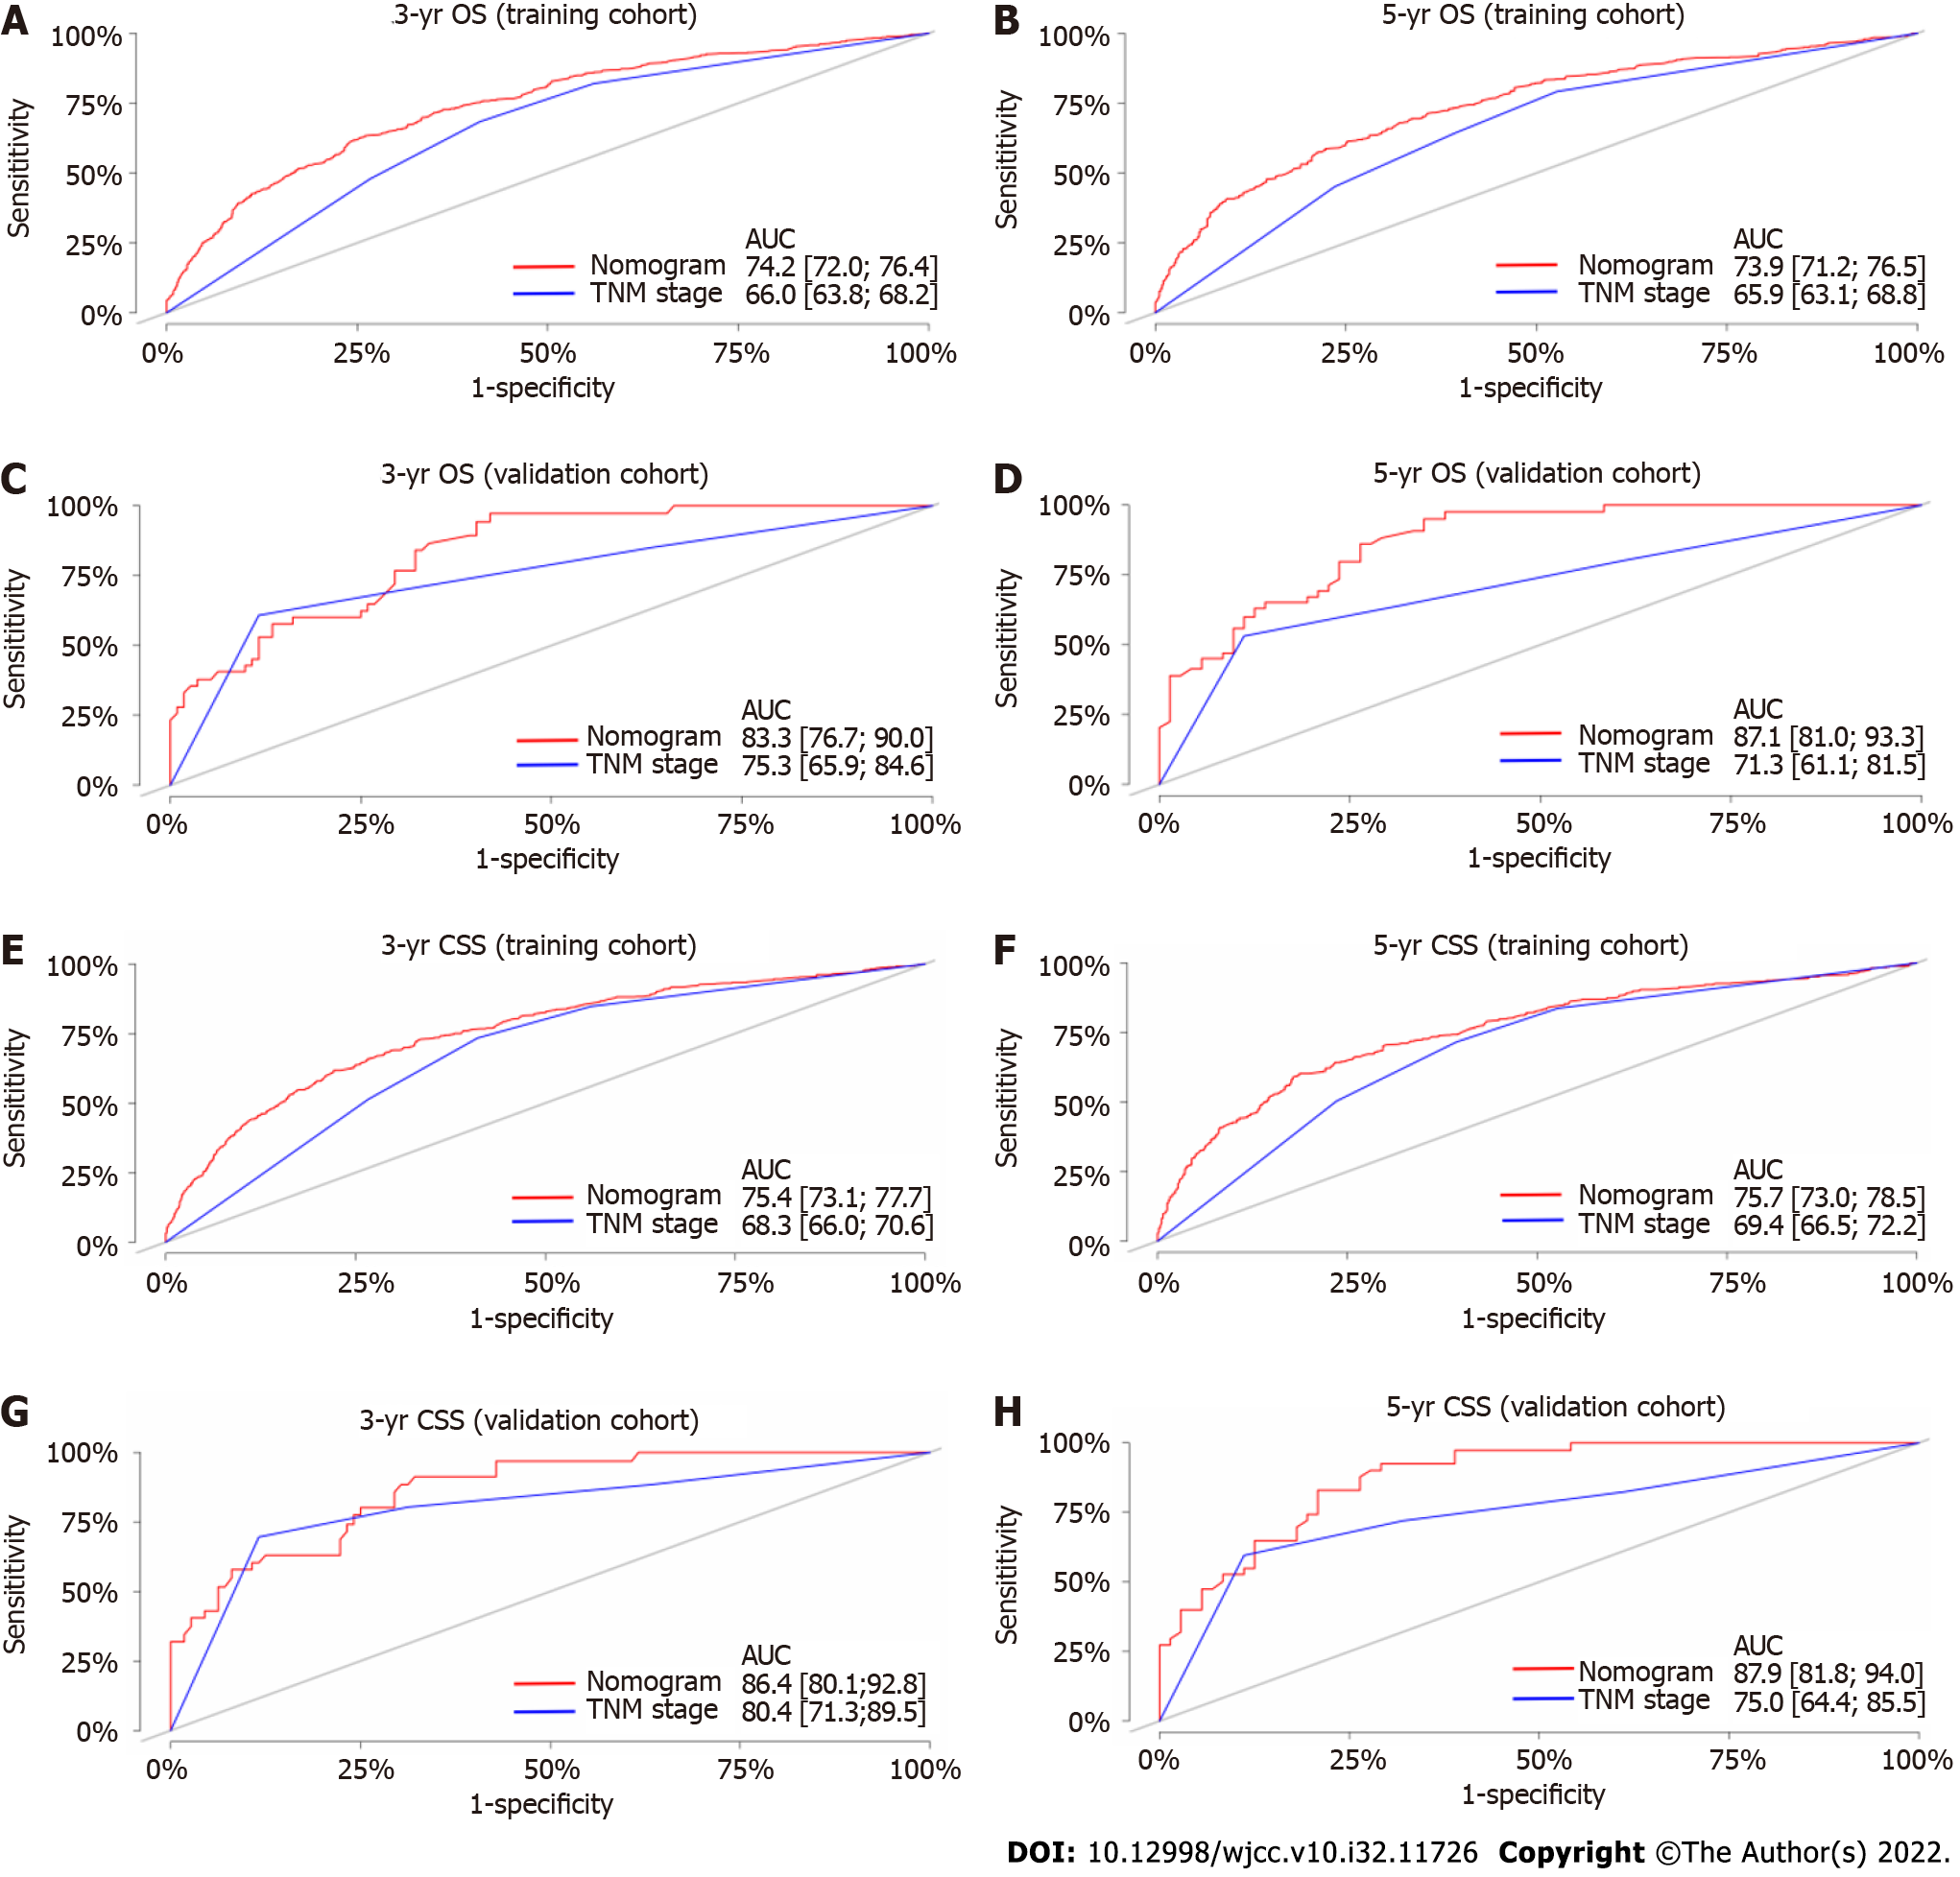
Figure 4 Receiver operating characteristic curves of the nomograms and tumor-node-metastasis staging system for overall survival and cancer-specific survival in patients with squamous cell carcinoma of the tongue.
A: Receiver operating characteristic curves (ROC) for 3-year overall survival (OS) in the training cohort; B: ROC for 5-year OS in the training cohort; C: ROC for 3-year OS in the validation cohort; D: ROC for 5-year OS in the validation cohort; E: ROC for 3-year cancer-specific survival (CSS) in the training cohort; F: ROC for 5-year CSS in the training cohort; G: ROC for 3-year CSS in the validation cohort; H: ROC for 5-year CSS in the validation cohort. TNM: Tumor-node-metastasis.
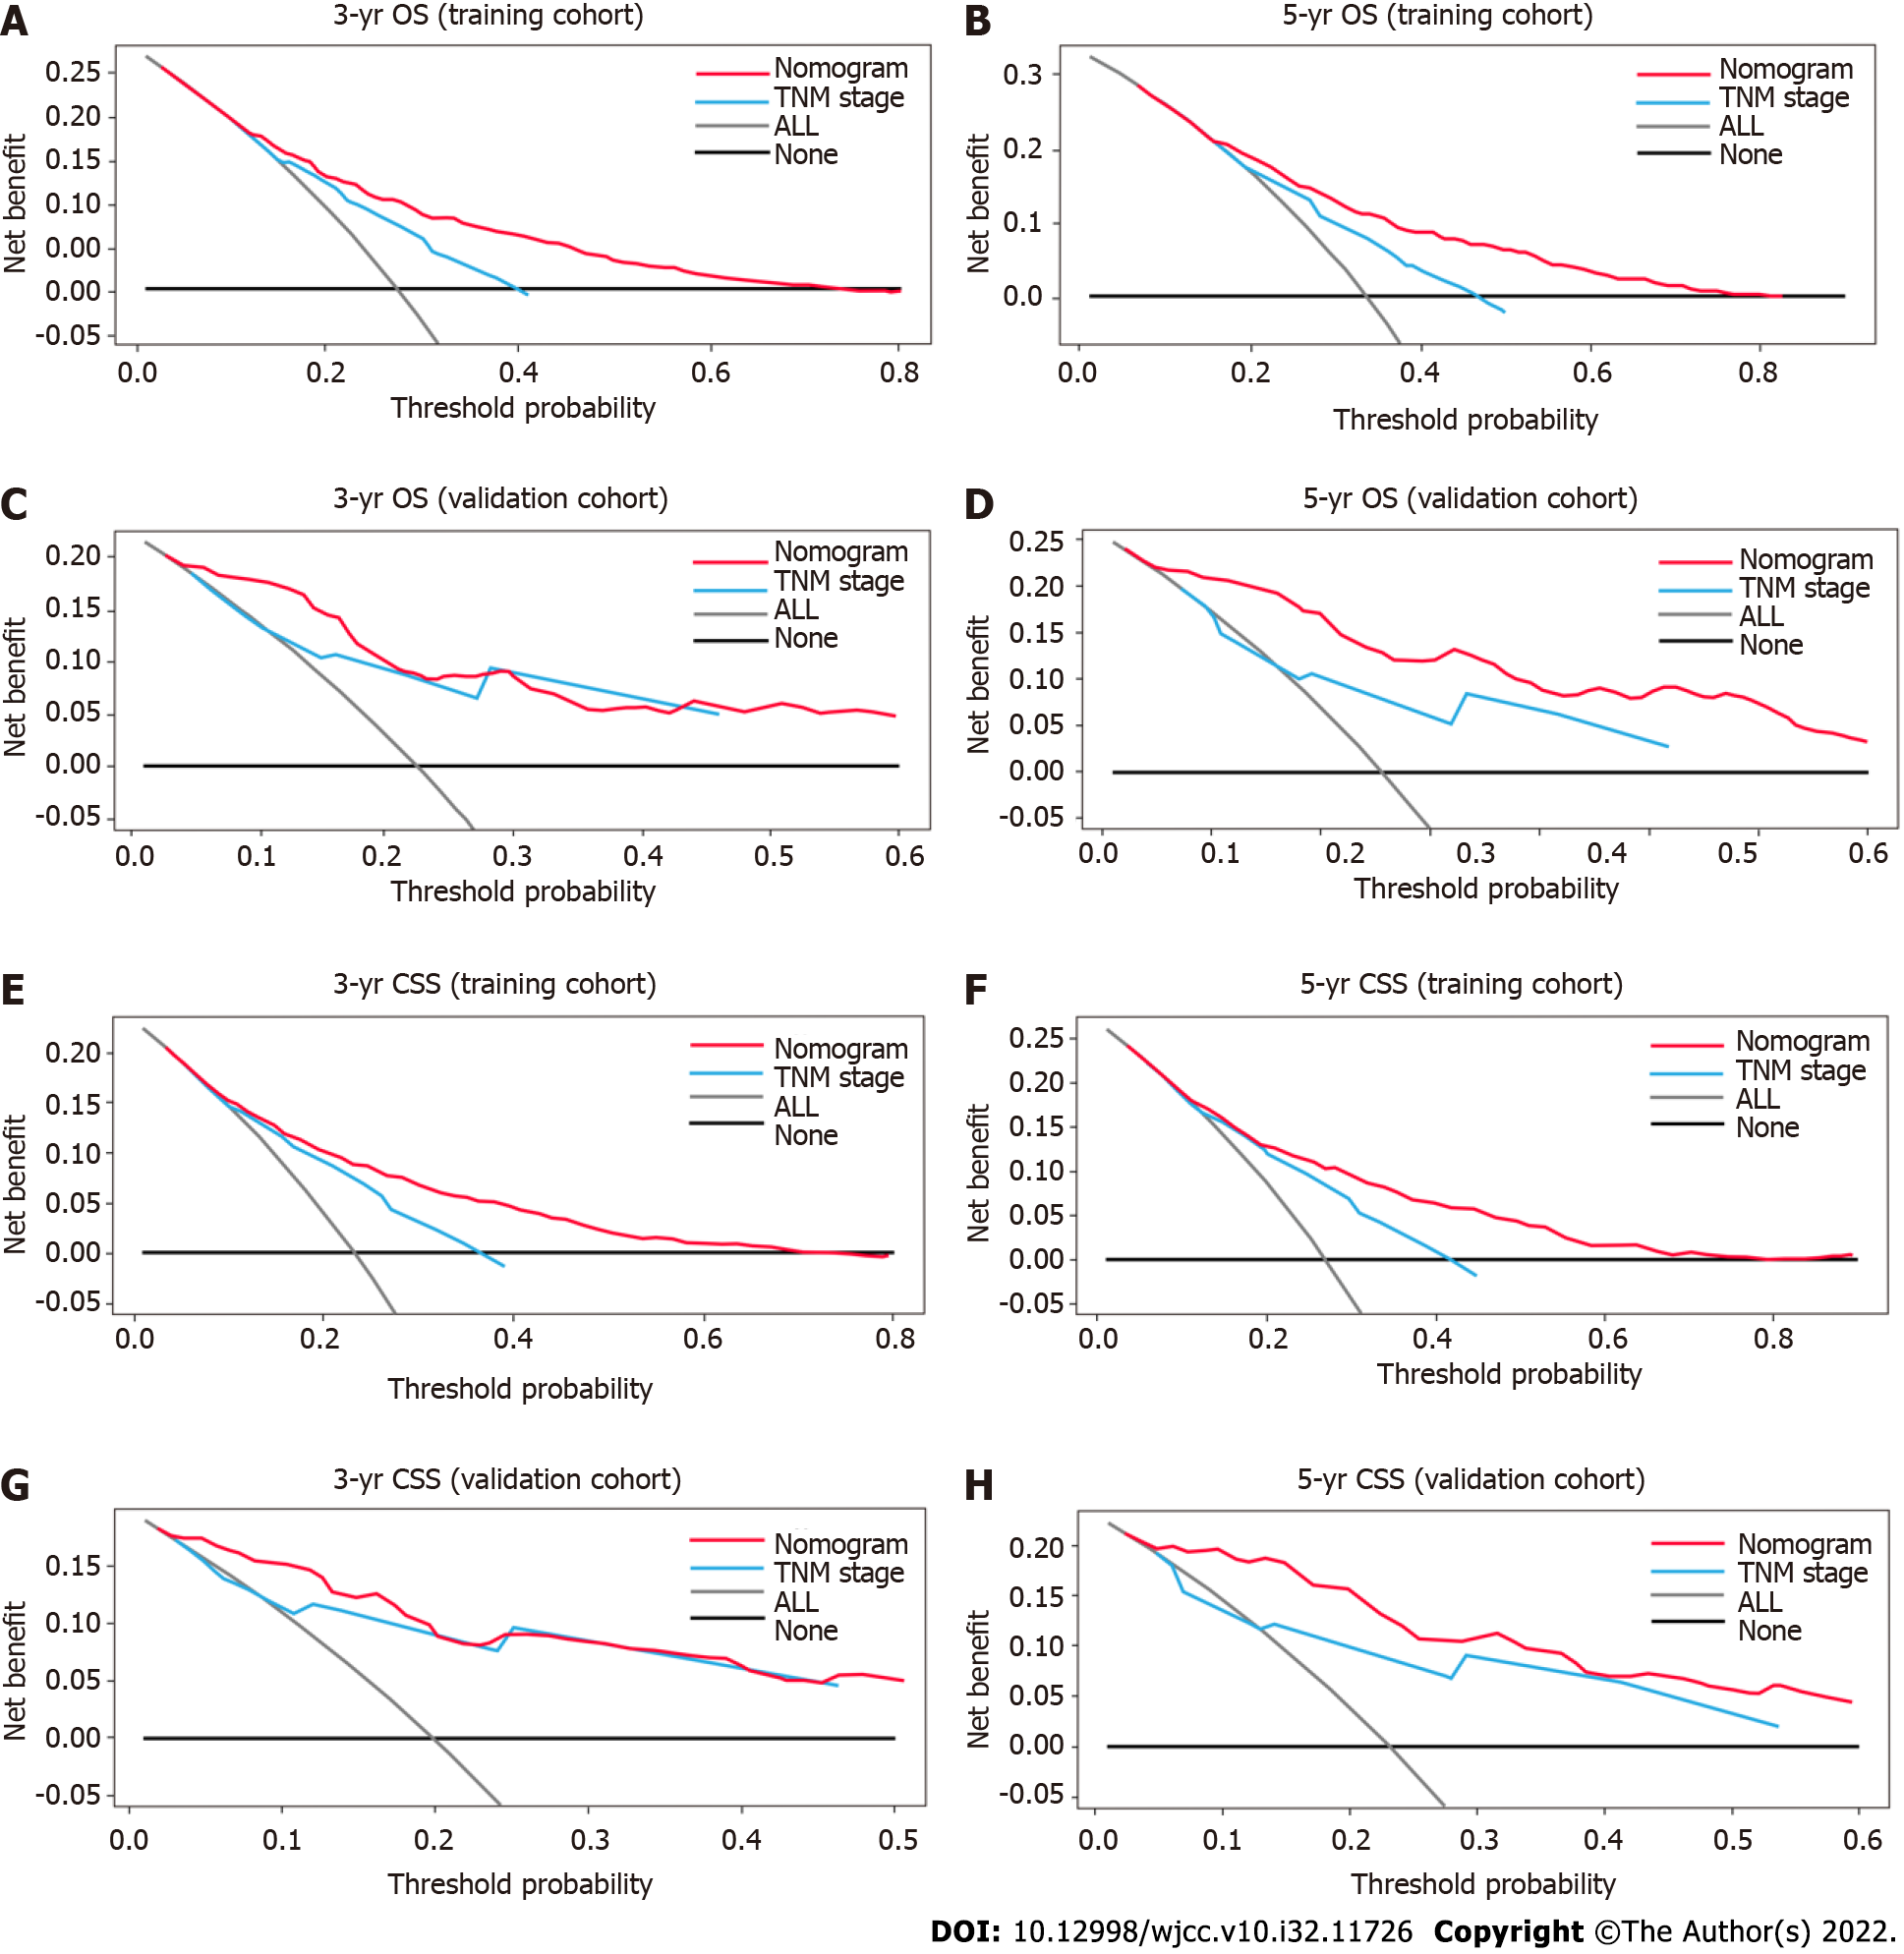
Figure 5 Decision curve analysis of the accuracy of the nomograms and tumor-node-metastasis staging system for predicting overall survival and cancer-specific survival in patients with squamous cell carcinoma of the tongue.
A: 3-year overall survival (OS) benefits in the training cohort; B: 5-year OS benefits in the training cohort; C: 3-year OS benefits in the validation cohort; D: 5-year OS benefits in the validation cohort; E: 3-year cancer-specific survival (CSS) benefits in the training cohort; F: 5-year CSS benefits in the training cohort; G: 3-year CSS benefits in the validation cohort; H: 5-year CSS benefits in the validation cohort. TNM: Tumor-node-metastasis.
- Citation: Luo XY, Zhang YM, Zhu RQ, Yang SS, Zhou LF, Zhu HY. Development and validation of novel nomograms to predict survival of patients with tongue squamous cell carcinoma. World J Clin Cases 2022; 10(32): 11726-11742
- URL: https://www.wjgnet.com/2307-8960/full/v10/i32/11726.htm
- DOI: https://dx.doi.org/10.12998/wjcc.v10.i32.11726


