Copyright
©The Author(s) 2022.
World J Clin Cases. Oct 26, 2022; 10(30): 11066-11073
Published online Oct 26, 2022. doi: 10.12998/wjcc.v10.i30.11066
Published online Oct 26, 2022. doi: 10.12998/wjcc.v10.i30.11066
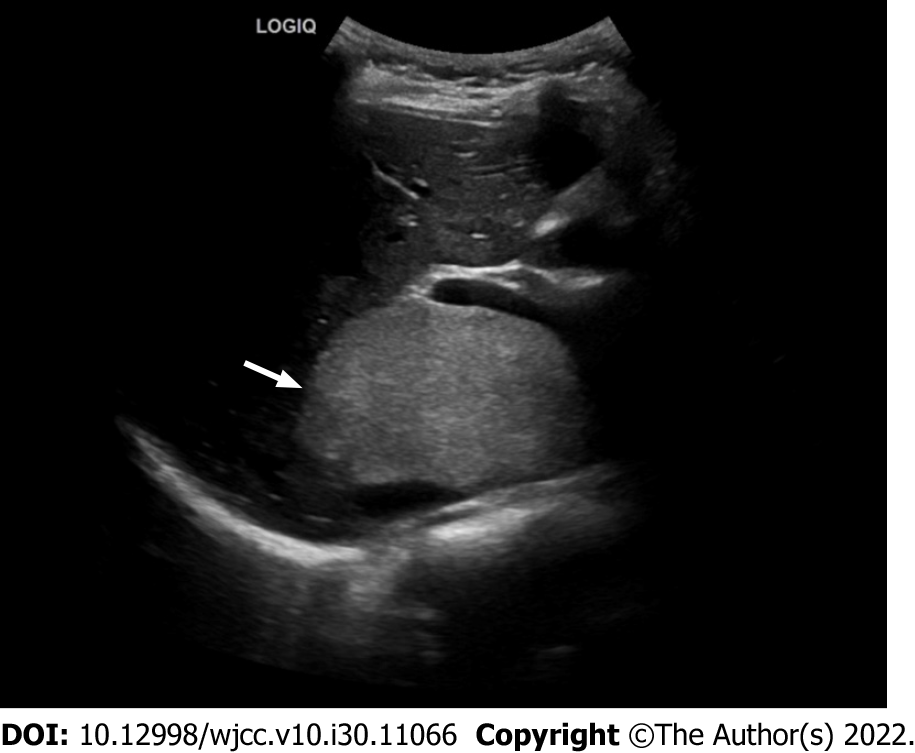
Figure 1 Ultrasonic image of hepatic steatosis with mass effect.
Ultrasound showed a large hyperechoic mass in the parenchyma of the caudate lobe of the liver (arrow), with clear boundary, irregular shape and inhomogeneous internal echo.
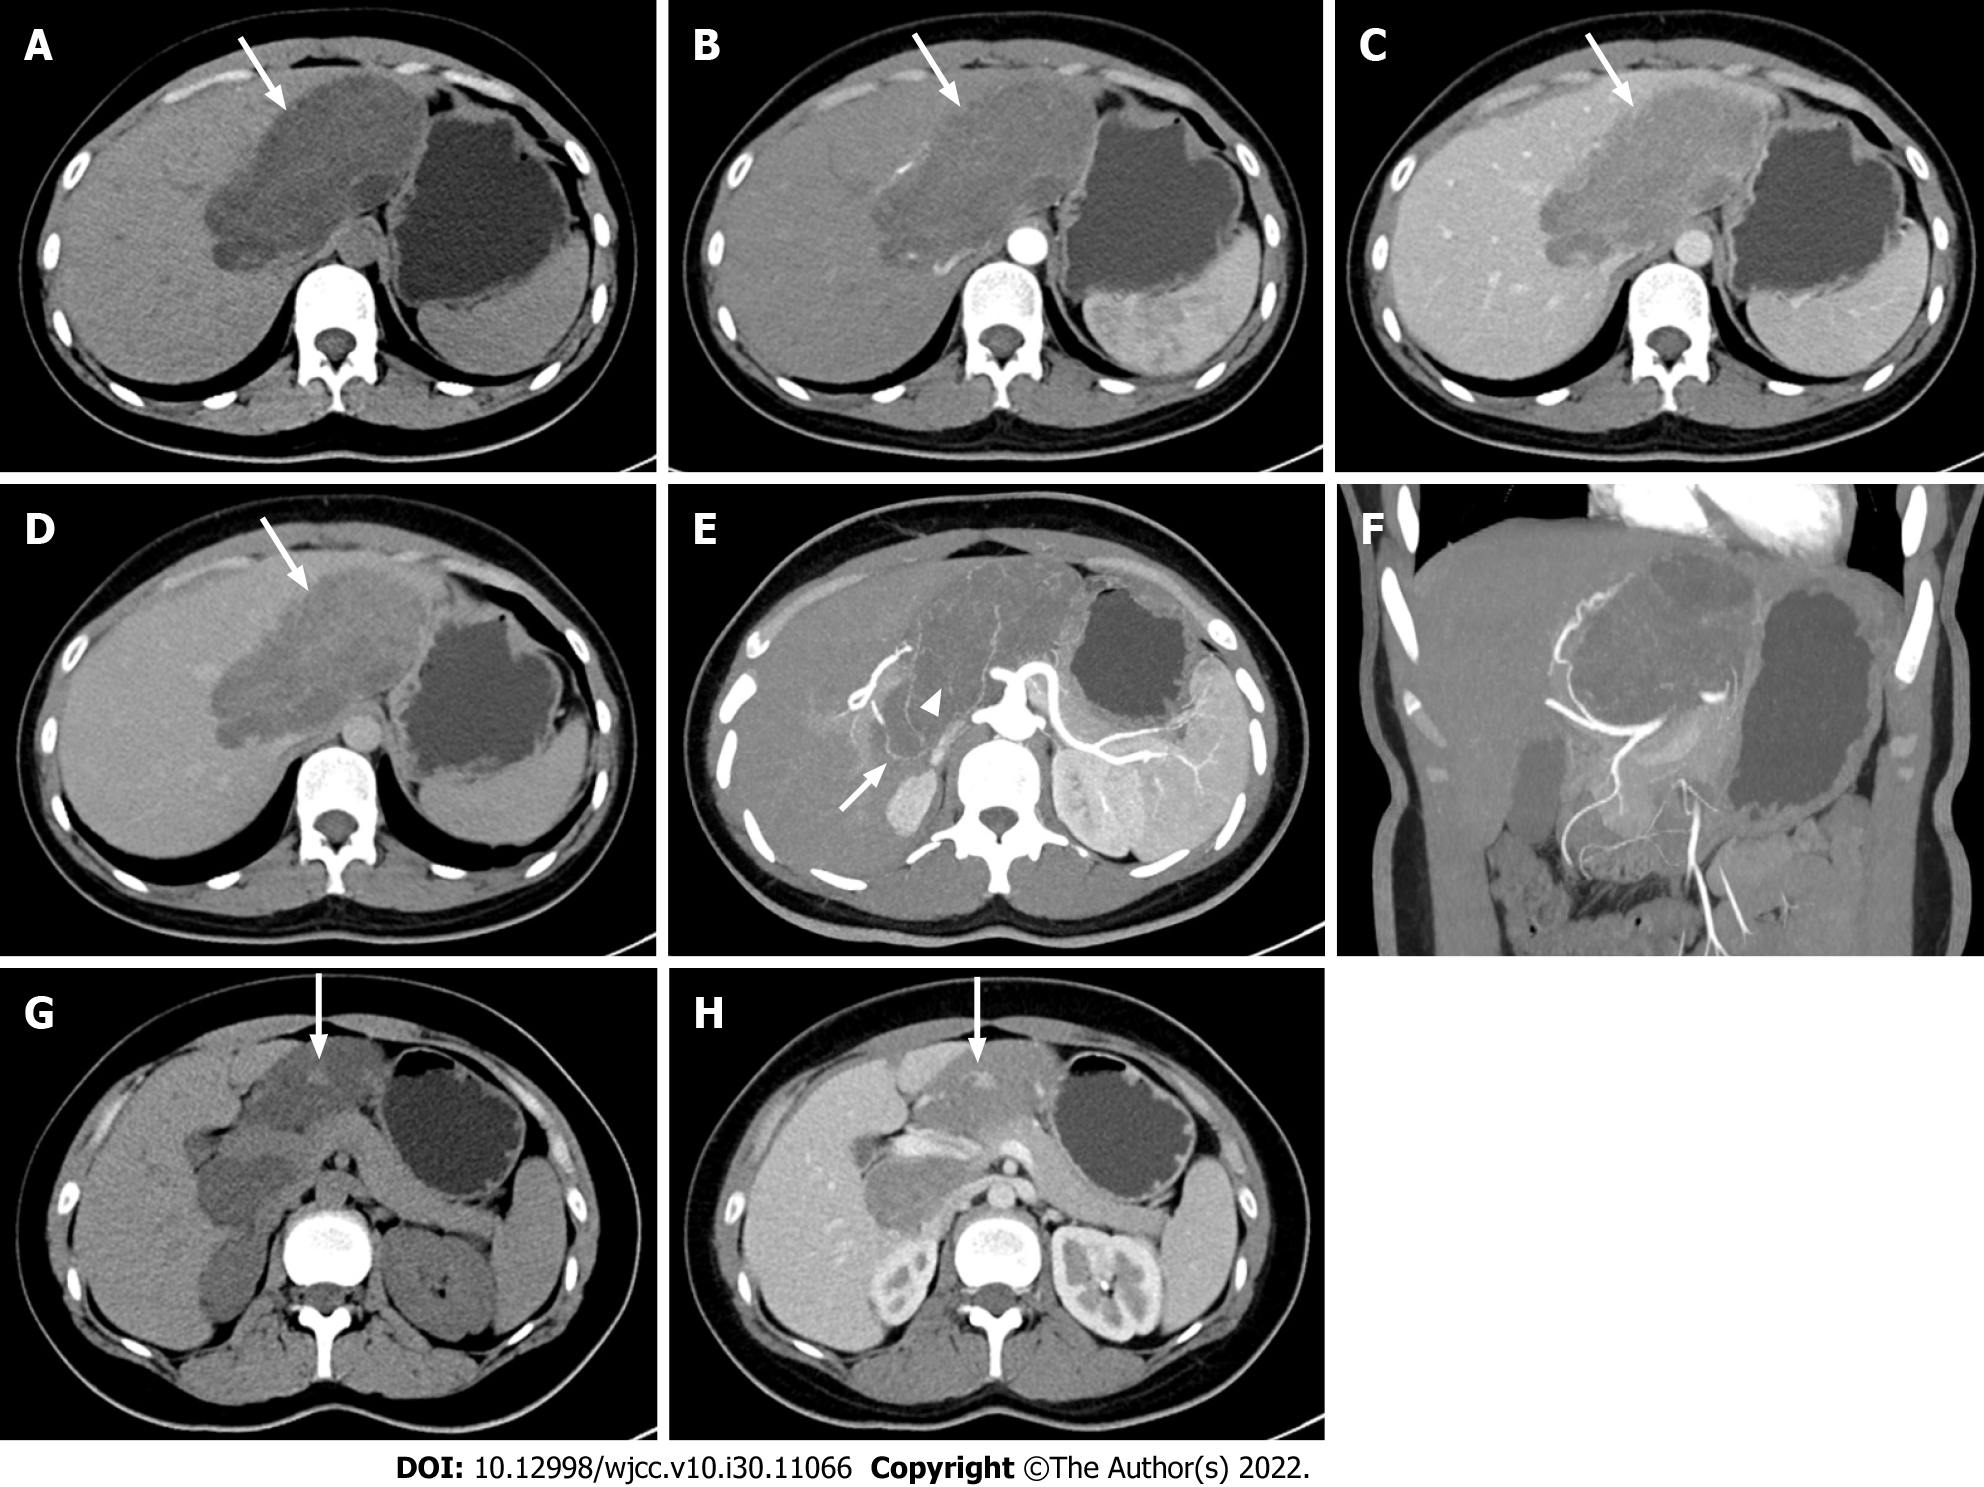
Figure 2 Computed tomography images of hepatic steatosis with mass effect.
A: The unenhanced computed tomography (CT) showed irregular and inhomogeneous low-density lesion in the caudate lobe of the liver with clear boundary (arrow); B: Dynamic enhanced scanning showed mild enhancement of the lesion in the arterial phase (arrow); C: Dynamic enhanced scanning showed peak enhancement in the portal vein phase (arrow); D: Dynamic enhanced scanning showed lower enhancement in the delayed phase than in portal vein phase (arrow). The dynamic enhancement pattern of the lesion was similar to that of the adjacent normal liver parenchyma, and the lesion was hypovascular compared with the background liver in all three contrast-enhanced phases; E: The minimum intensity projection (MinIP) in the arterial phase of contrast-enhanced scanning showed that the blood supply of the lesion was from the branch of the hepatic artery (arrow). There were branches of the hepatic artery inside the mass (arrowhead); F: The mass effect of the lesion was significant. The hepatic artery and branches were compressed and displaced; G: A focal nodule (arrow) in the lesion was observed on unenhanced CT; H: The focal nodule (arrow) in the lesion was also observed on contrast-enhanced CT. The attenuation of unenhanced CT and enhancement mode was similar to that of normal liver parenchyma.
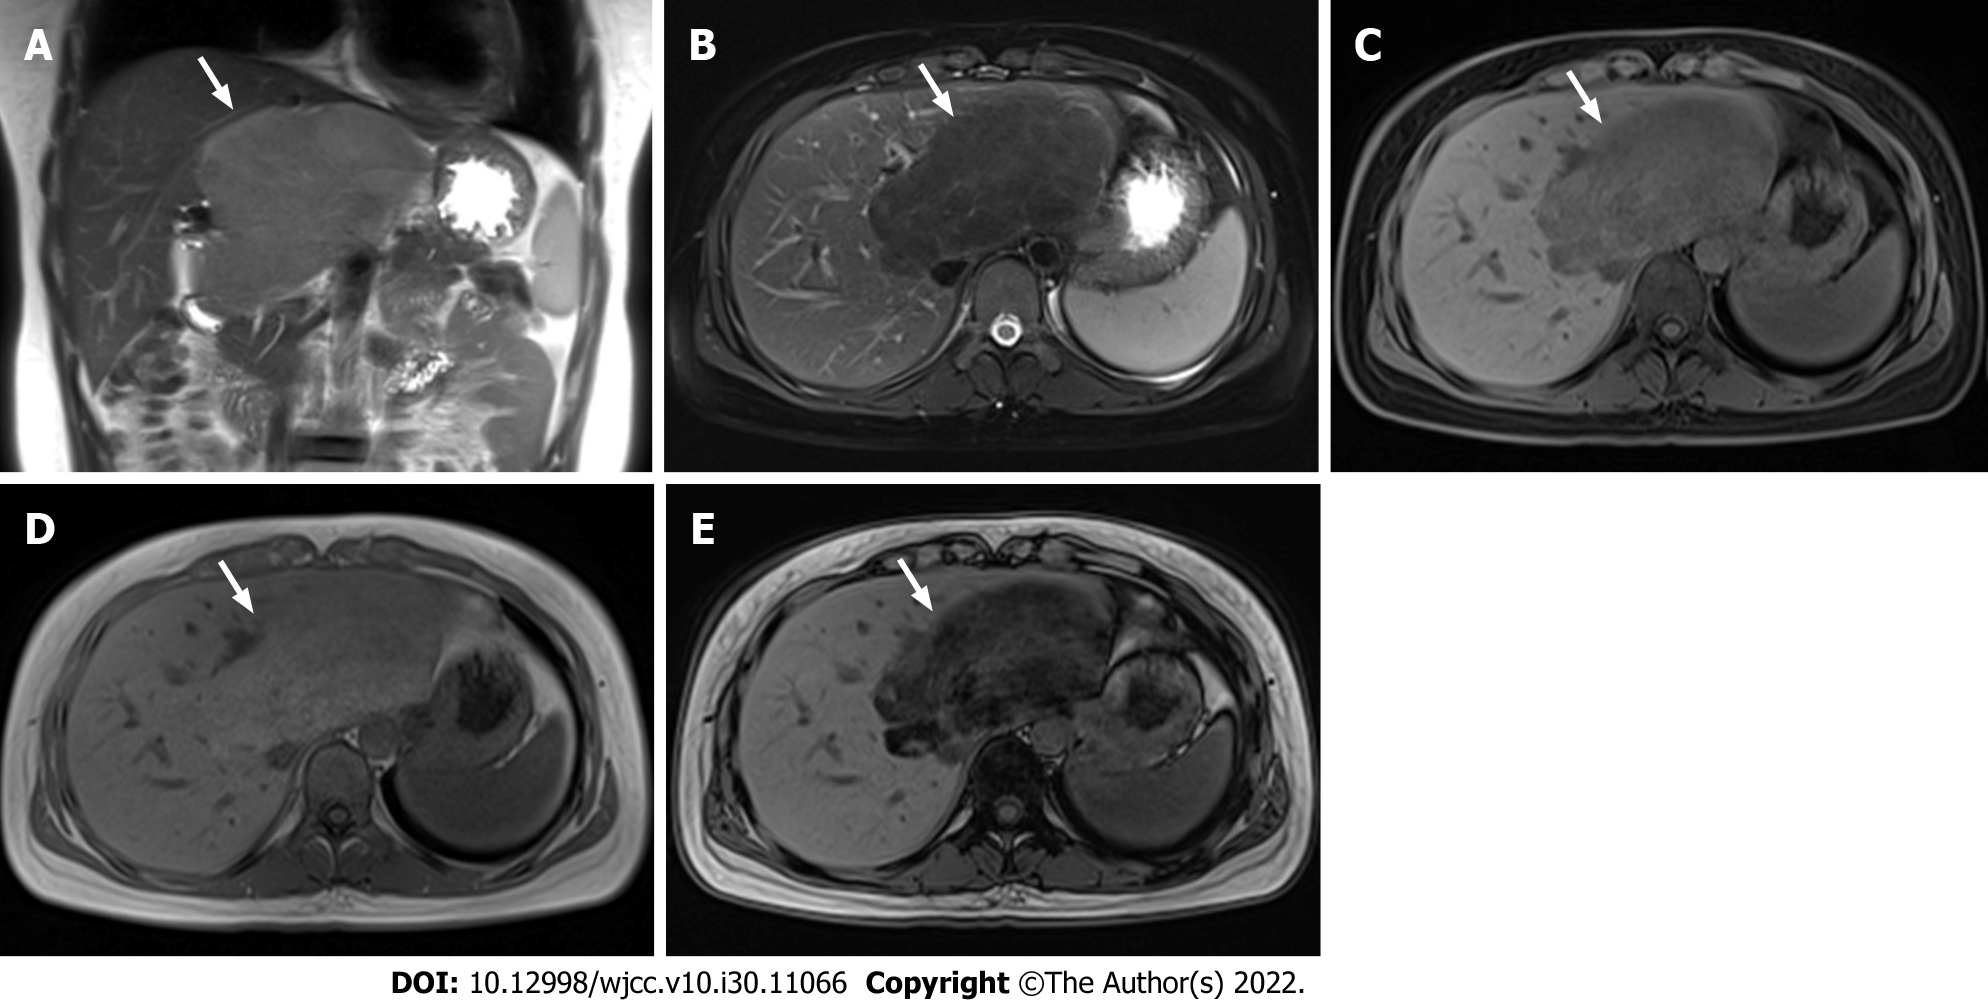
Figure 3 Magnetic resonance imaging of hepatic steatosis with mass effect.
A: Coronal T2-weighted non-fat-saturated image revealed that the lesion (arrow) in the caudate lobe of the liver showed slight hyperintensity and locally protruding beyond the liver outline; B: The signal intensity was reduced on axial T2-weighted fat-saturated images; C: The signal intensity was also decreased on axial T1-weighted fat-saturated images; D: Axial T1-weighted in-phase image showed slight hyperintensity; E: The signal intensity of out-of-phase image decreased significantly. The degree of reduction of the T1-weighted out-of-phase image was higher than that of T1-weighted fat-saturated image.
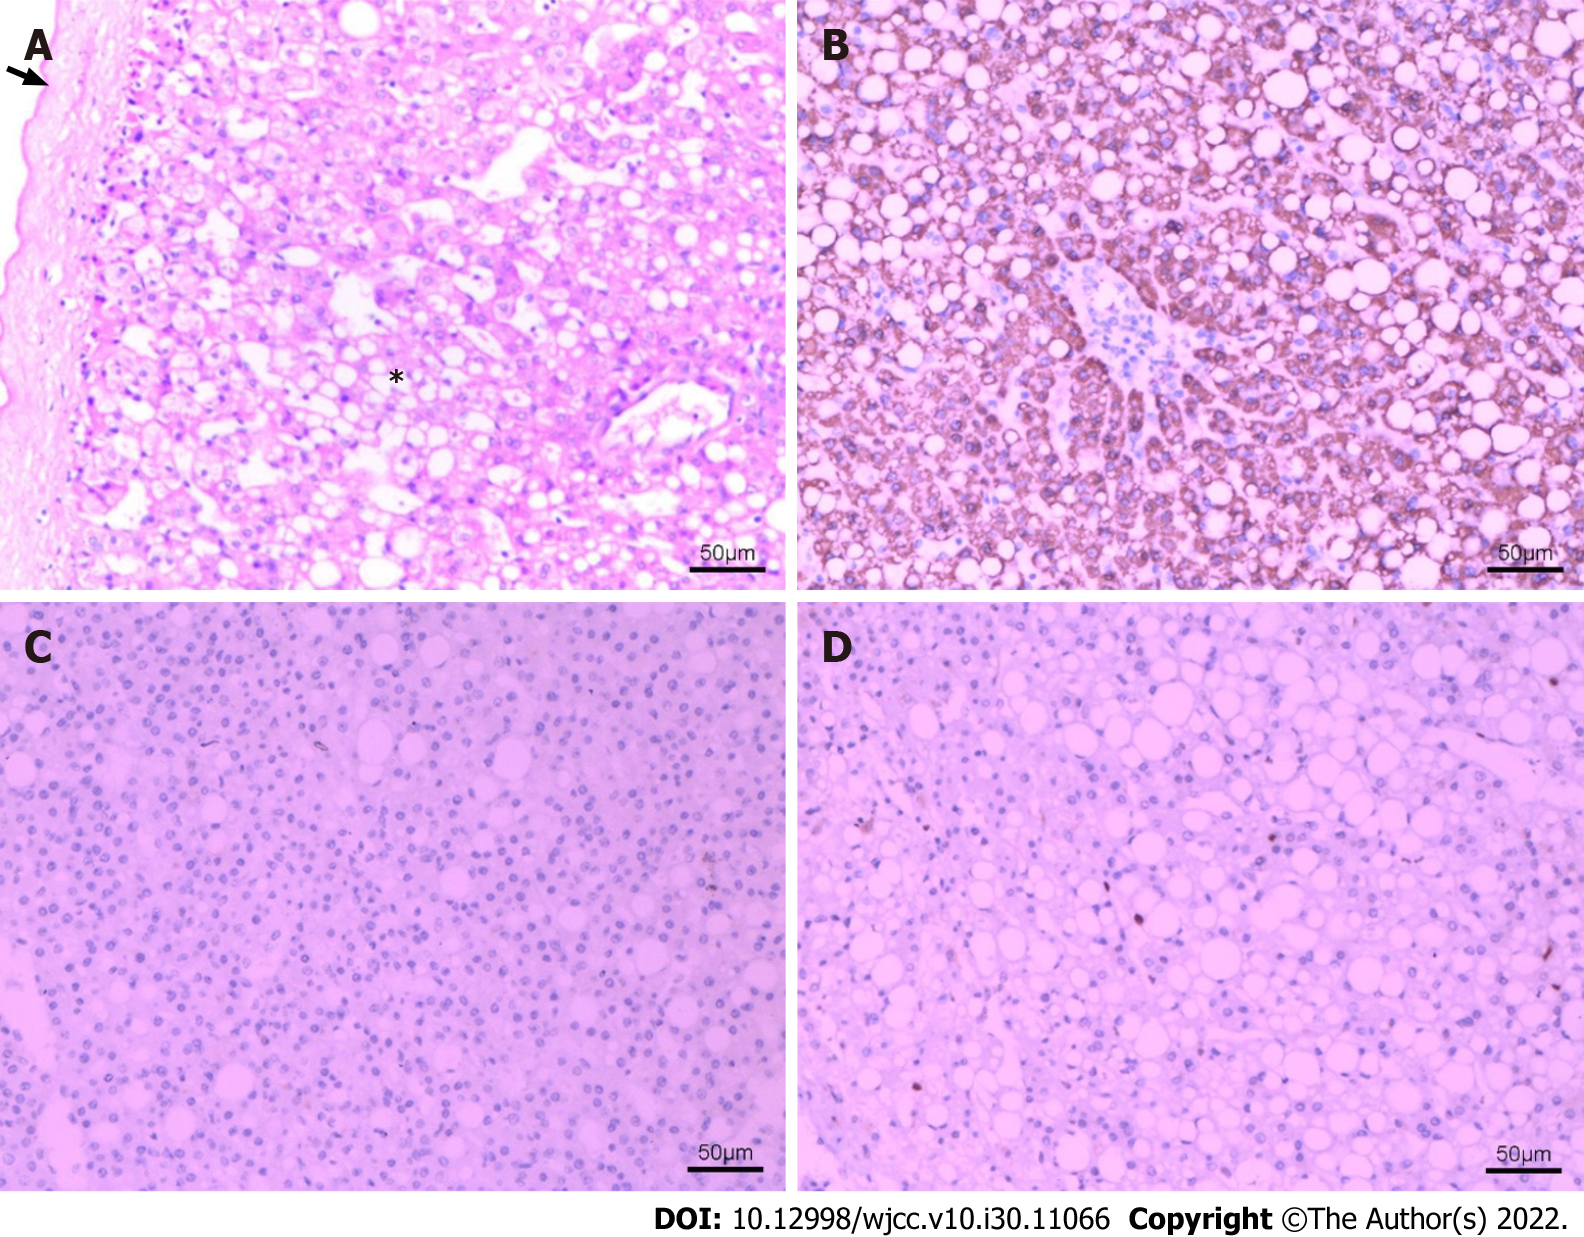
Figure 4 Pathological changes of hepatic steatosis with mass effect.
The HE (hematoxylin and eosin) and immunohistochemical staining of resected specimen at × 100 magnification. A: HE staining of the specimen showed that some normal structures of liver tissue disappeared. No obvious lobular structure was found. There were extensive steatosis of hepatocytes (*), and fibrous cell layer around the lesions (arrow). B: Immunohistochemical staining: Hep Par 1 (hepatocyte paraffin 1) (+); C: Immunohistochemical staining: GPC-3 (glypican-3) (-); D: Immunohistochemical staining: Ki-67 index (2%).
- Citation: Hu N, Su SJ, Li JY, Zhao H, Liu SF, Wang LS, Gong RZ, Li CT. Hepatic steatosis with mass effect: A case report. World J Clin Cases 2022; 10(30): 11066-11073
- URL: https://www.wjgnet.com/2307-8960/full/v10/i30/11066.htm
- DOI: https://dx.doi.org/10.12998/wjcc.v10.i30.11066


