Copyright
©The Author(s) 2022.
World J Clin Cases. Oct 16, 2022; 10(29): 10681-10688
Published online Oct 16, 2022. doi: 10.12998/wjcc.v10.i29.10681
Published online Oct 16, 2022. doi: 10.12998/wjcc.v10.i29.10681
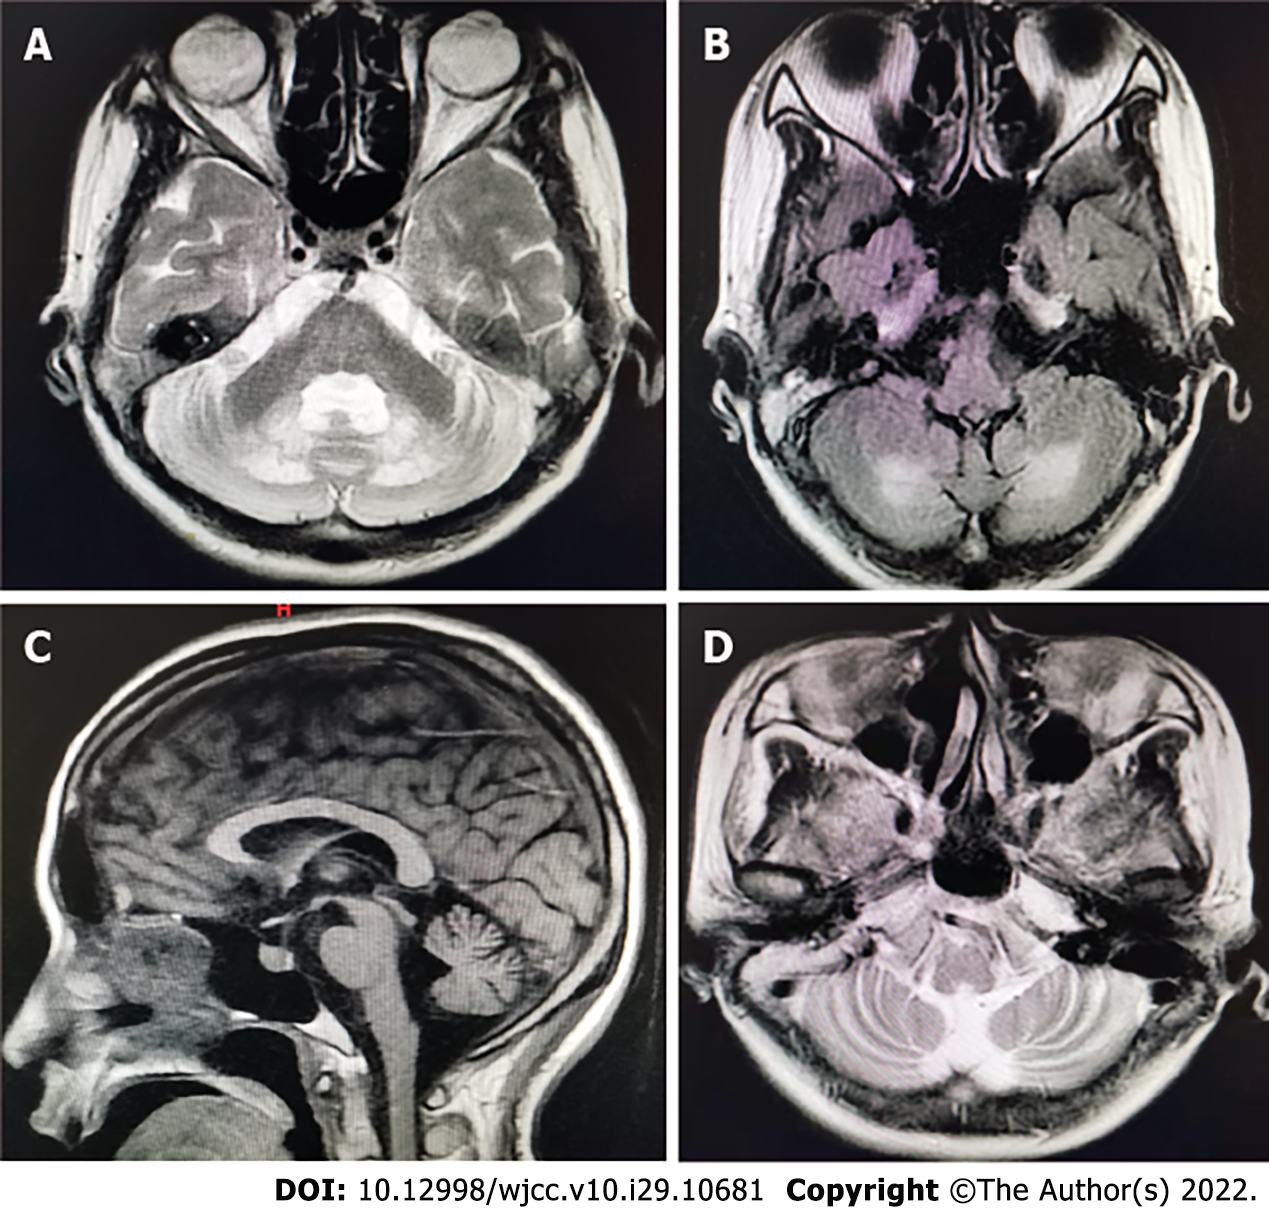
Figure 1 Magnetic resonance imaging results showed prominent bilateral cerebellar lesions of dentate nuclei.
A: T2-weighted images; B: FLAIR images; Sagittal T1-weight images and axial T2-weight image sequence showed atrophy of bilateral cerebellar; C: Sagittal T1-weighted images; D: Axial T2-weighted image.
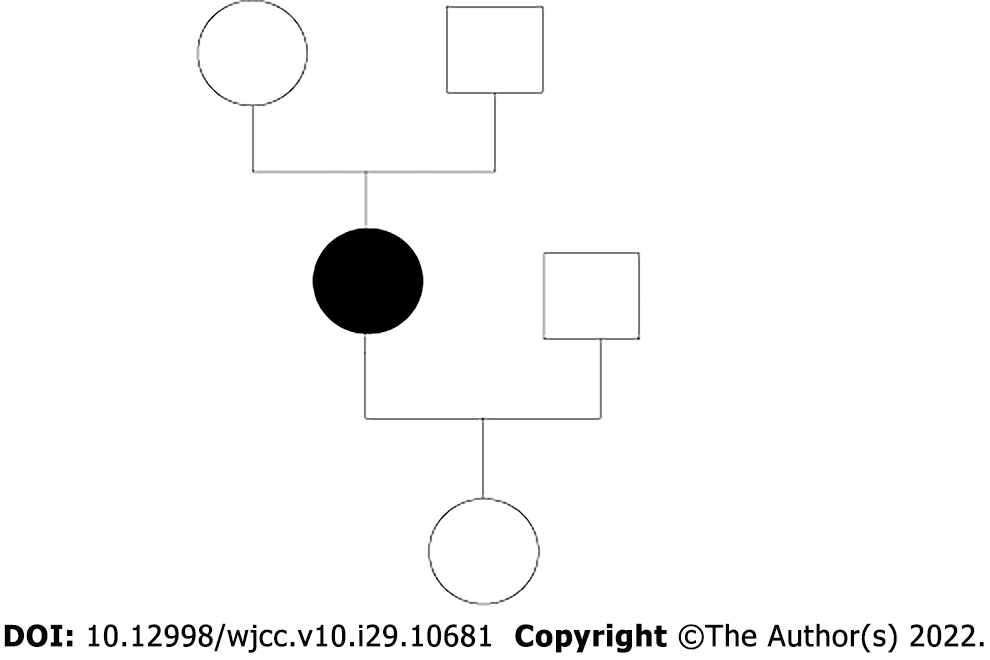
Figure 2 Cerebrotendinous xanthomatosis index family pedigree.
Black symbols denote family members affected with cerebrotendinous xanthomatosis.
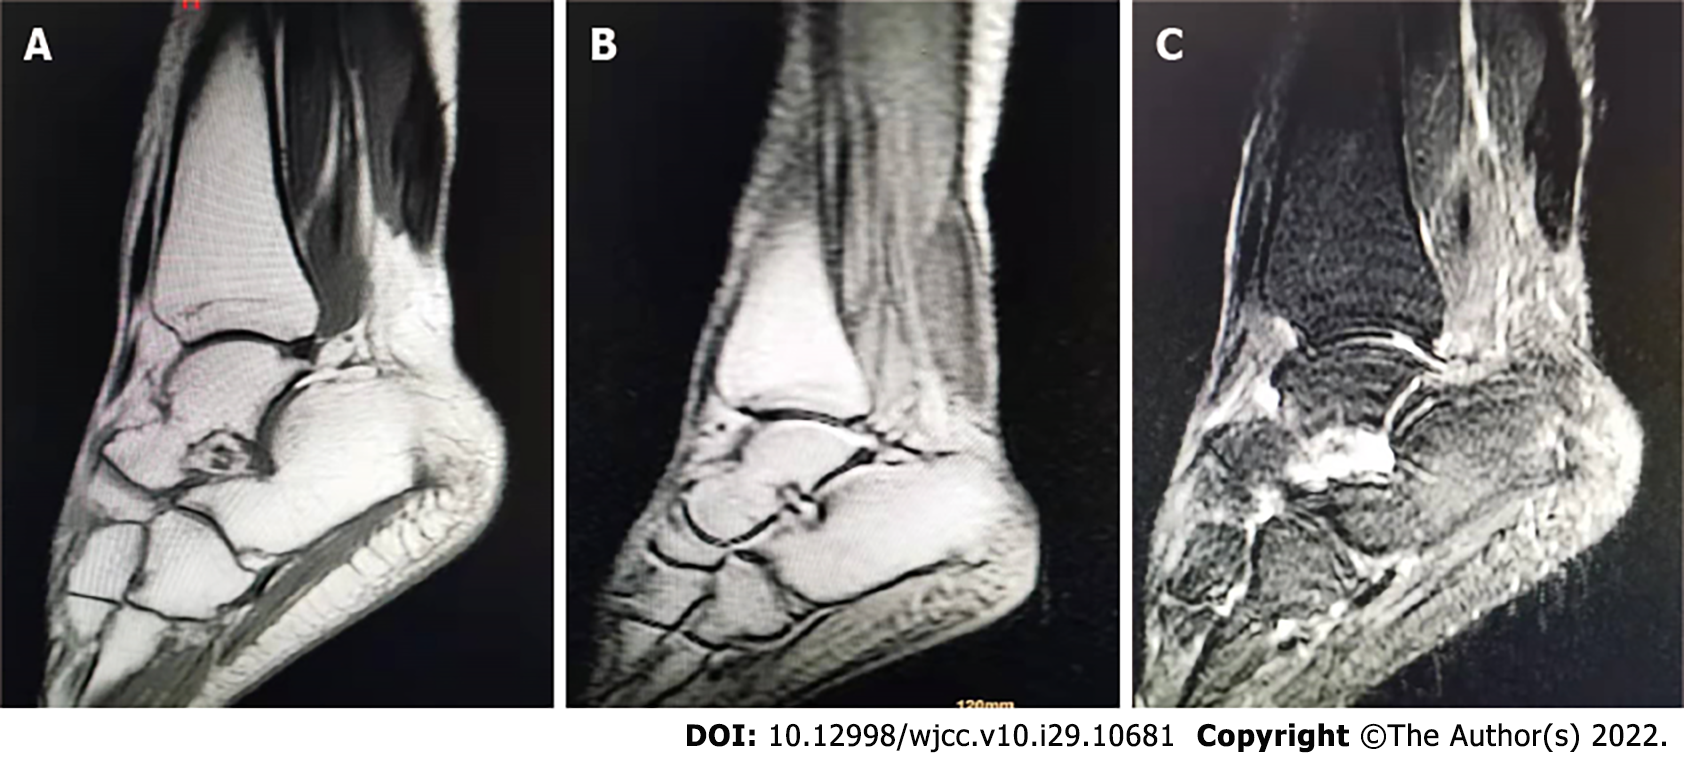
Figure 3 Magnetic resonance imaging results showed xanthoma of the right Achilles tendon.
A: Sagittal proton density; B: T1-weighted image; C: T1-fat-saturated-weighted image following contrast agent injection.
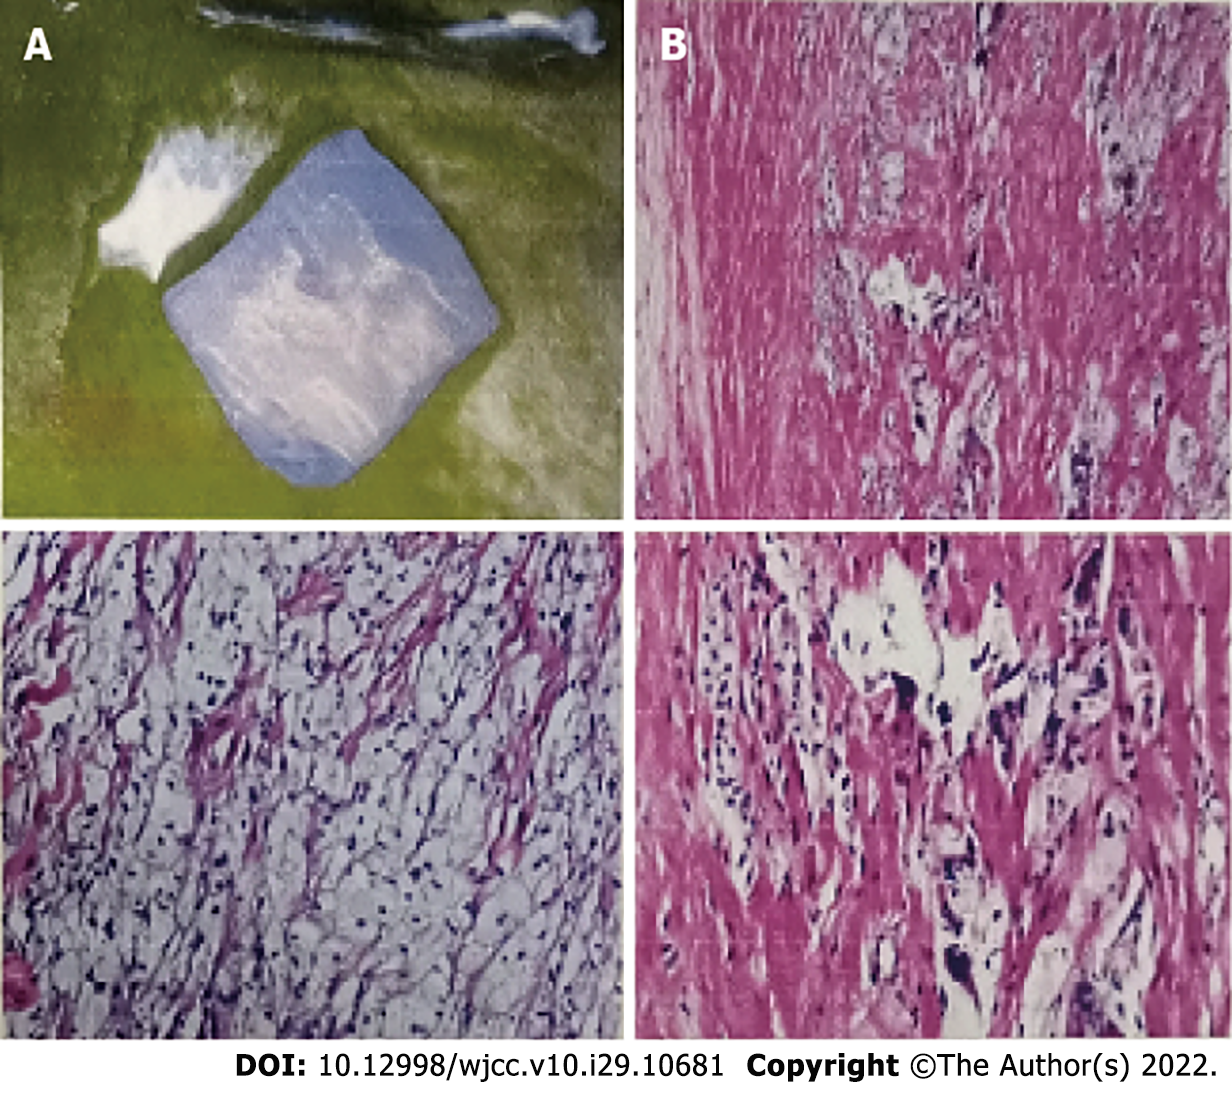
Figure 4 A biopsy of this mass showed mostly foam cells and a few multinucleated giant cells in the fibrous tissue.
A: Gross-excisional biopsy specimen from right tendon xanthomas measured 56 mm × 16 mm × 21 mm; B: Histopathology of the tendon mass. Soft tissue microscopic analysis results showed foam cells and a few multinucleated giant cells in the fibrous tissue.
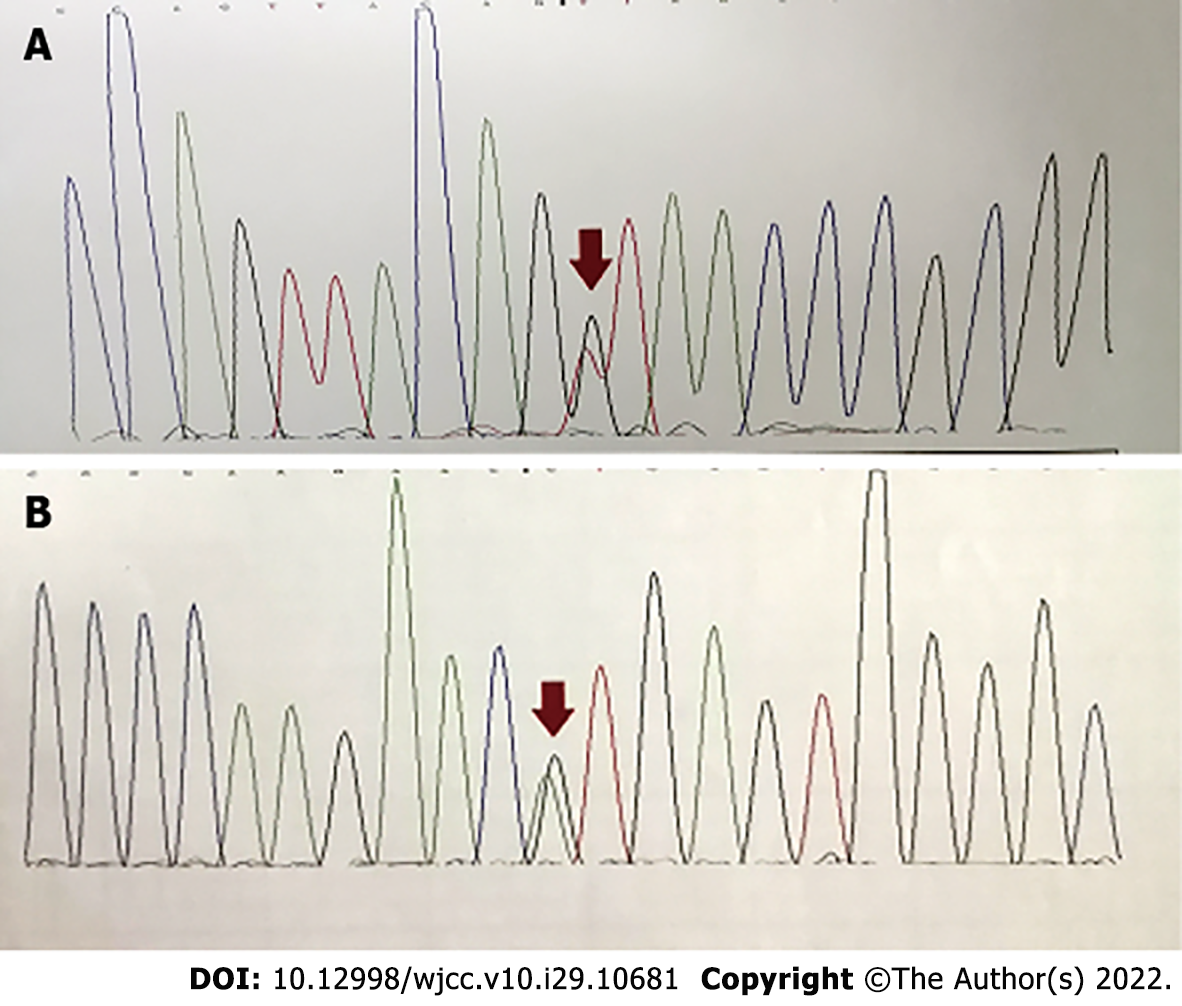
Figure 5 Two pathological variants of CYP27A1 identified in the patient with cerebrotendinous xanthomatosis.
A: c.255+1G>T; B: c.1263+1G>T.
- Citation: Chang YY, Yu CQ, Zhu L. Progressive ataxia of cerebrotendinous xanthomatosis with a rare c.255+1G>T splice site mutation: A case report . World J Clin Cases 2022; 10(29): 10681-10688
- URL: https://www.wjgnet.com/2307-8960/full/v10/i29/10681.htm
- DOI: https://dx.doi.org/10.12998/wjcc.v10.i29.10681


