Copyright
©The Author(s) 2022.
World J Clin Cases. Oct 16, 2022; 10(29): 10614-10621
Published online Oct 16, 2022. doi: 10.12998/wjcc.v10.i29.10614
Published online Oct 16, 2022. doi: 10.12998/wjcc.v10.i29.10614
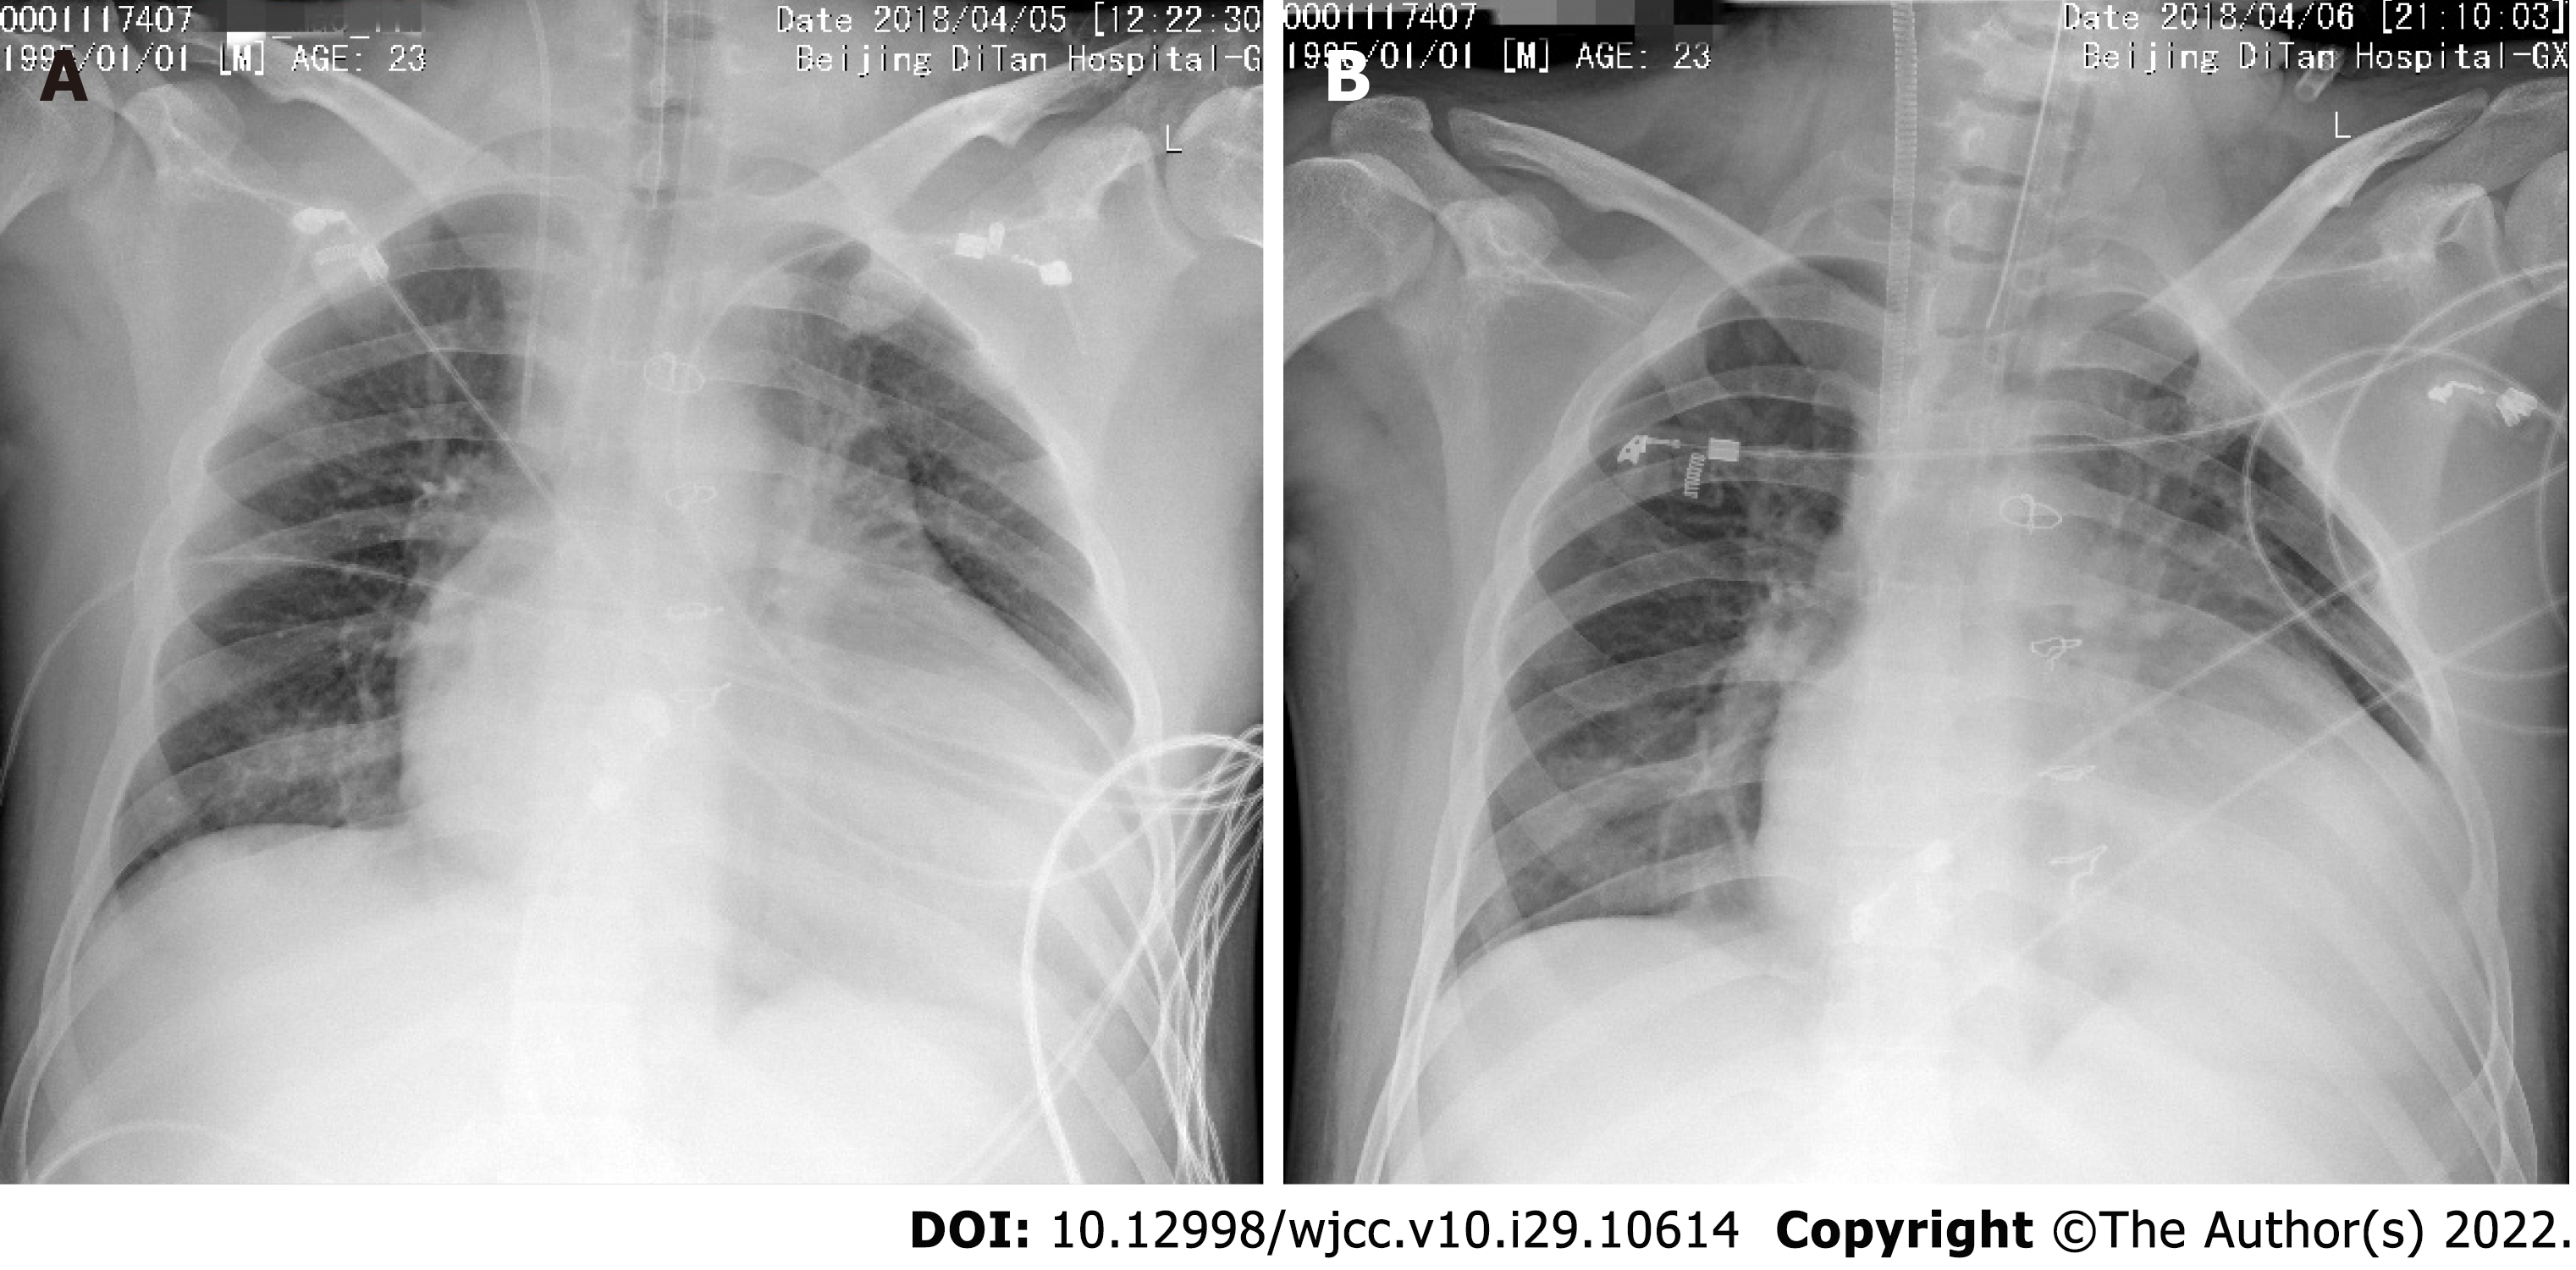
Figure 1 Chest X-rays of the patient at admission and the first day of receiving veno-venous extracorporeal membrane oxygenation therapy.
A: Chest X-ray of the patient at admission to the intensive care unit; B: Chest X-ray of the patient at the first day of receiving veno-venous extracorporeal membrane oxygenation therapy.
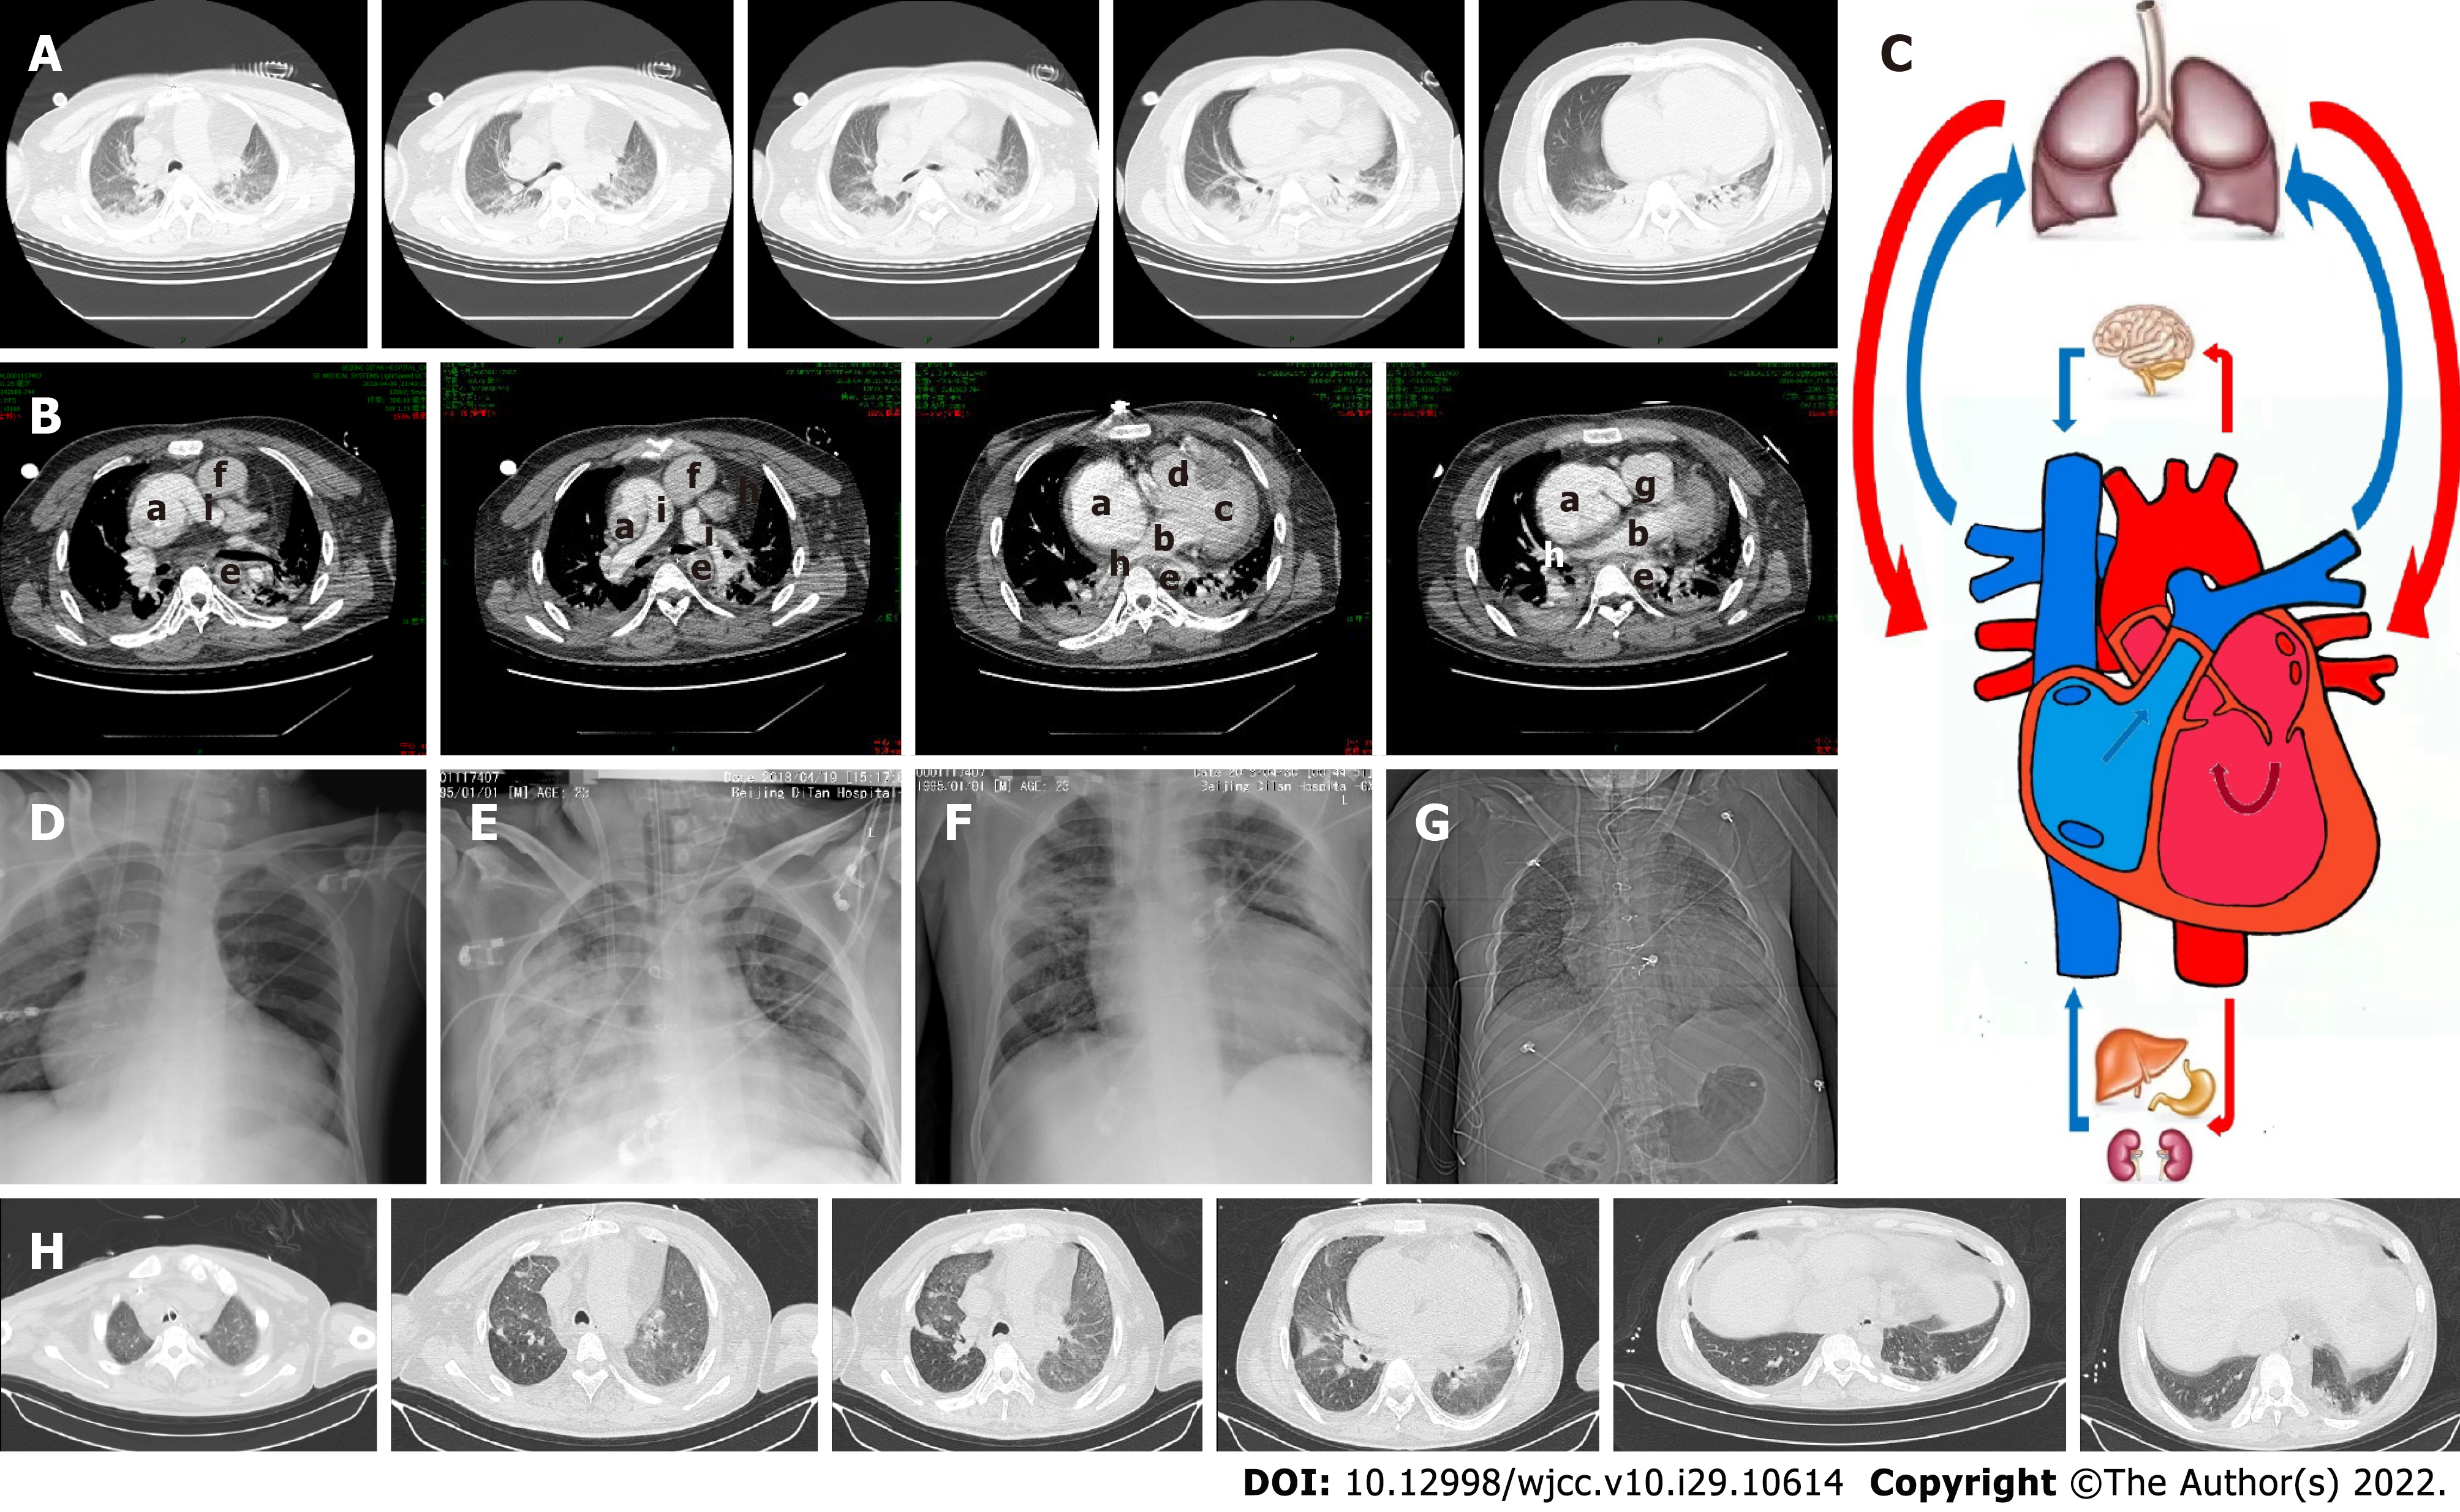
Figure 2 Follow-up images at two months after veno-venous extracorporeal membrane oxygenation therapy.
A: Computed tomography (CT) images of the lung on April 9, 2018; B: Chest enhanced CT images on April 9, 2018; a: The right atrium; b: The left atrium; c: The left ventricle; d: The right ventricle; e: The thoracic aorta; f: The ascending aorta; g: The aortic arch; h: The pulmonary vein; i: The pulmonary artery; C: Diagram of Fontan circulation; D: Chest X-ray of the patient at the second day of receiving veno-venous extracorporeal membrane oxygenation (VVA ECMO) therapy; E: Chest X-ray of the patient at the ninth day of receiving VV-A ECMO therapy; F: Chest X-ray before the patient finished VV-A ECMO therapy; G: Chest X-ray on May 24, 2018; and H: Lung CT images on May 24, 2018.
- Citation: Guo HB, Tan JB, Cui YC, Xiong HF, Li CS, Liu YF, Sun Y, Pu L, Xiang P, Zhang M, Hao JJ, Yin NN, Hou XT, Liu JY. Extracorporeal membrane oxygenation in curing a young man after modified Fontan operation: A case report. World J Clin Cases 2022; 10(29): 10614-10621
- URL: https://www.wjgnet.com/2307-8960/full/v10/i29/10614.htm
- DOI: https://dx.doi.org/10.12998/wjcc.v10.i29.10614


