Copyright
©The Author(s) 2022.
World J Clin Cases. Oct 16, 2022; 10(29): 10516-10528
Published online Oct 16, 2022. doi: 10.12998/wjcc.v10.i29.10516
Published online Oct 16, 2022. doi: 10.12998/wjcc.v10.i29.10516
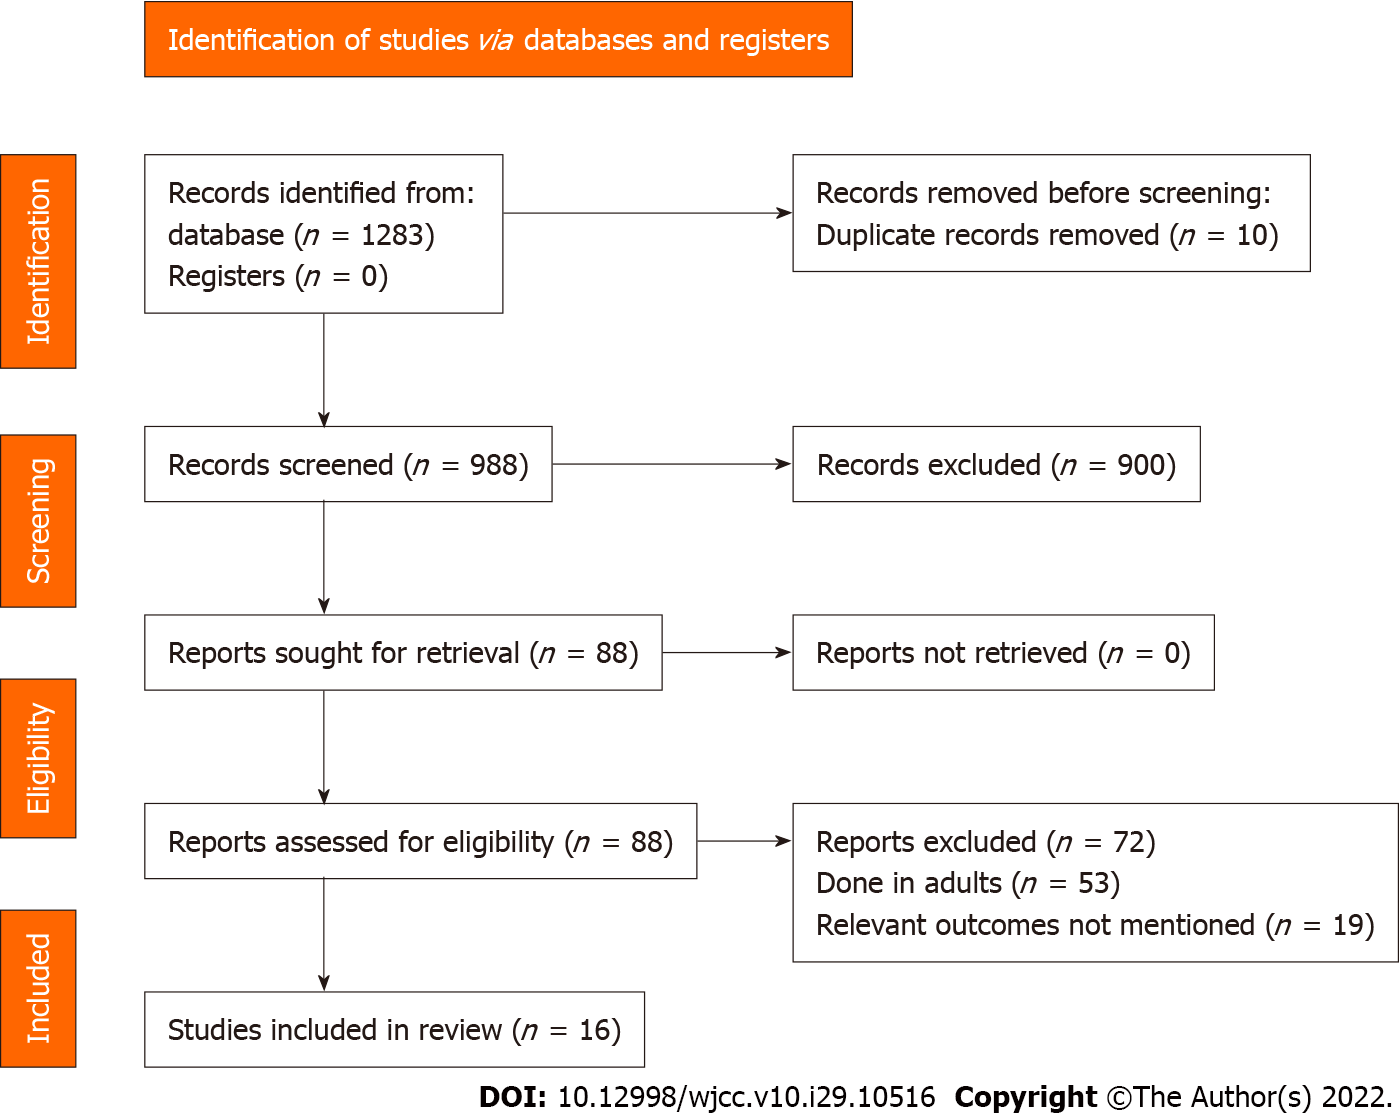
Figure 1 PRISMA flowchart.
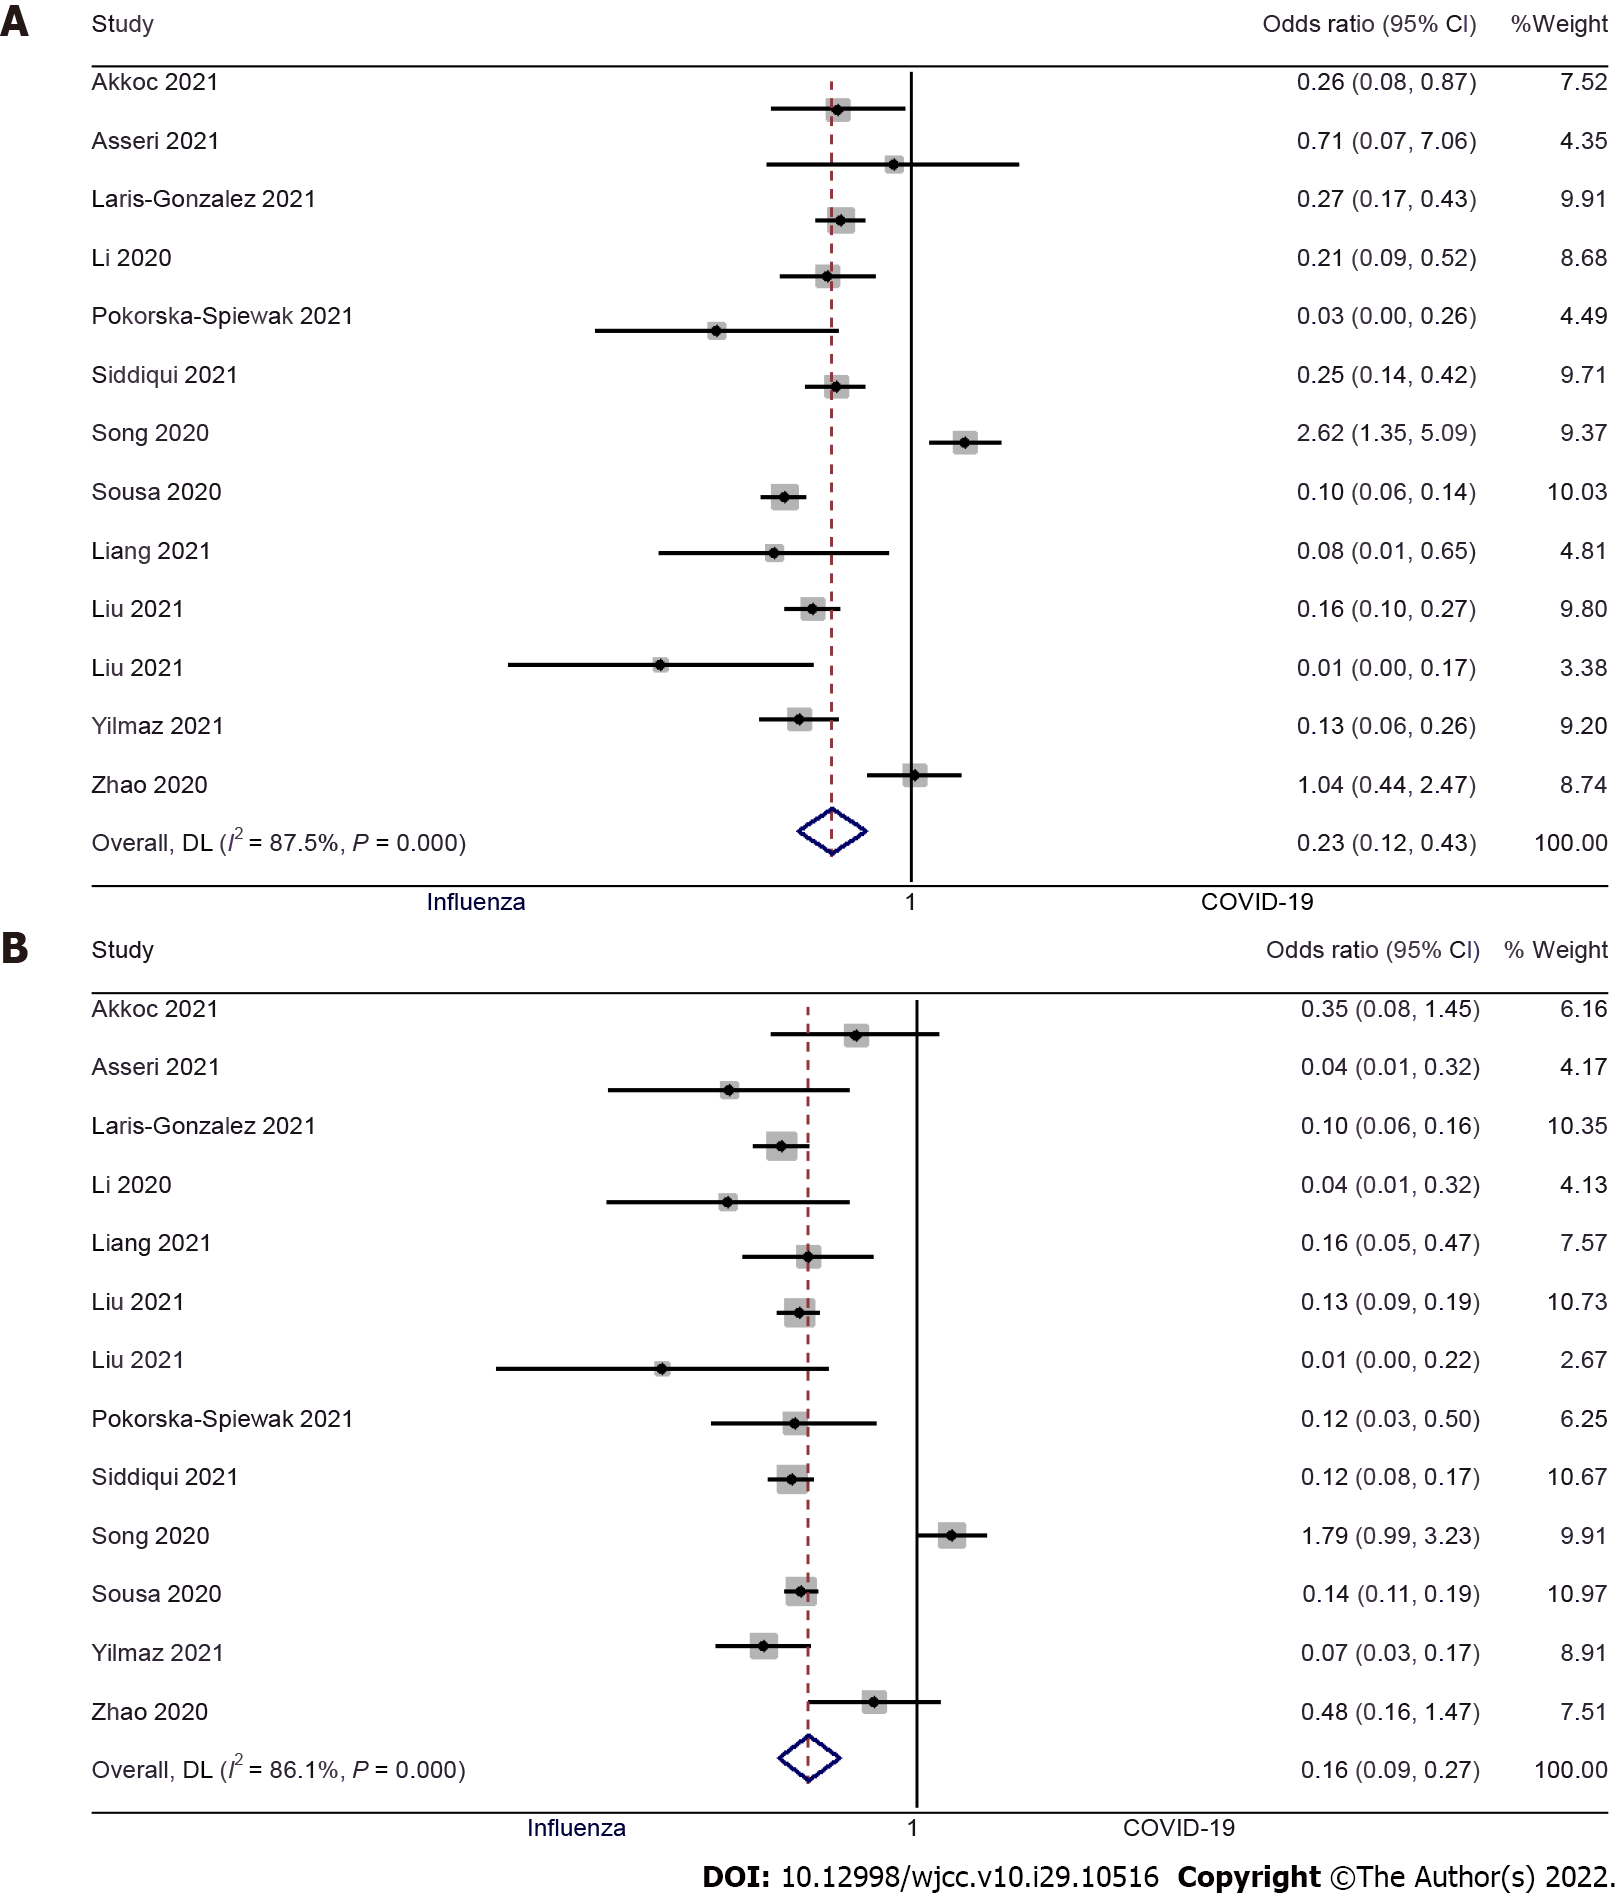
Figure 2 Forest plot showing the difference in fever and cough between pediatric coronavirus disease 2019 and influenza patients.
A: Fever; B: Cough.
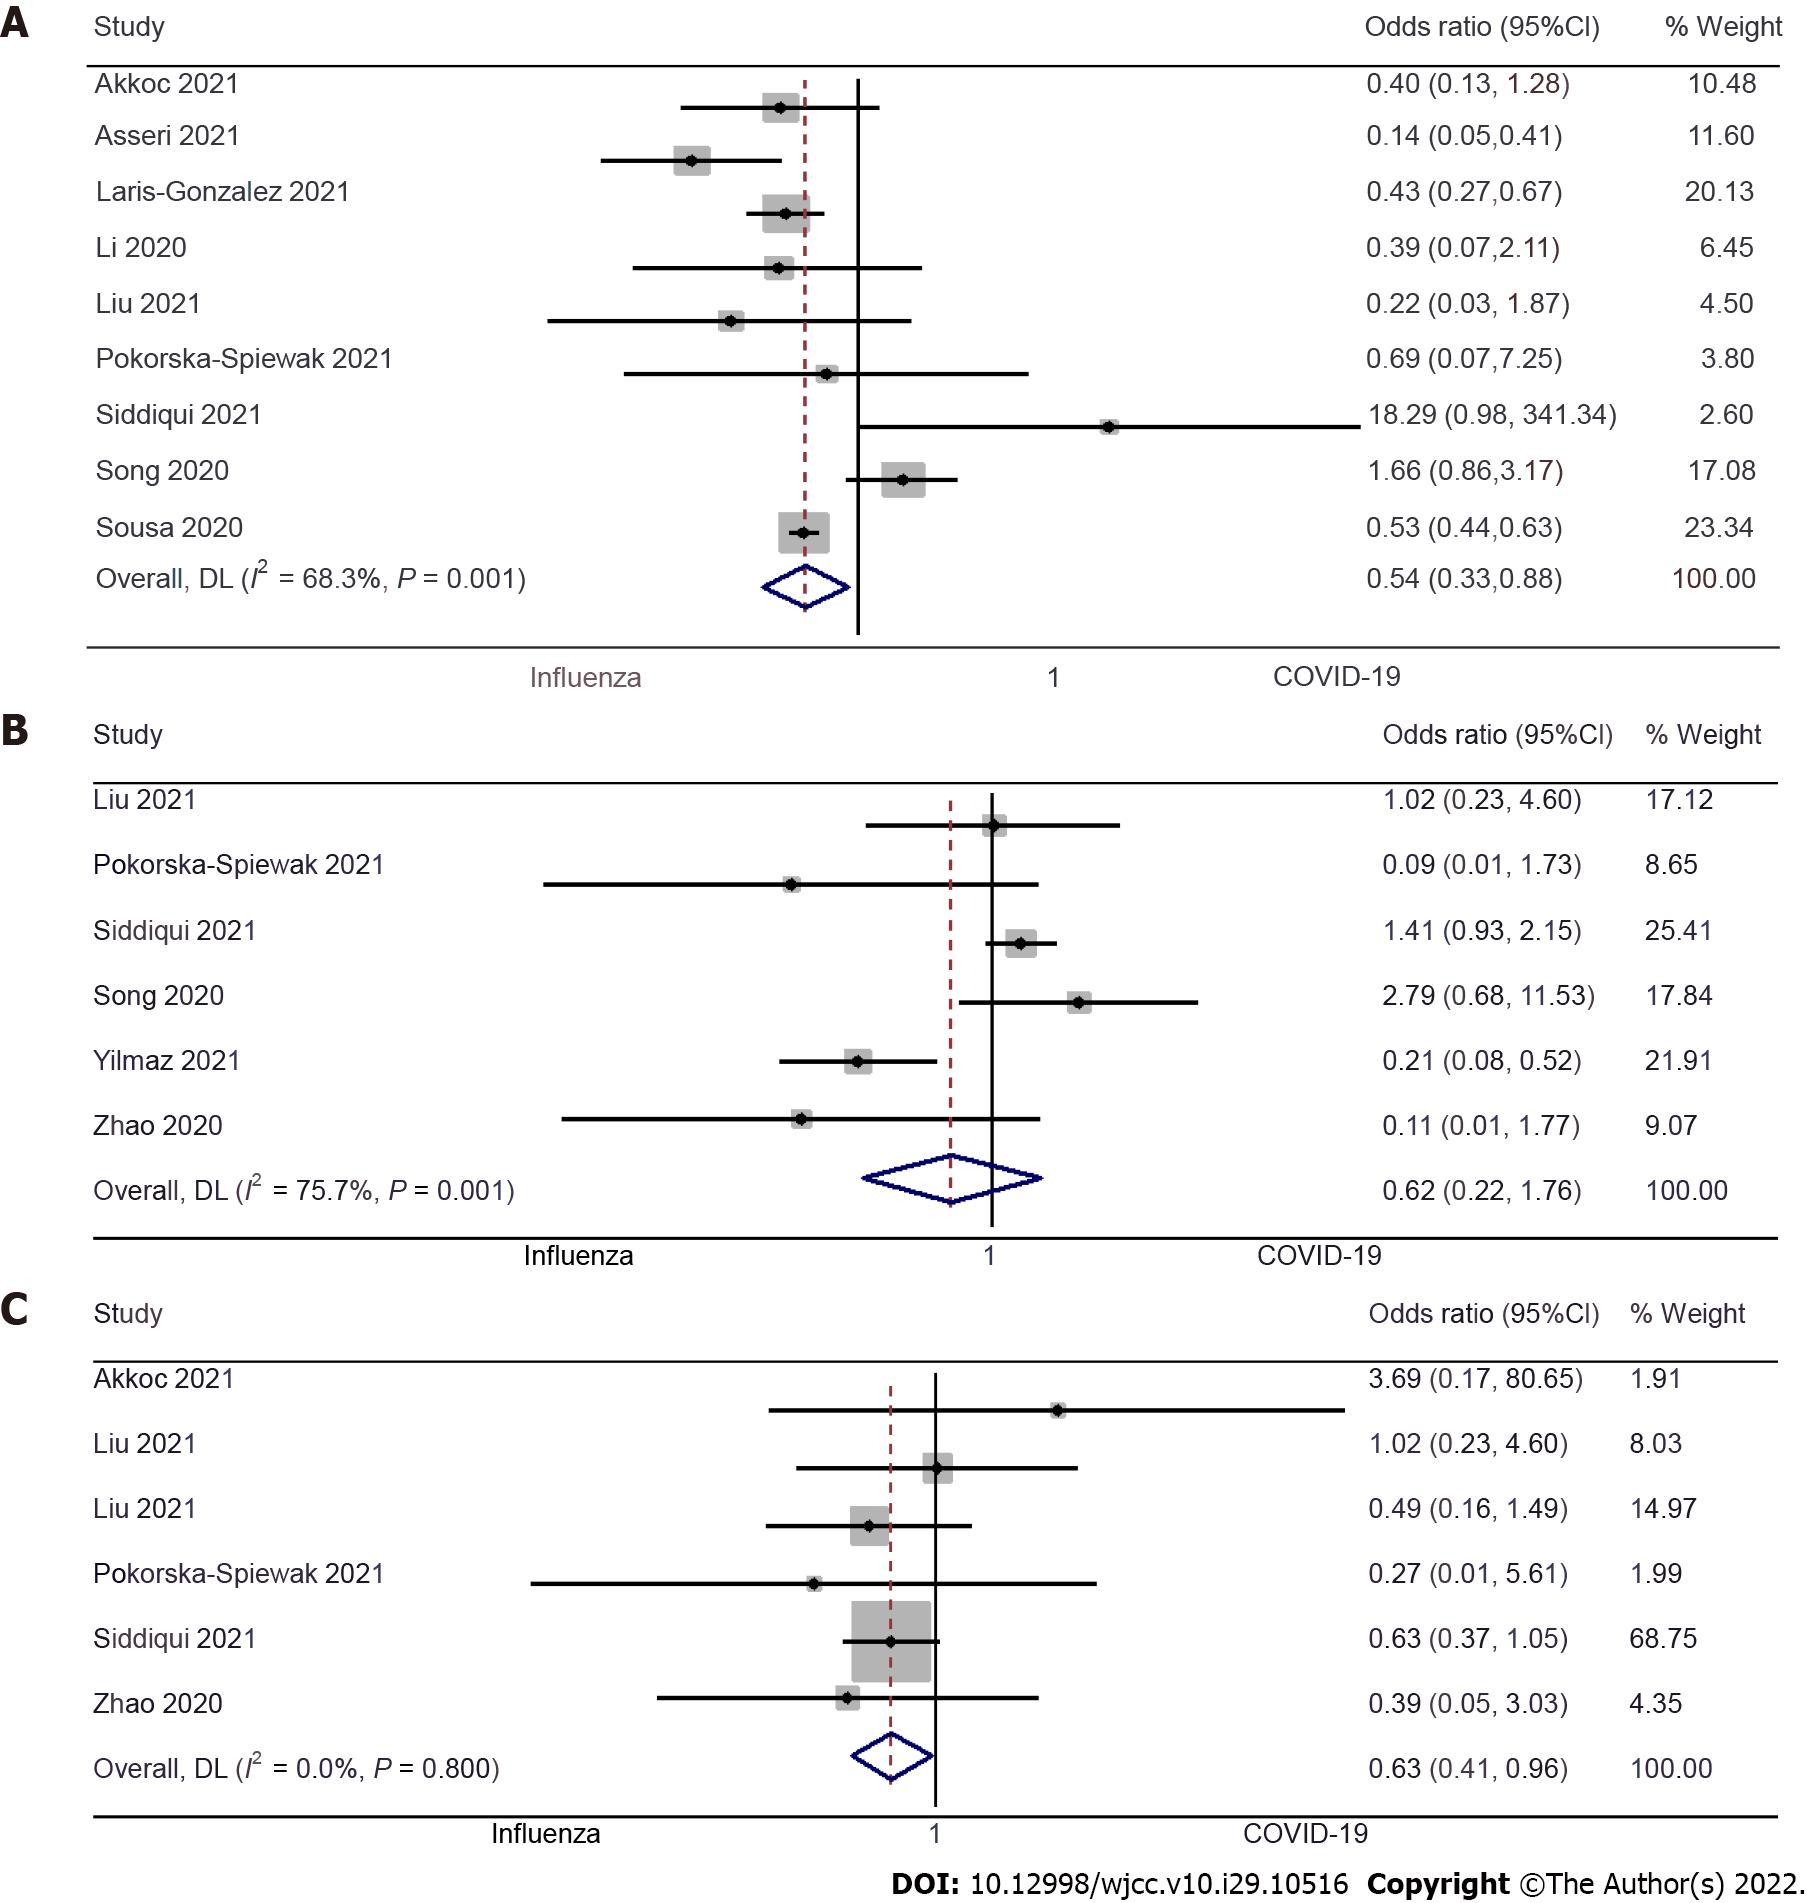
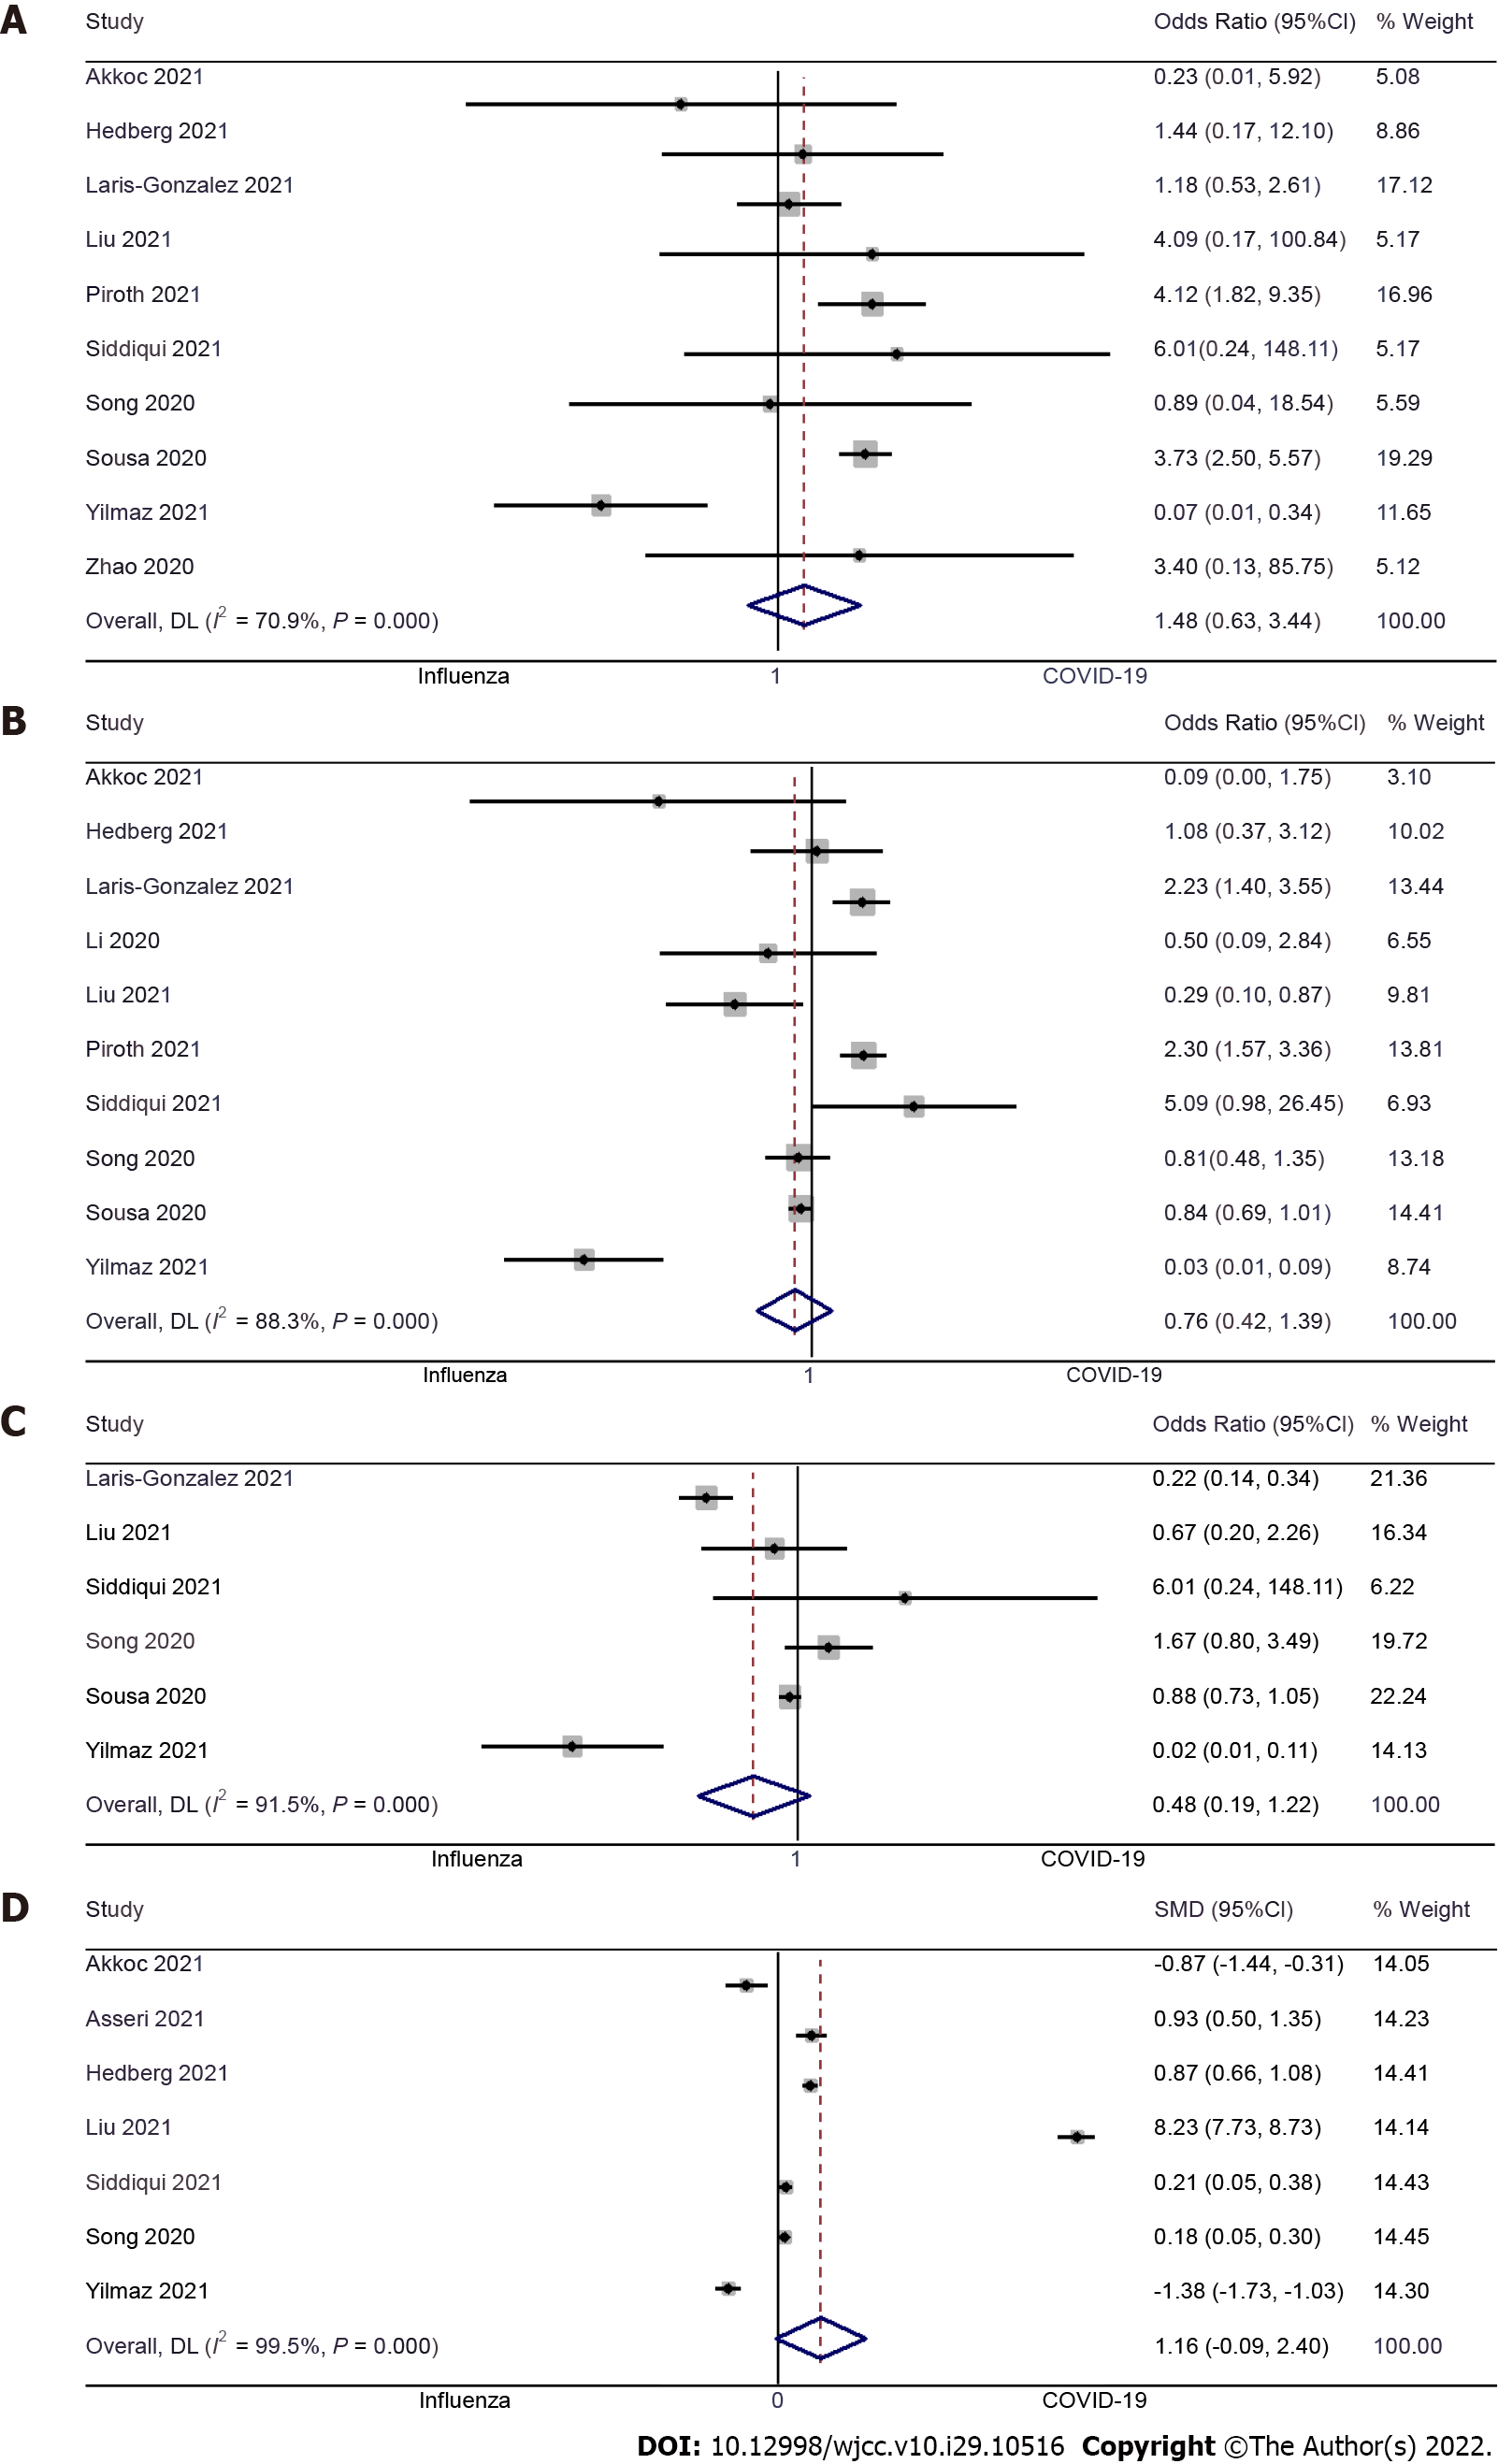
Figure 3 Forest plot showing the difference in dyspnea, sore throat and fatigue between pediatric coronavirus disease 2019 and influenza patients.
A: Dyspnea; B: Sore throat; C: Fatigue.
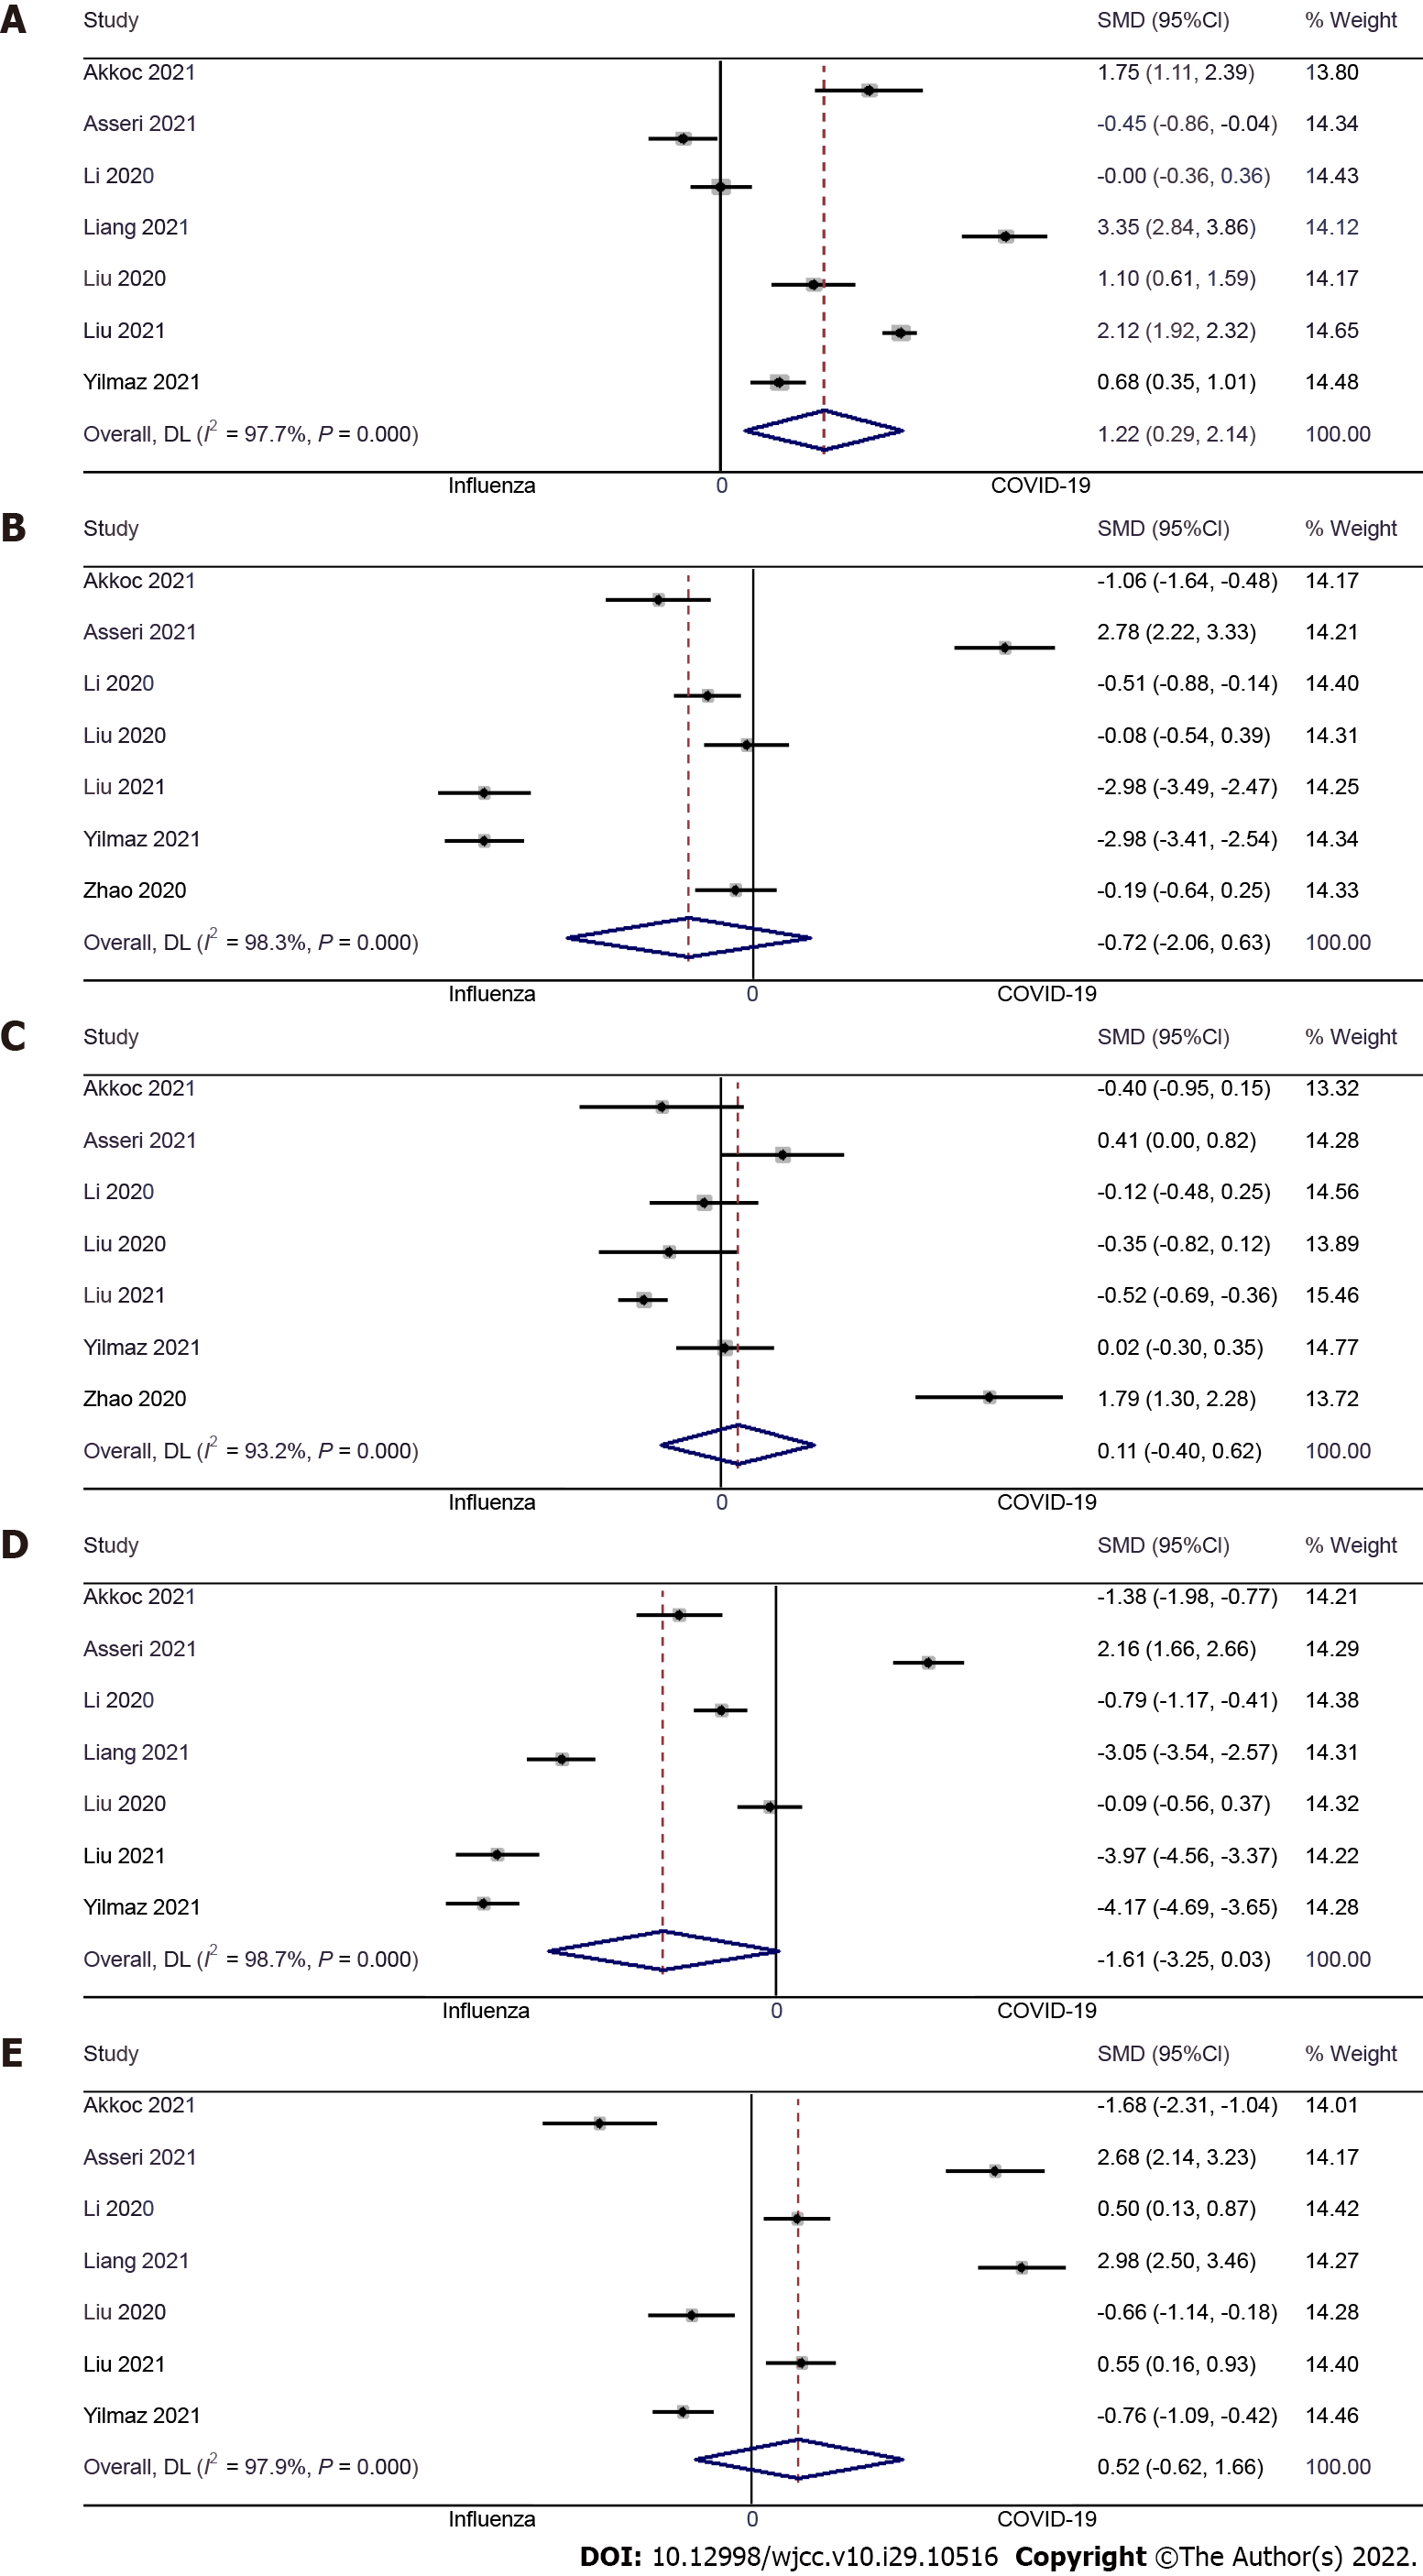
Figure 4 Forest plot showing the difference in laboratory results between pediatric coronavirus disease 2019 and influenza patients.
A: Hemoglobin level; B: White blood cell level; C: Platelets level; D: Neutrophil level; E: Lymphocyte level.
Figure 5 Forest plot showing the difference in clinical outcomes between pediatric coronavirus disease 2019 and influenza patients.
A: Length of hospital stay; B: Intensive care unit admission; C: Mechanical ventilation requirement; D: Mortality between pediatric coronavirus disease 2019 and influenza patients.
- Citation: Yu B, Chen HH, Hu XF, Mai RZ, He HY. Comparison of laboratory parameters, clinical symptoms and clinical outcomes of COVID-19 and influenza in pediatric patients: A systematic review and meta-analysis. World J Clin Cases 2022; 10(29): 10516-10528
- URL: https://www.wjgnet.com/2307-8960/full/v10/i29/10516.htm
- DOI: https://dx.doi.org/10.12998/wjcc.v10.i29.10516


