Copyright
©The Author(s) 2022.
World J Clin Cases. Oct 16, 2022; 10(29): 10435-10450
Published online Oct 16, 2022. doi: 10.12998/wjcc.v10.i29.10435
Published online Oct 16, 2022. doi: 10.12998/wjcc.v10.i29.10435
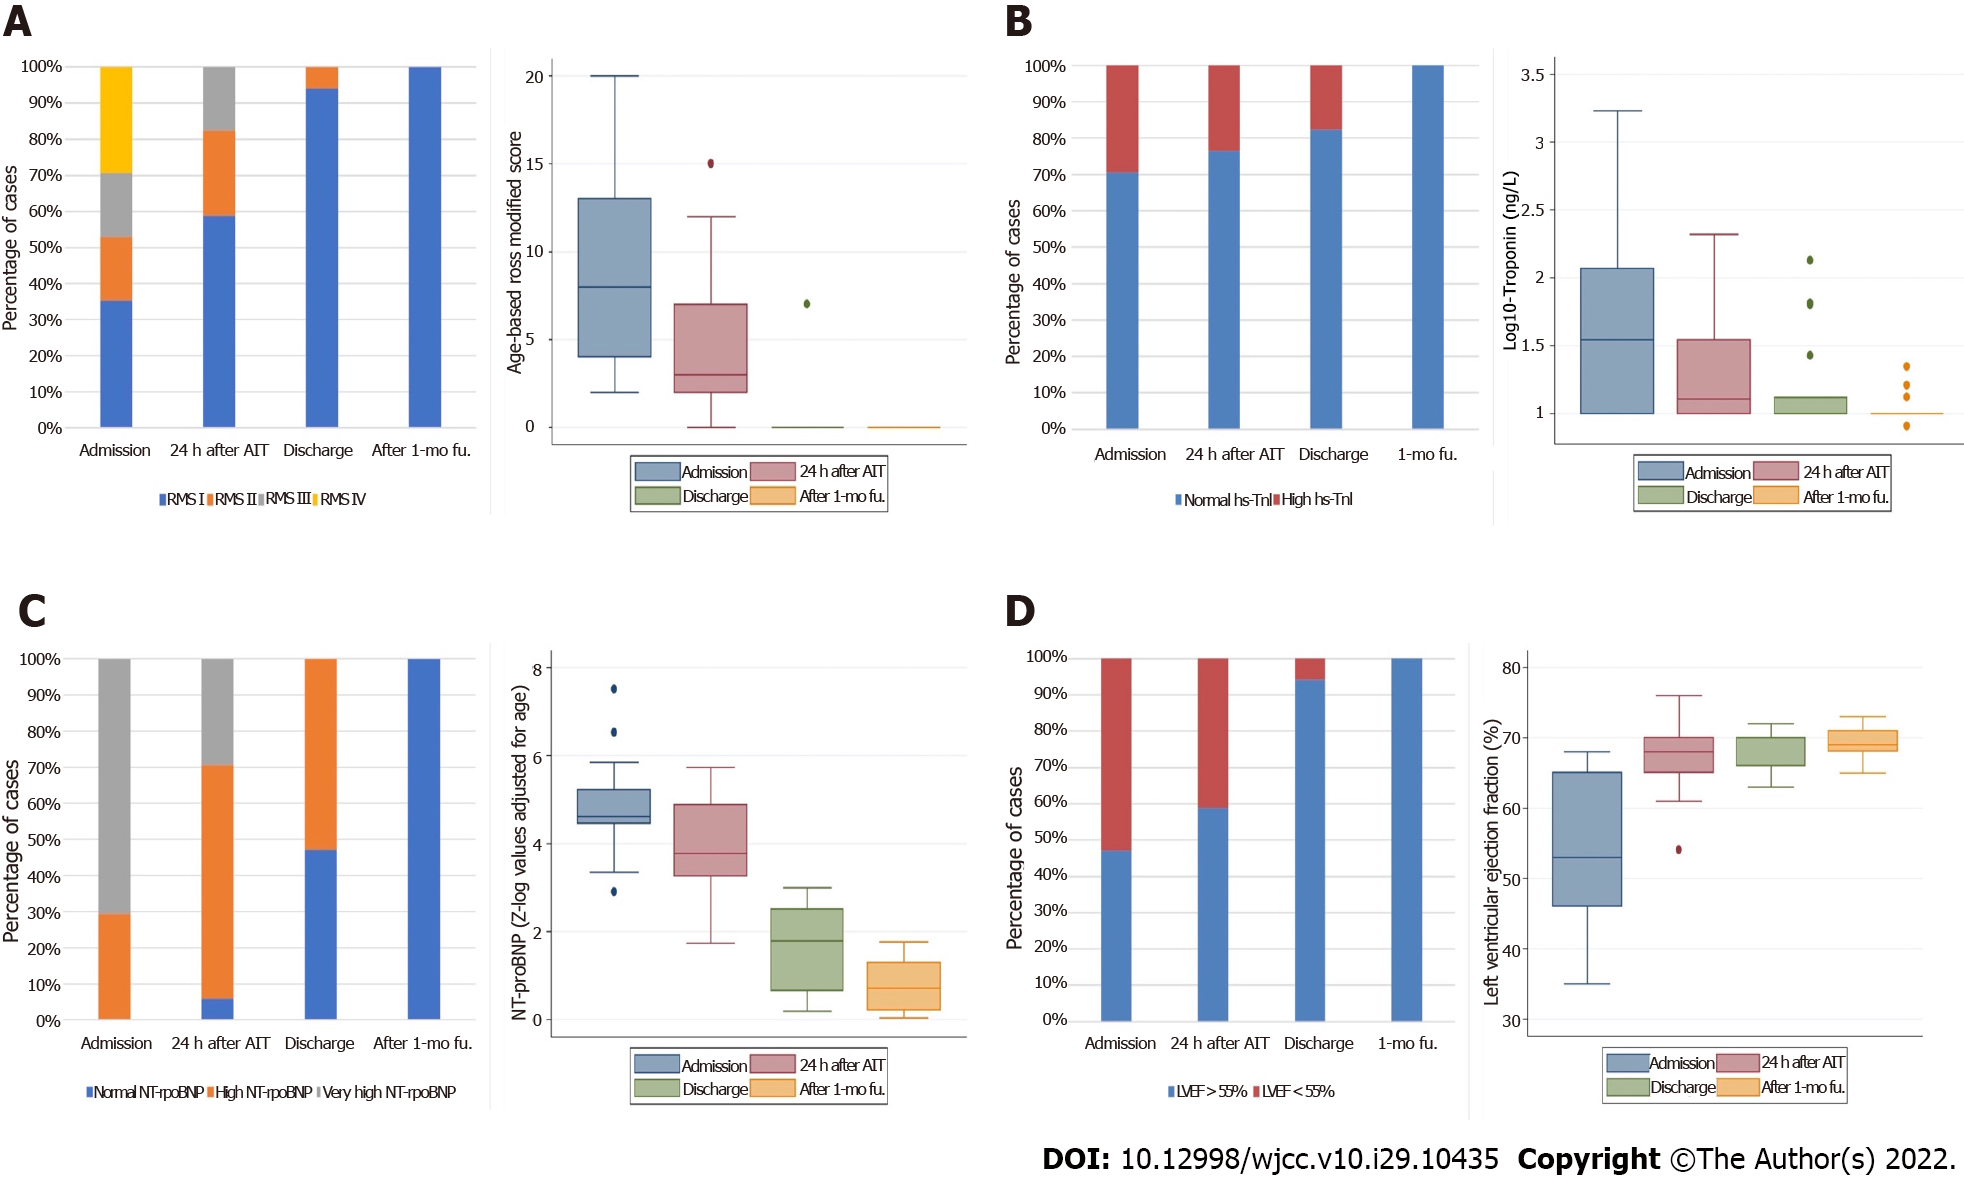
Figure 1 Bar (left panel) and box-plot (right panel) diagrams showing the dynamics of different cardiac measurements.
A: Ross modified score; B: High Sensitivity-Troponin I; C: N-terminal pro-brain natriuretic peptide; D: Left ventricular ejection fraction; obtained at 4 different time points in this study. NT-proBNP: N-terminal pro-brain natriuretic peptide; LVEF: Left ventricular ejection fraction.
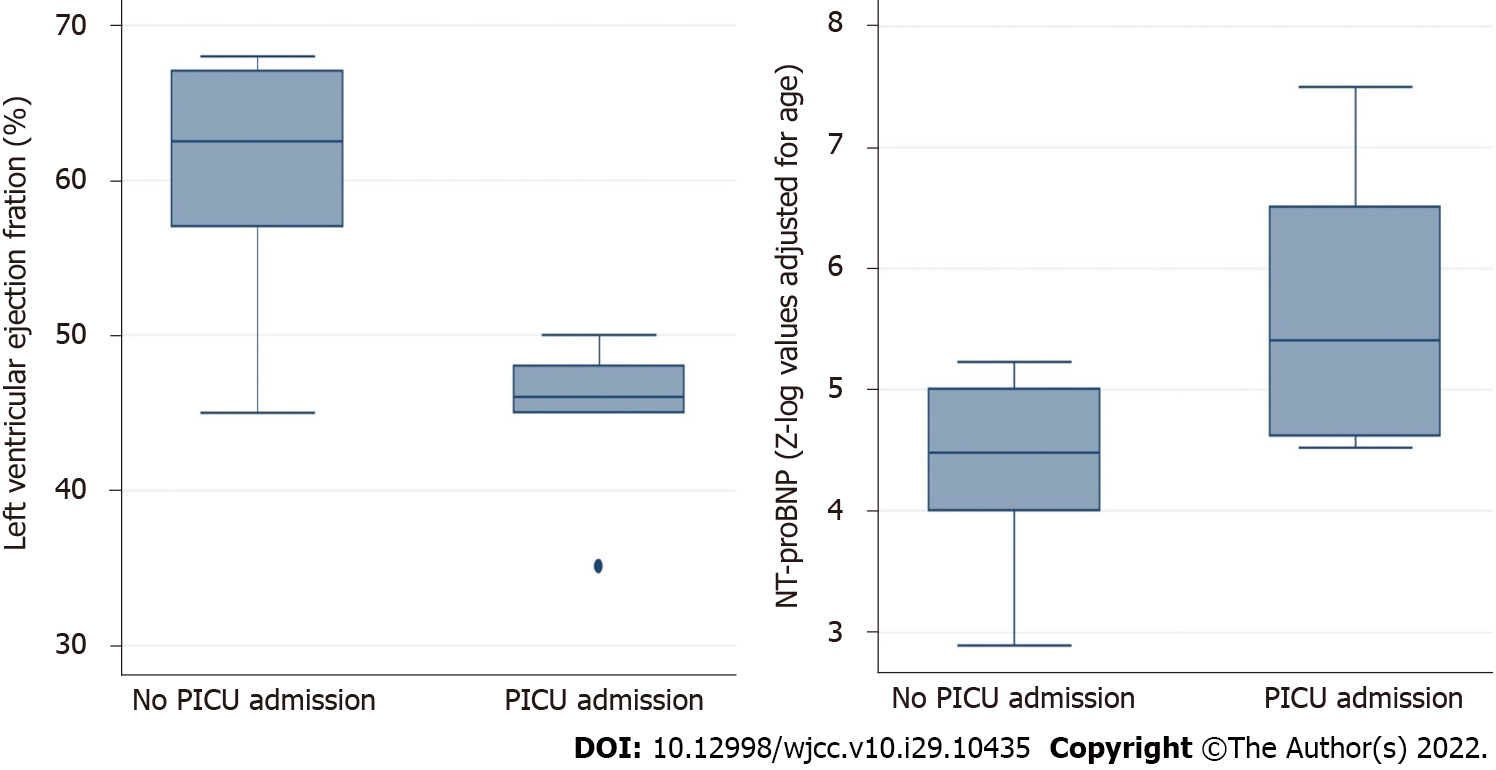
Figure 2 Box-plot diagrams showing the comparison of left ventricular ejection fraction (left panel) and N-terminal pro-brain natriuretic peptide (right panel) between groups of multisystem inflammatory syndrome in children severity.
PICU: Pediatric intensive care unit.
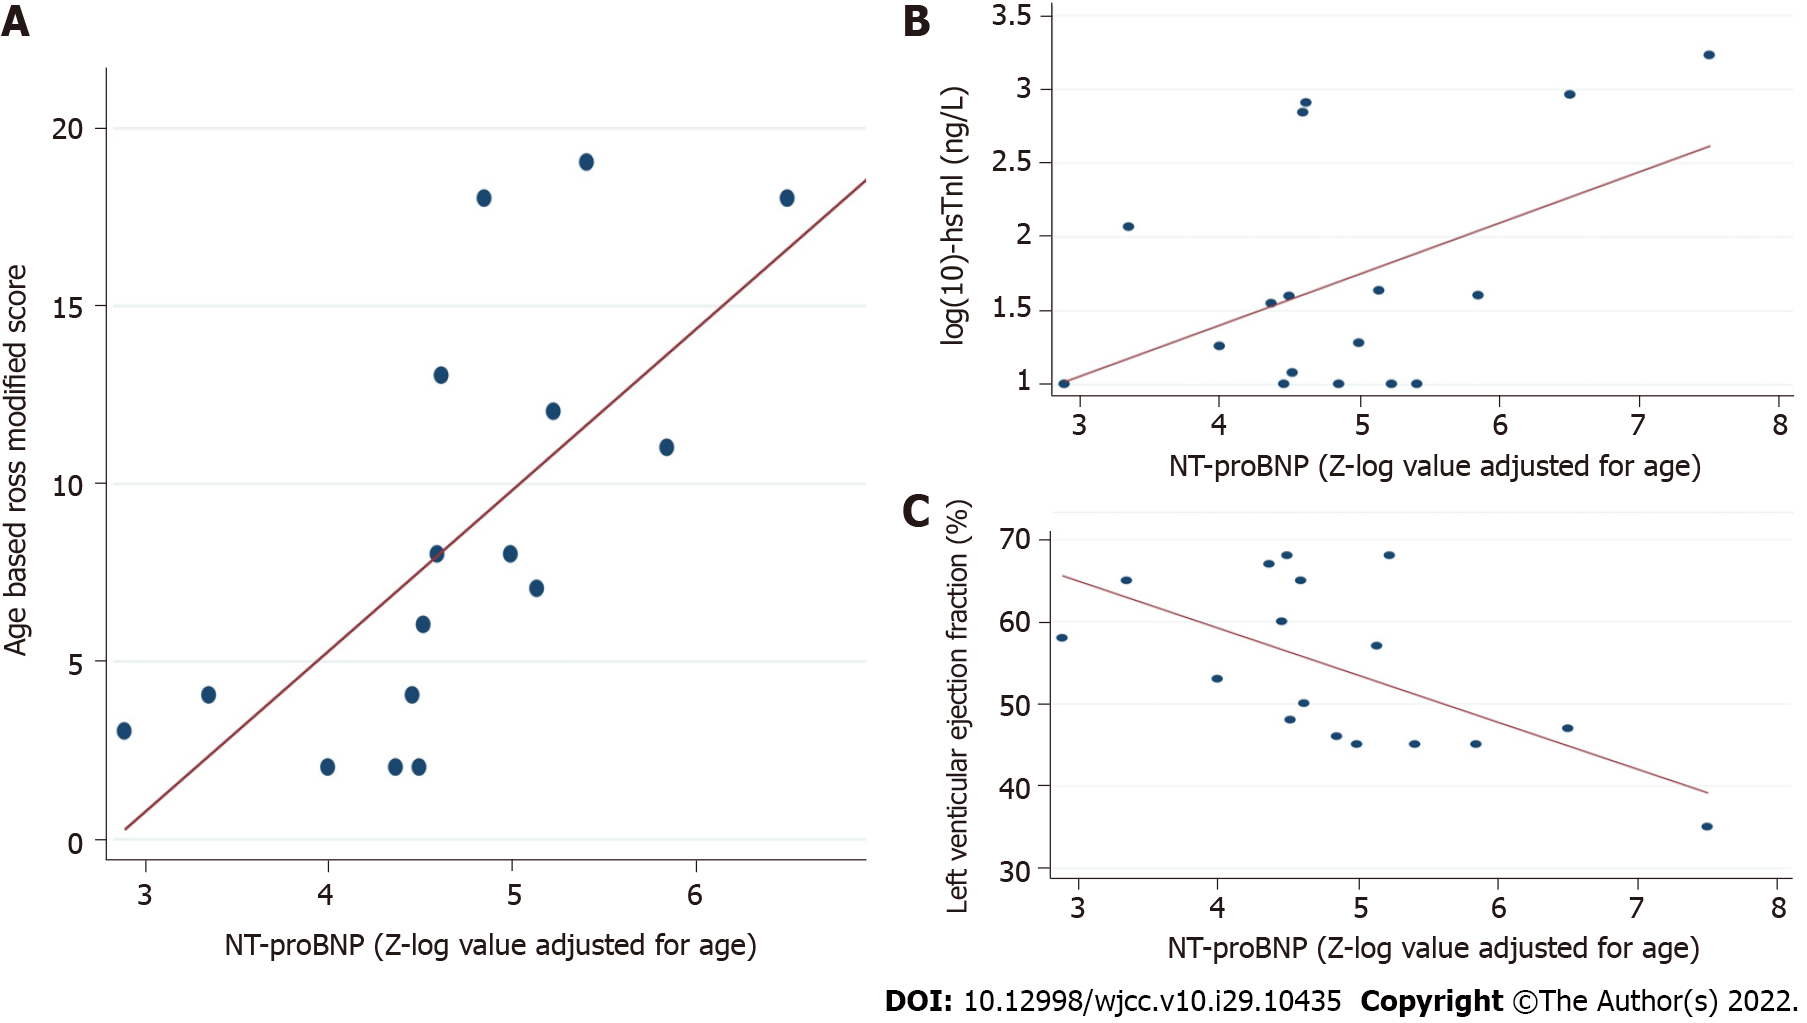
Figure 3 Scatter-plot diagrams.
A: The association between N-terminal pro-brain natriuretic peptide and Ross modified score; B: High Sensitivity-Troponin I; C: Left ventricular ejection fraction.
- Citation: Rodriguez-Gonzalez M, Castellano-Martinez A. Age-adjusted NT-proBNP could help in the early identification and follow-up of children at risk for severe multisystem inflammatory syndrome associated with COVID-19 (MIS-C). World J Clin Cases 2022; 10(29): 10435-10450
- URL: https://www.wjgnet.com/2307-8960/full/v10/i29/10435.htm
- DOI: https://dx.doi.org/10.12998/wjcc.v10.i29.10435


