Copyright
©The Author(s) 2022.
World J Clin Cases. Sep 26, 2022; 10(27): 9743-9749
Published online Sep 26, 2022. doi: 10.12998/wjcc.v10.i27.9743
Published online Sep 26, 2022. doi: 10.12998/wjcc.v10.i27.9743
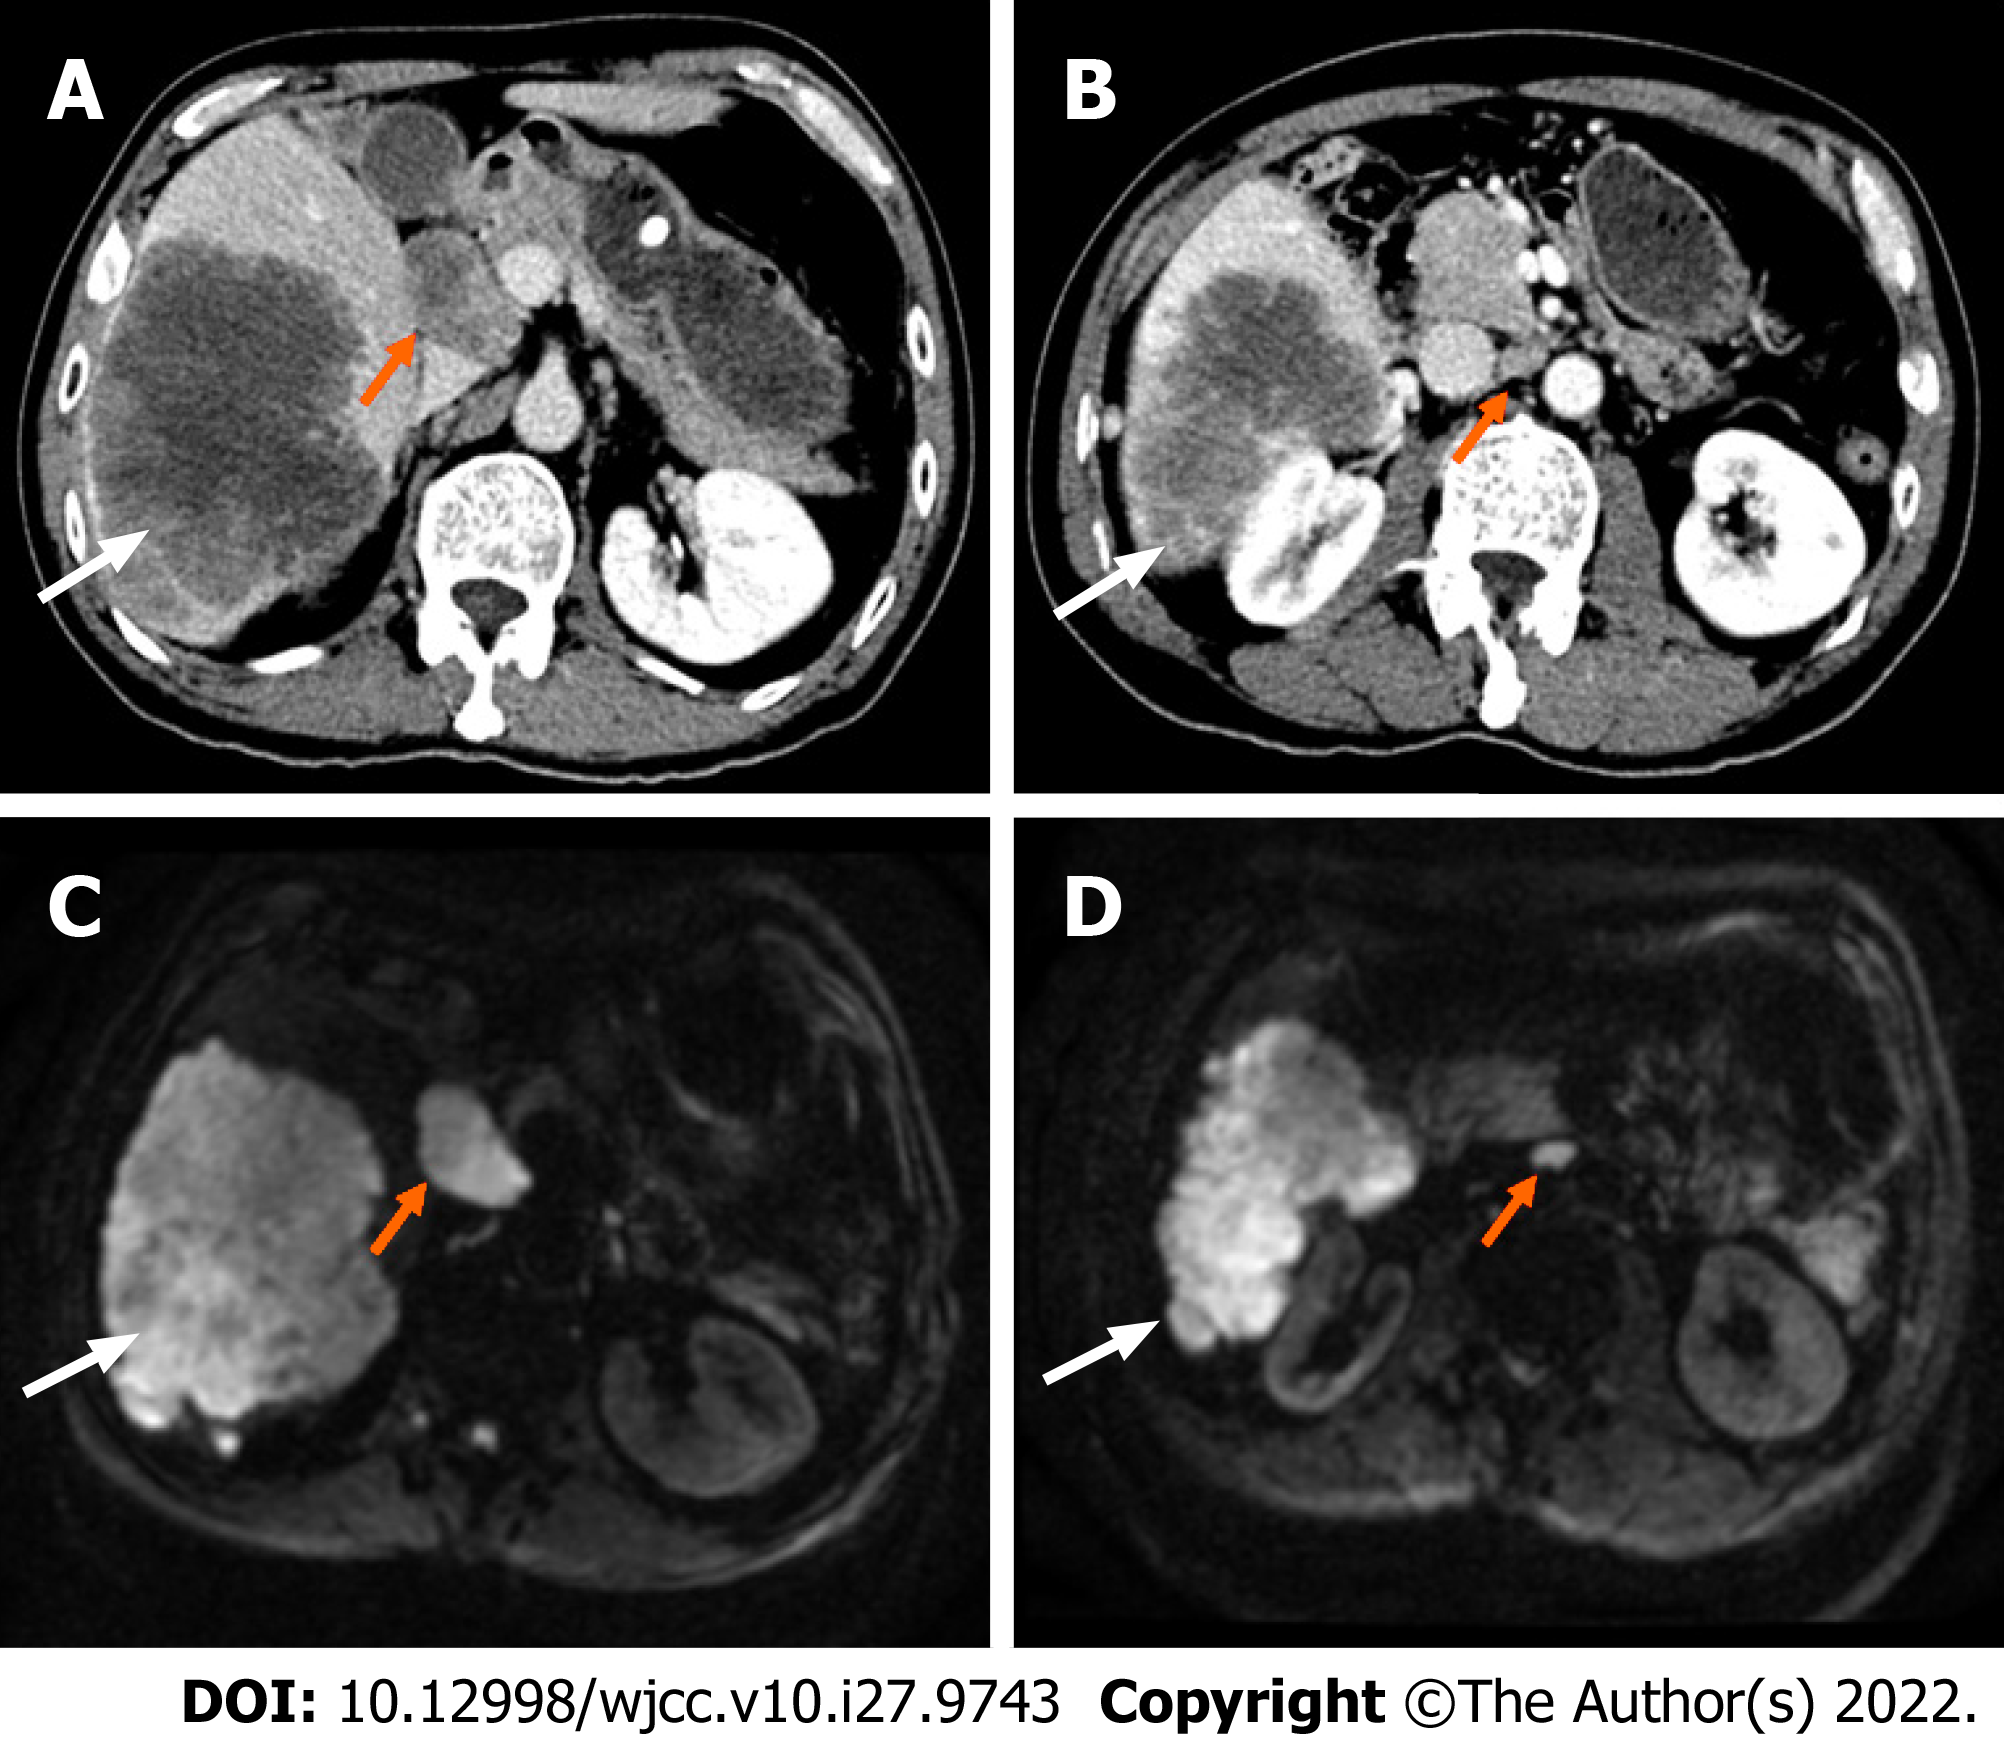
Figure 1 Pre-operative liver computed tomography and magnetic resonance imaging scan.
A: Axial portal phase computed tomography (CT) showed the tumors (white arrow) are located in the right lobe, with the longest diameter being about 20 cm; hilar lymph metastasis node (orange arrow) is found; B: Axial arterial phase CT at different levels reveals the tumors (white arrow) and the hilar lymph node metastasis(orange arrow); C and D: Axial diffusion-weighted imaging image at different levels reveals the tumors (white arrow) and the hilar lymph node metastasis (orange arrow).
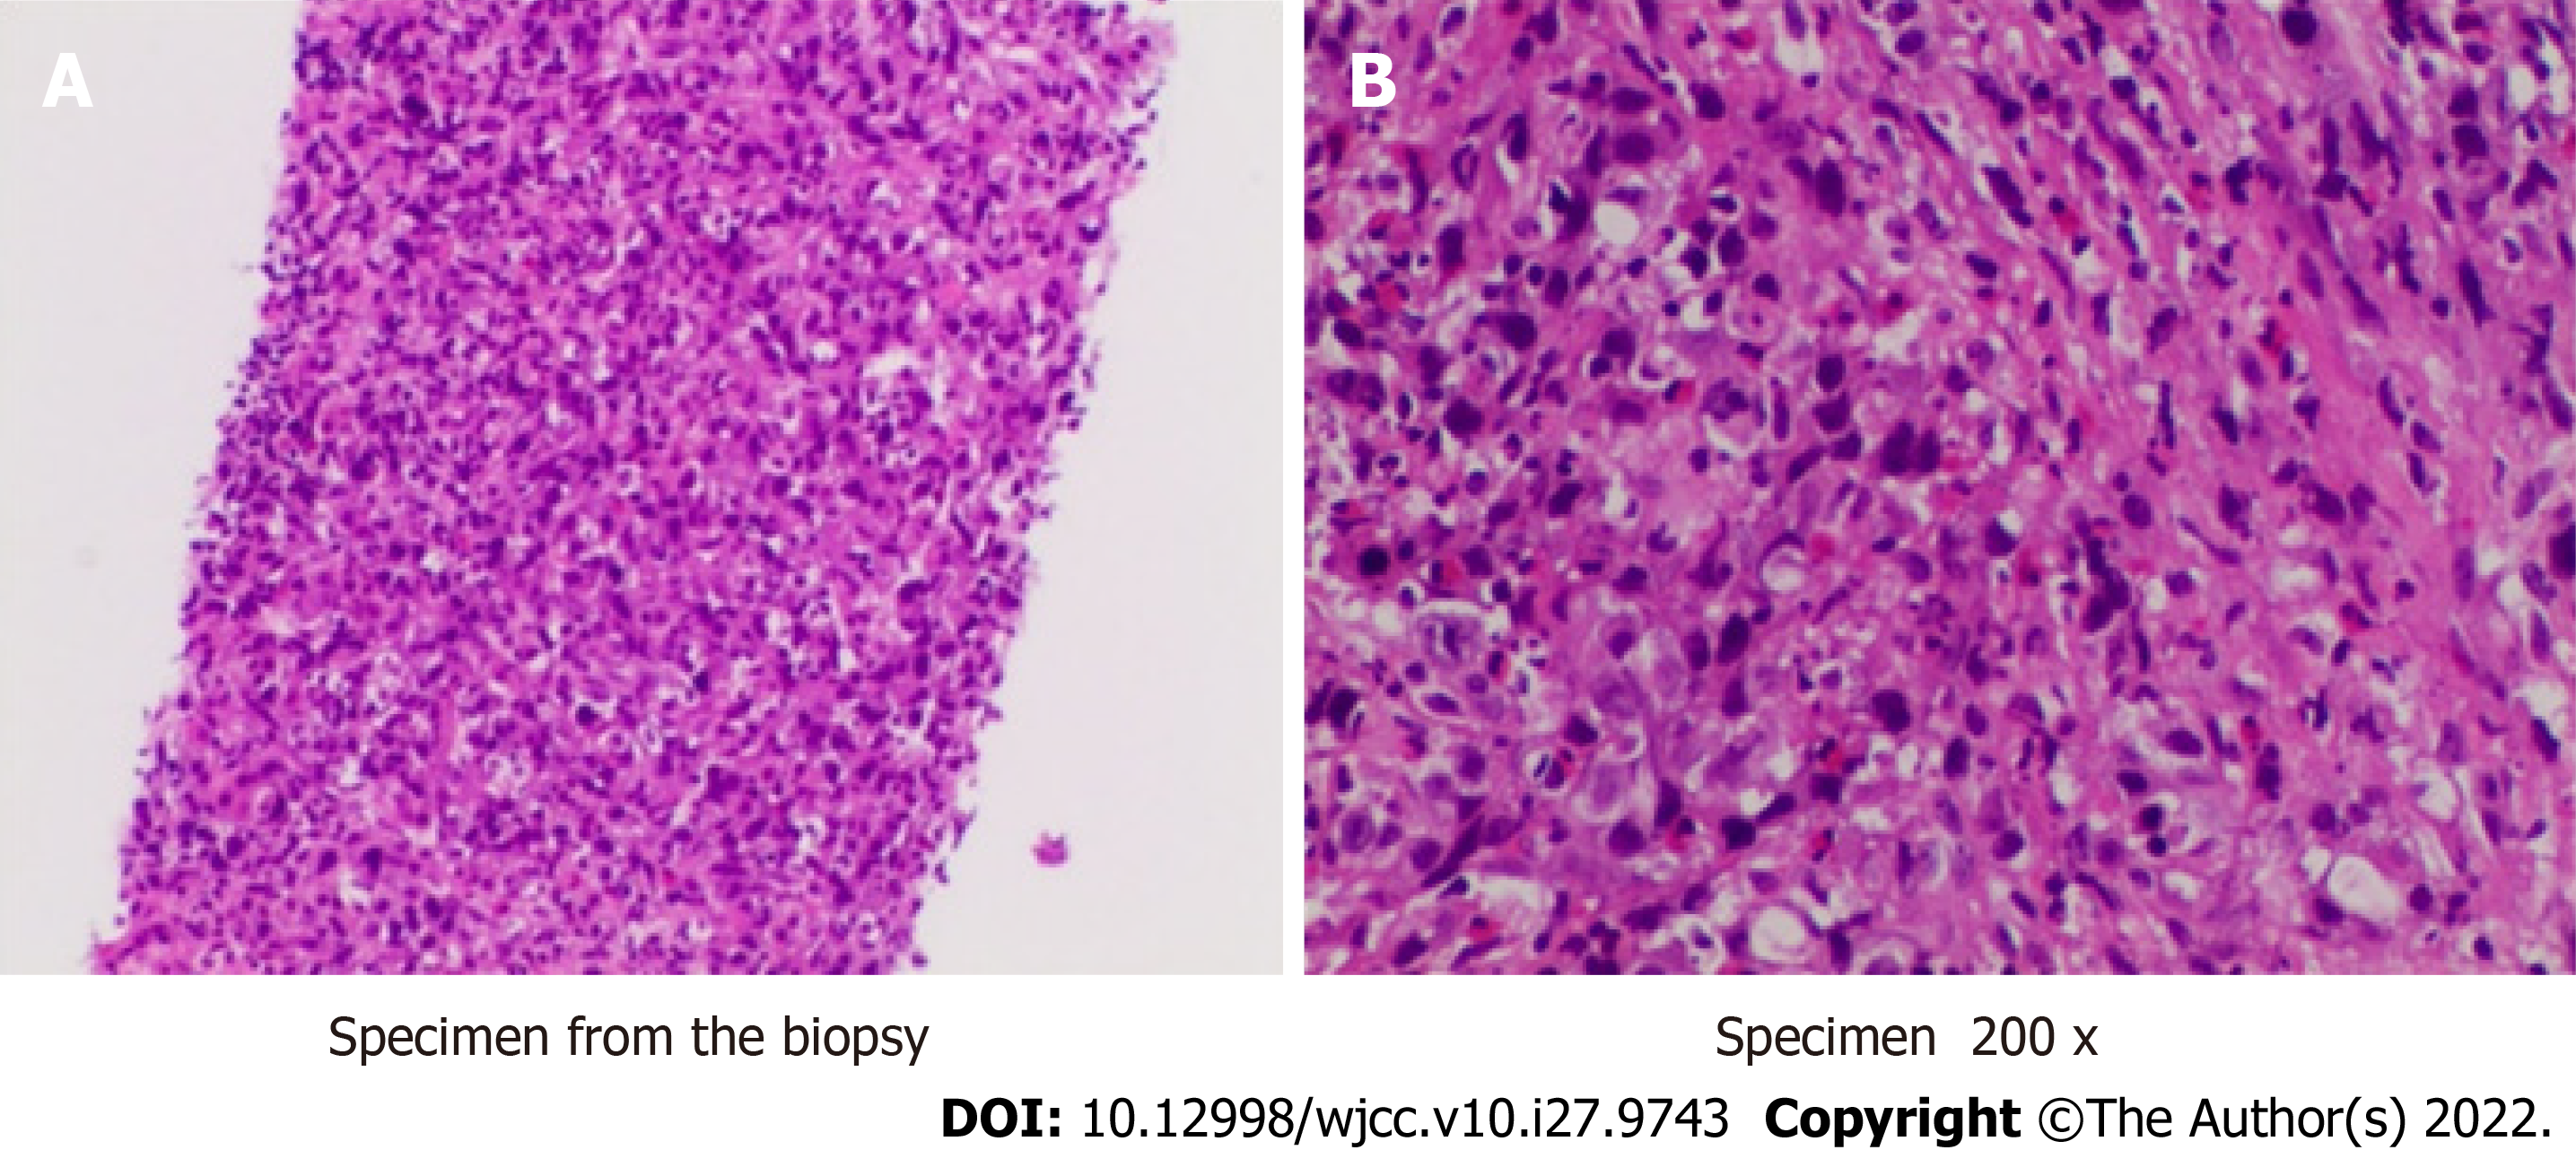
Figure 2 Pathological pictures of liver tumor puncture.
A: The Specimen under low power microscope (10×) shows fish-like changes; B: Specimen under high power microscope (200 ×) shows atypical cells and lymphocyte infiltration.
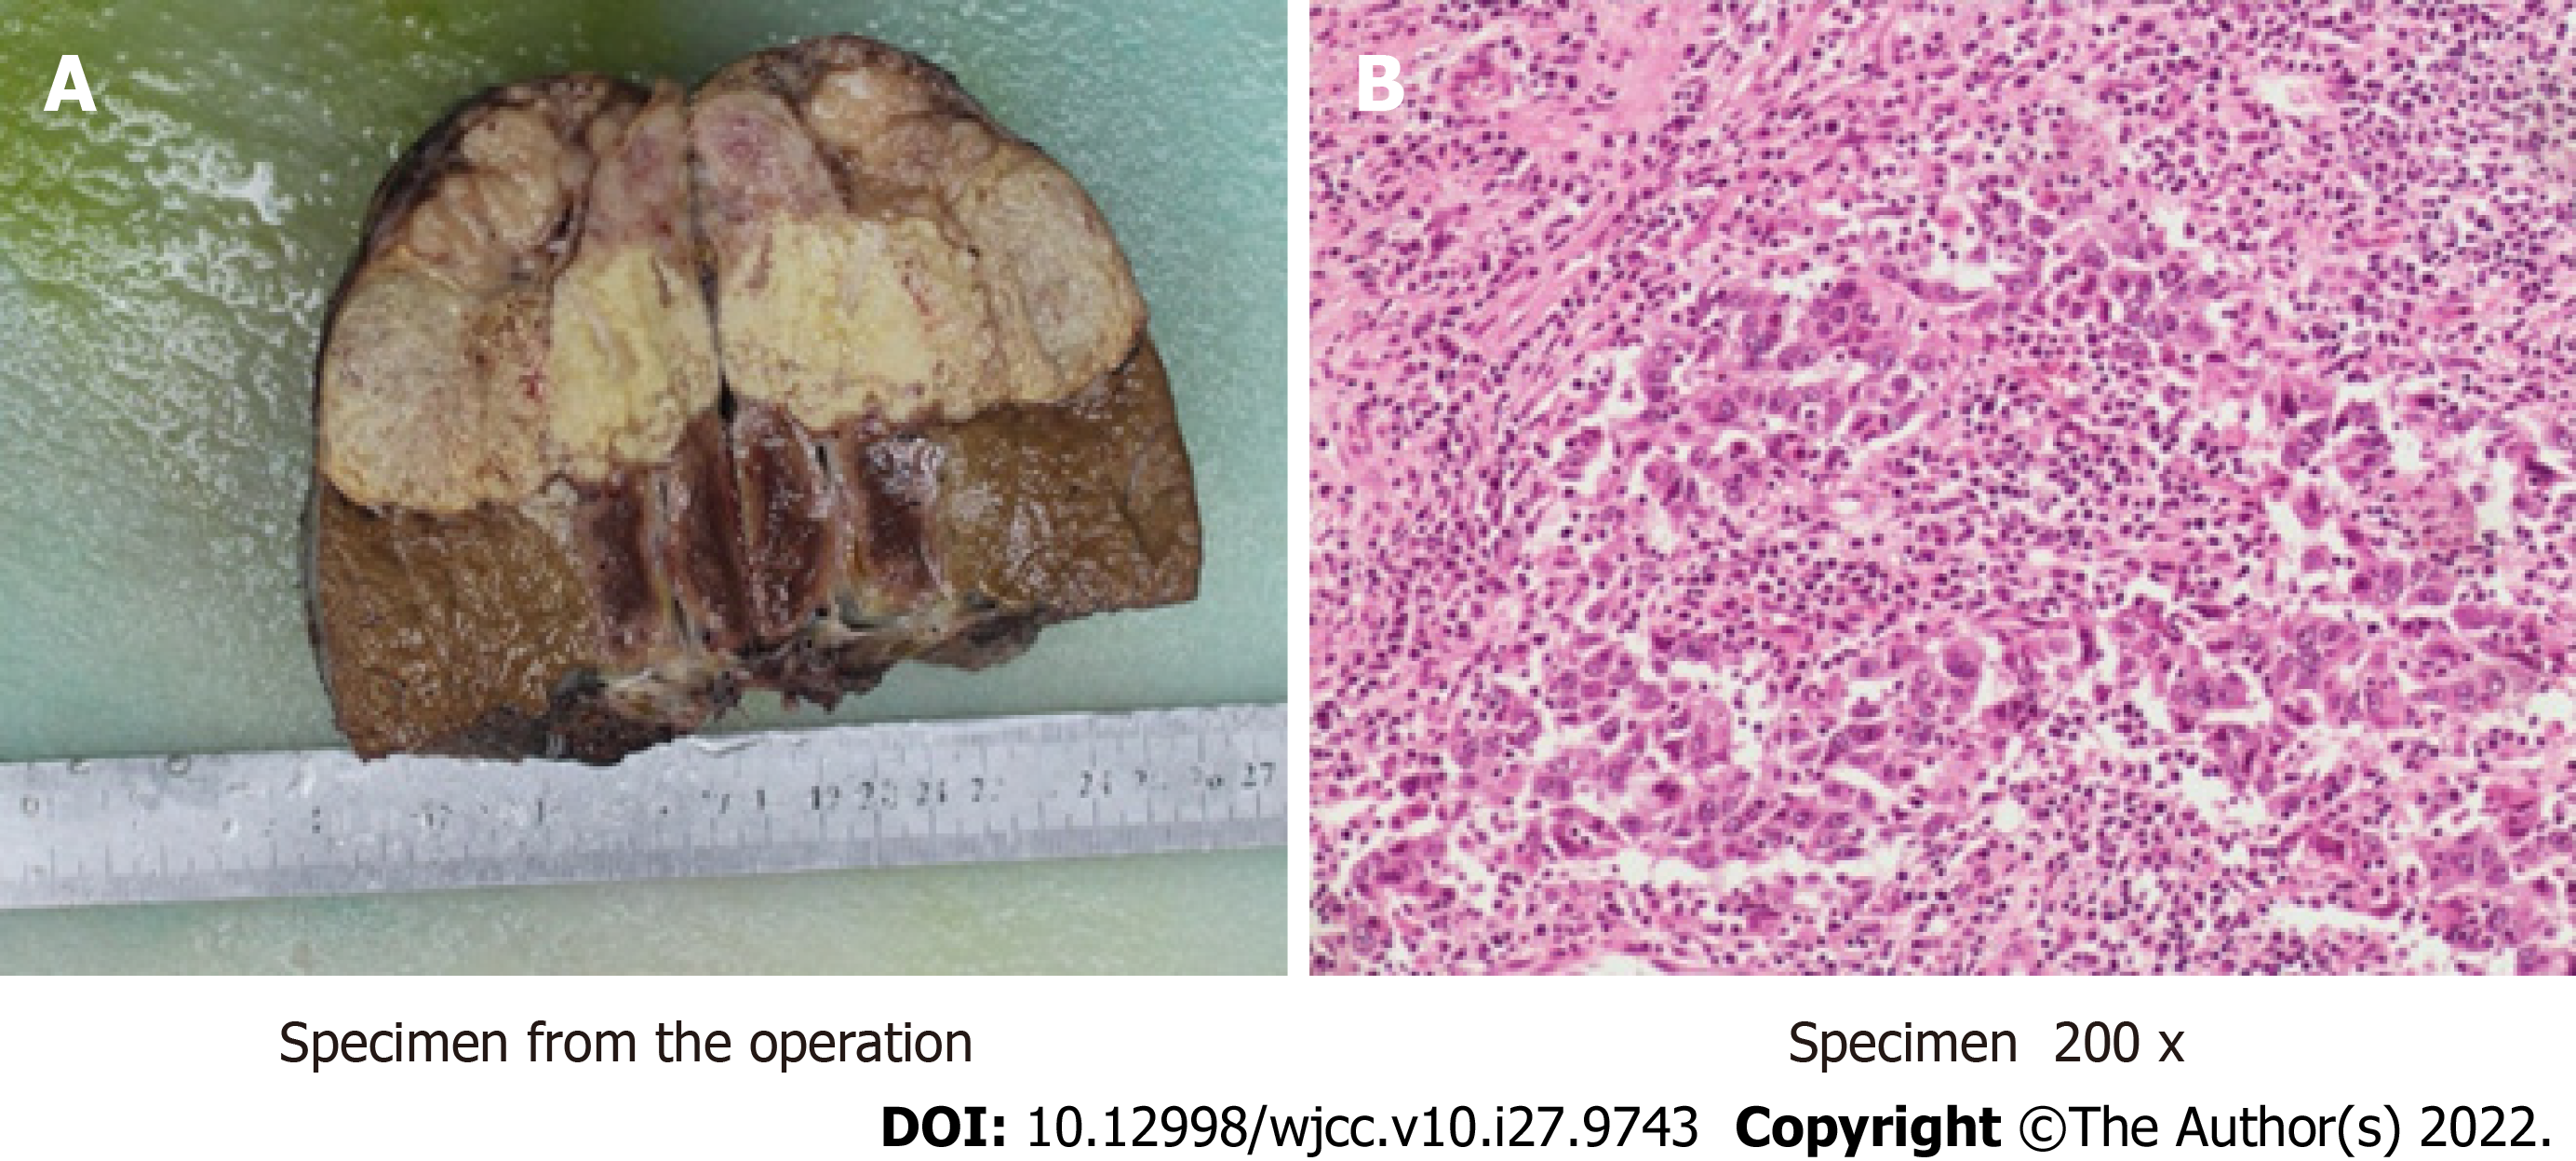
Figure 3 Postoperative pathological pictures.
A: The gross specimen after operation; B: The specimen under high power microscope (200 ×) after operation is consistent with the puncture specimens.
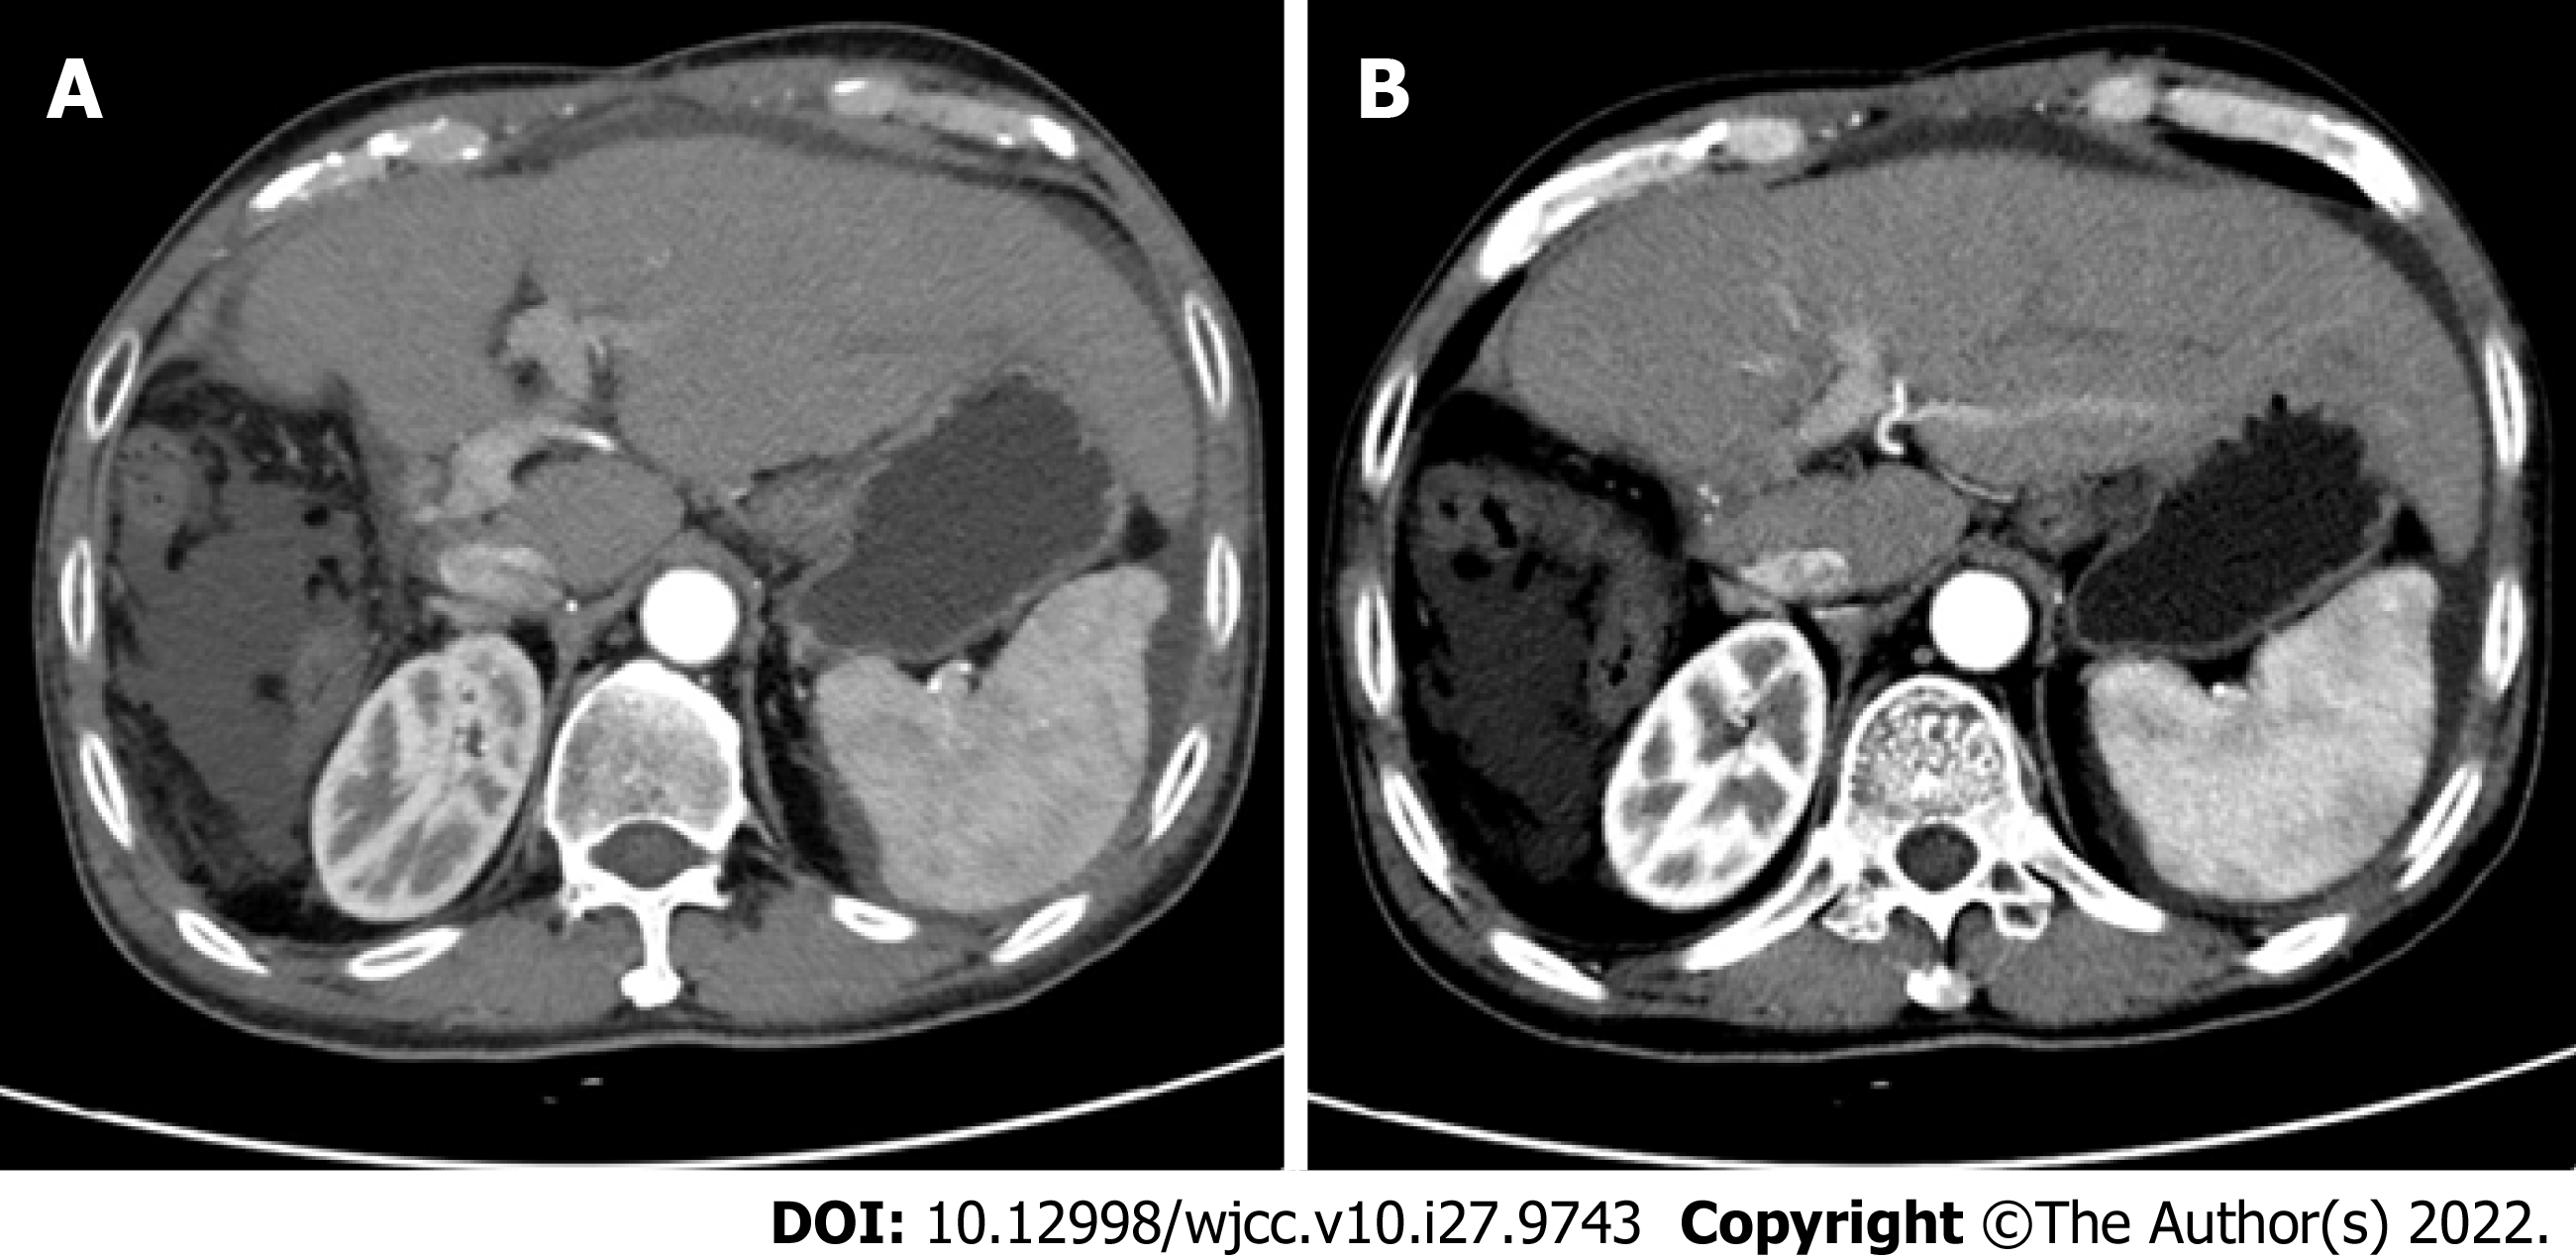
Figure 4 The liver computed tomography scan after eight months of the operation.
A and B: Axial enhanced computed tomography scan at different levels shows there is no recurrence.
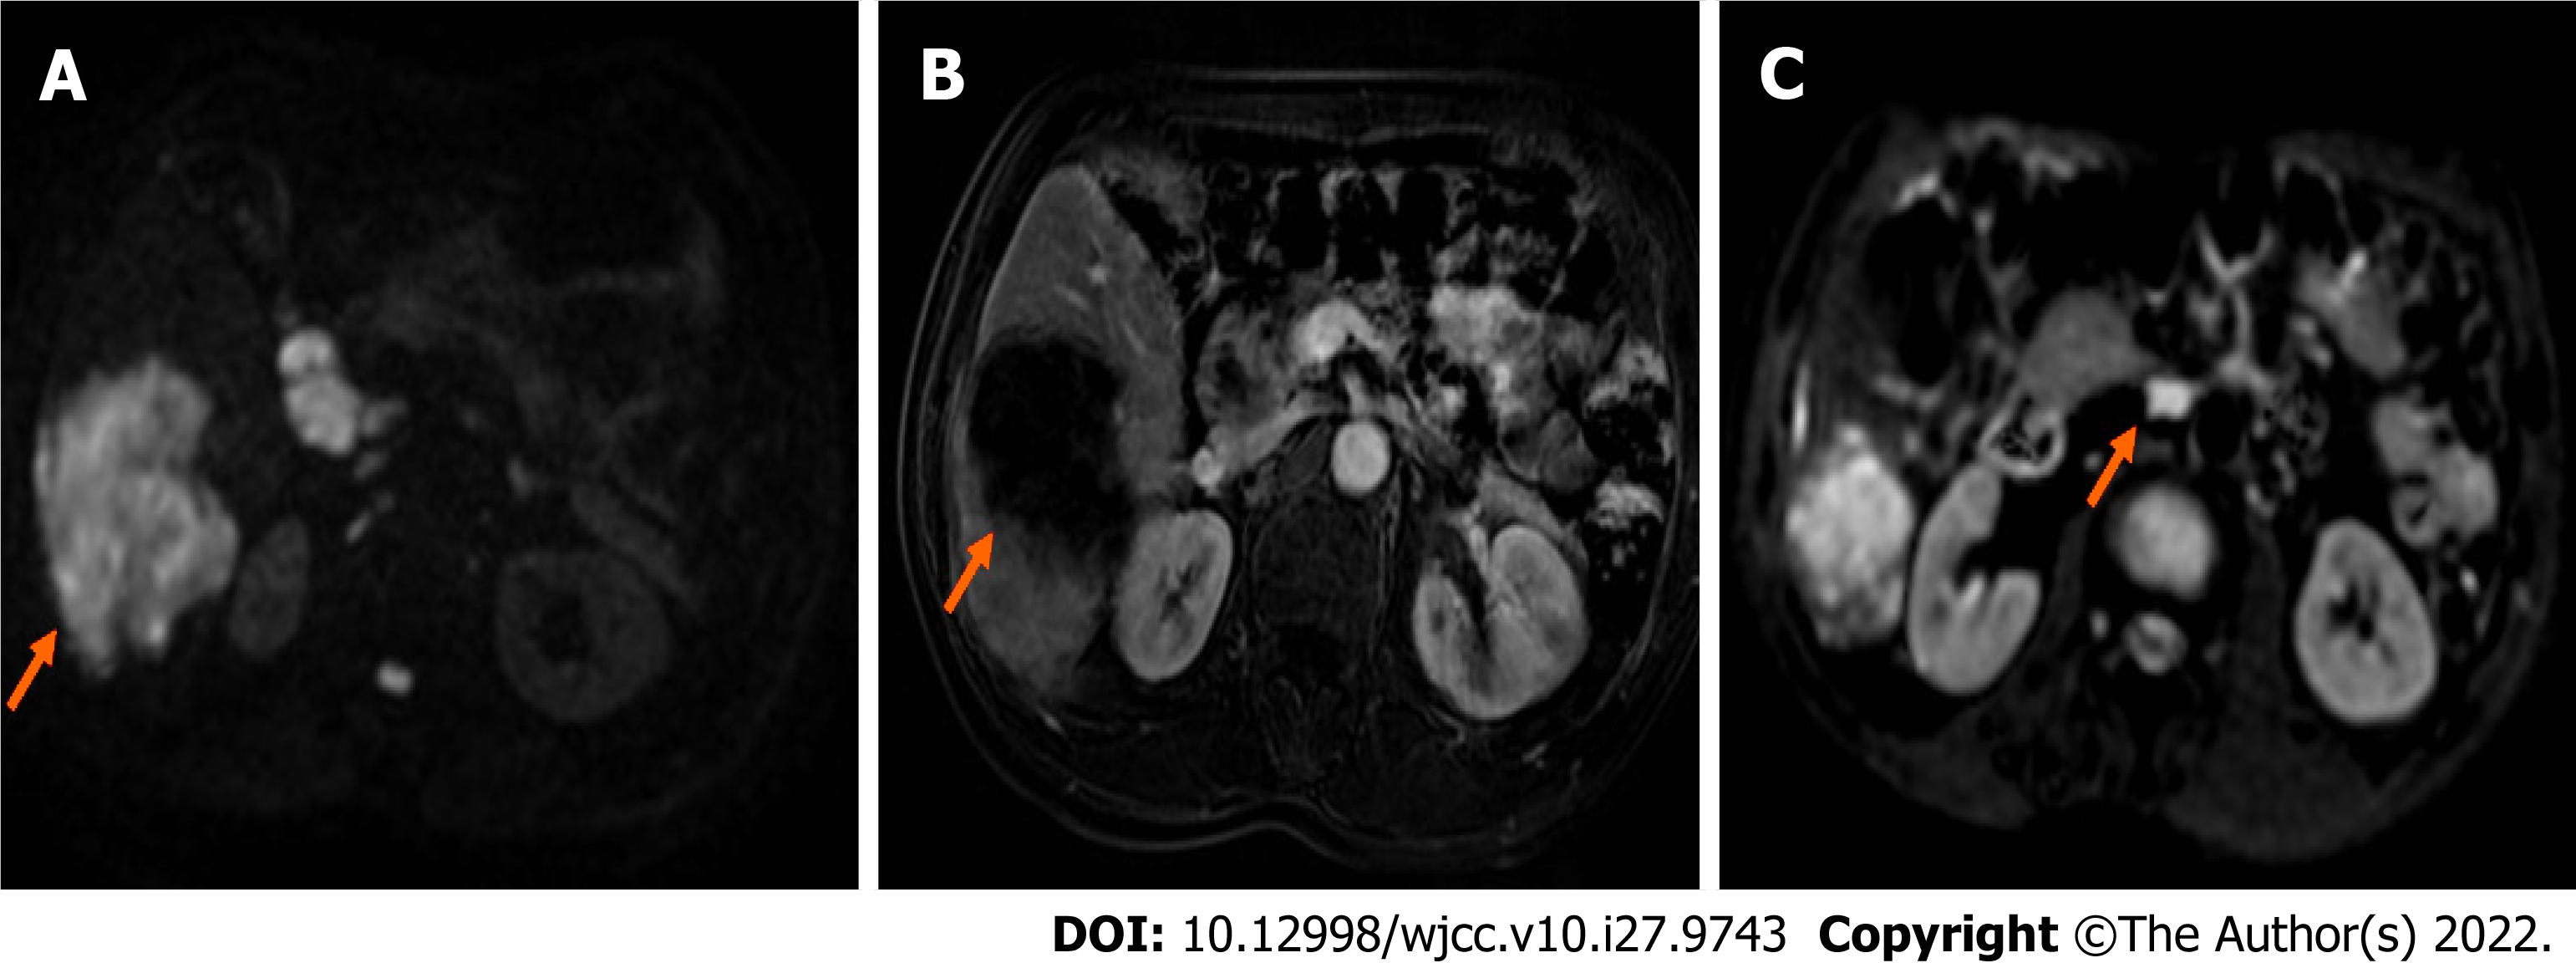
Figure 5 Magnetic resonance imaging scan after the neoadjuvant therapy.
A: Axial diffusion-weighted imaging (DWI) image shows the tumor (orange arrow) is reduced obviously; B: Axial enhanced magnetic resonance imaging reveals the tumor (orange arrow) is reduced obviously; C: DWI image shows the hilar lymph metastasis node (orange arrow) disappeared.
- Citation: Zhu SG, Li HB, Dai TX, Li H, Wang GY. Successful treatment of stage IIIB intrahepatic cholangiocarcinoma using neoadjuvant therapy with the PD-1 inhibitor camrelizumab: A case report. World J Clin Cases 2022; 10(27): 9743-9749
- URL: https://www.wjgnet.com/2307-8960/full/v10/i27/9743.htm
- DOI: https://dx.doi.org/10.12998/wjcc.v10.i27.9743


