Copyright
©The Author(s) 2022.
World J Clin Cases. Sep 16, 2022; 10(26): 9417-9427
Published online Sep 16, 2022. doi: 10.12998/wjcc.v10.i26.9417
Published online Sep 16, 2022. doi: 10.12998/wjcc.v10.i26.9417
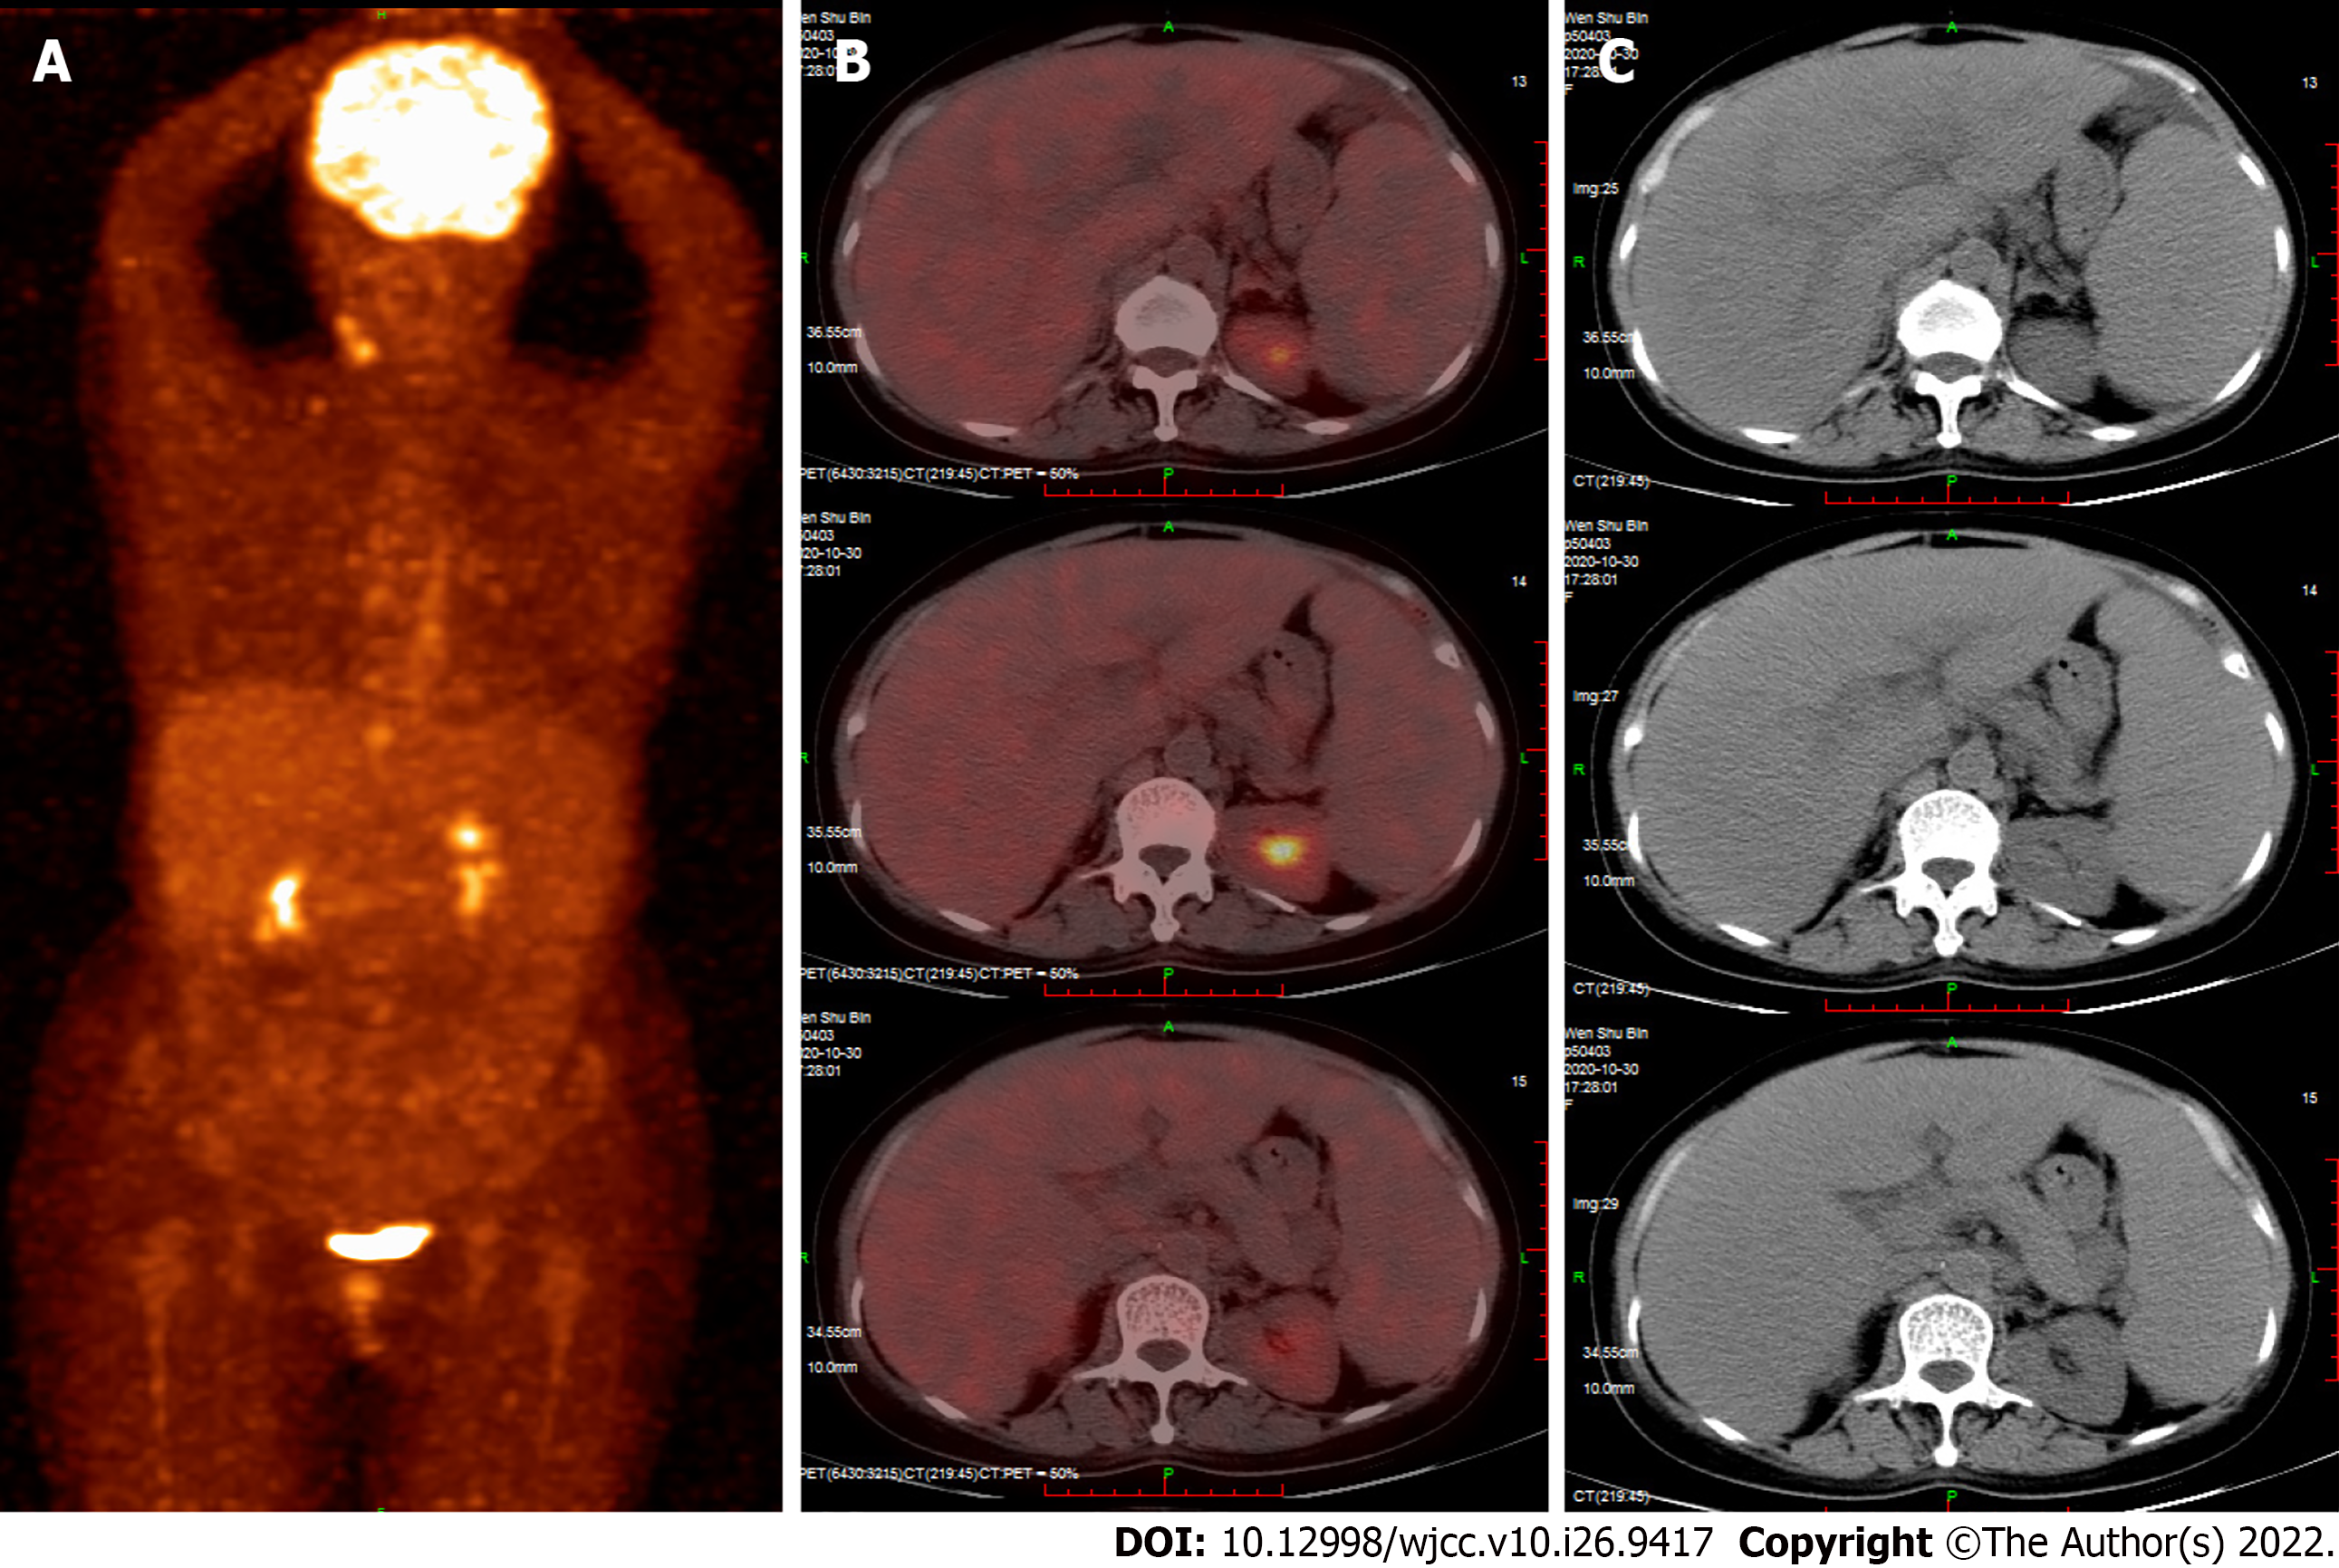
Figure 1 Positron emission tomography.
A: whole body scan; B and C: Scan showing the liver (SUVmax 2.28, mean 1.90), The liver was diffusely enlarged, increased spleen volume was observed, and there was a small amount of abdominal effusion.
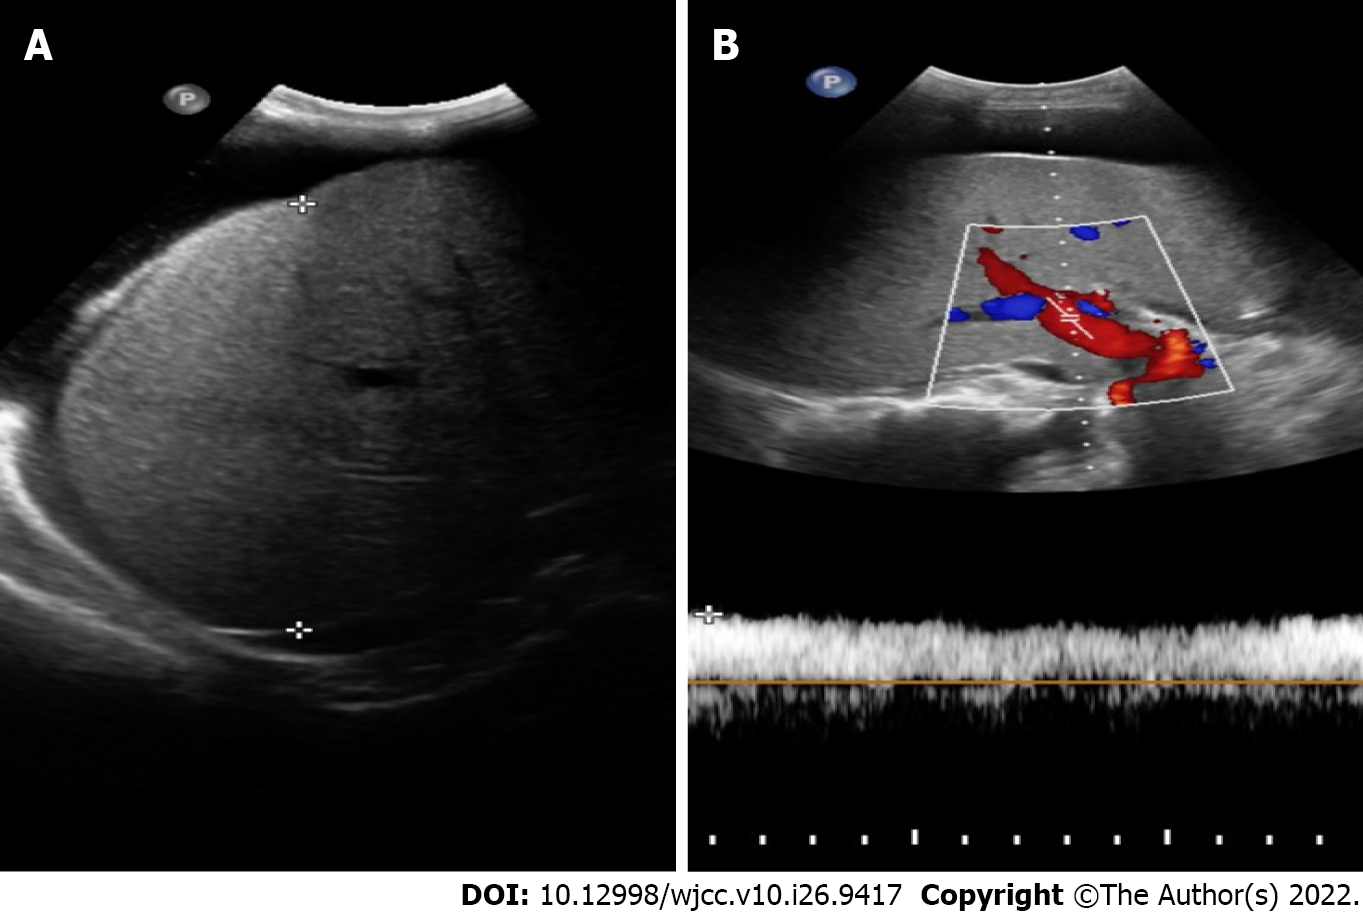
Figure 2 Liver ultrasound.
A: The liver capsule was less smooth, and the right liver had a maximum oblique transaxial distance of 15 cm and increased parenchymal echogenicity. The liver parenchyma was slightly thickened and heterogeneous without a definite space-occupying lesion; B: The diameter of the extrahepatic portal vein was approximately 12 mm, and the blood flow was unidirectional to the liver at a flow rate of 29.3 cm/s. The cava caliber and lumen appeared normal, as did blood flow in the hepatic vein, superior mesenteric vein, splenic vein, and inferior vena cava.
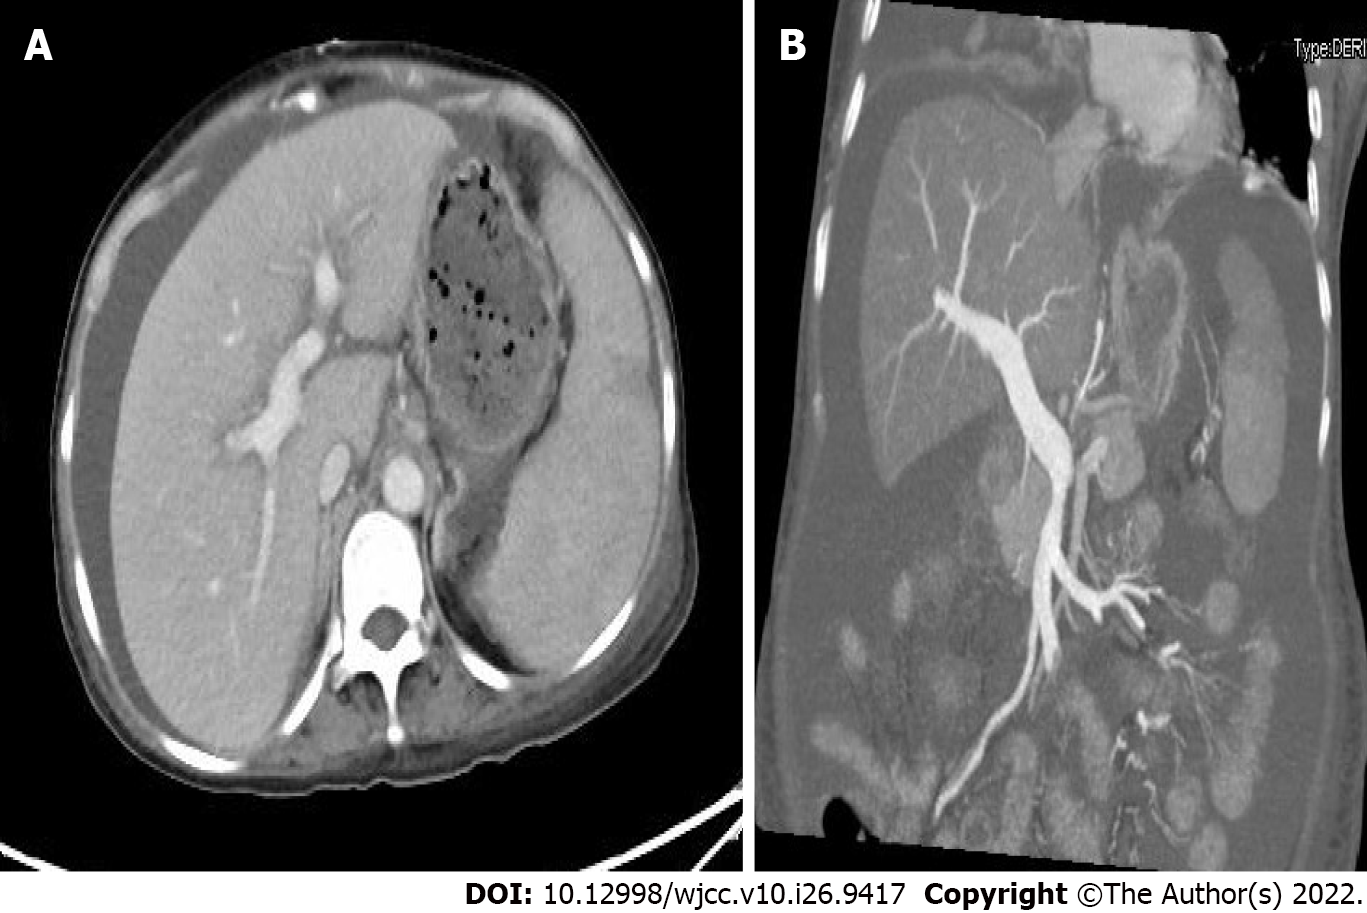
Figure 3 Liver computed tomographic arteriography.
A: Spleen growth: spleen enhancement was less uniform, and patchy slightly hypointense areas were seen, not excluding infarcts or intrahepatic lymphatic stasis; B: The main portal vein and splenic vein were slightly thickened, the diameter of the main portal vein was approximately 1.5 cm, and there was no thrombus or collateral circulation opening, A and B: The vessel was smooth and unobstructed.
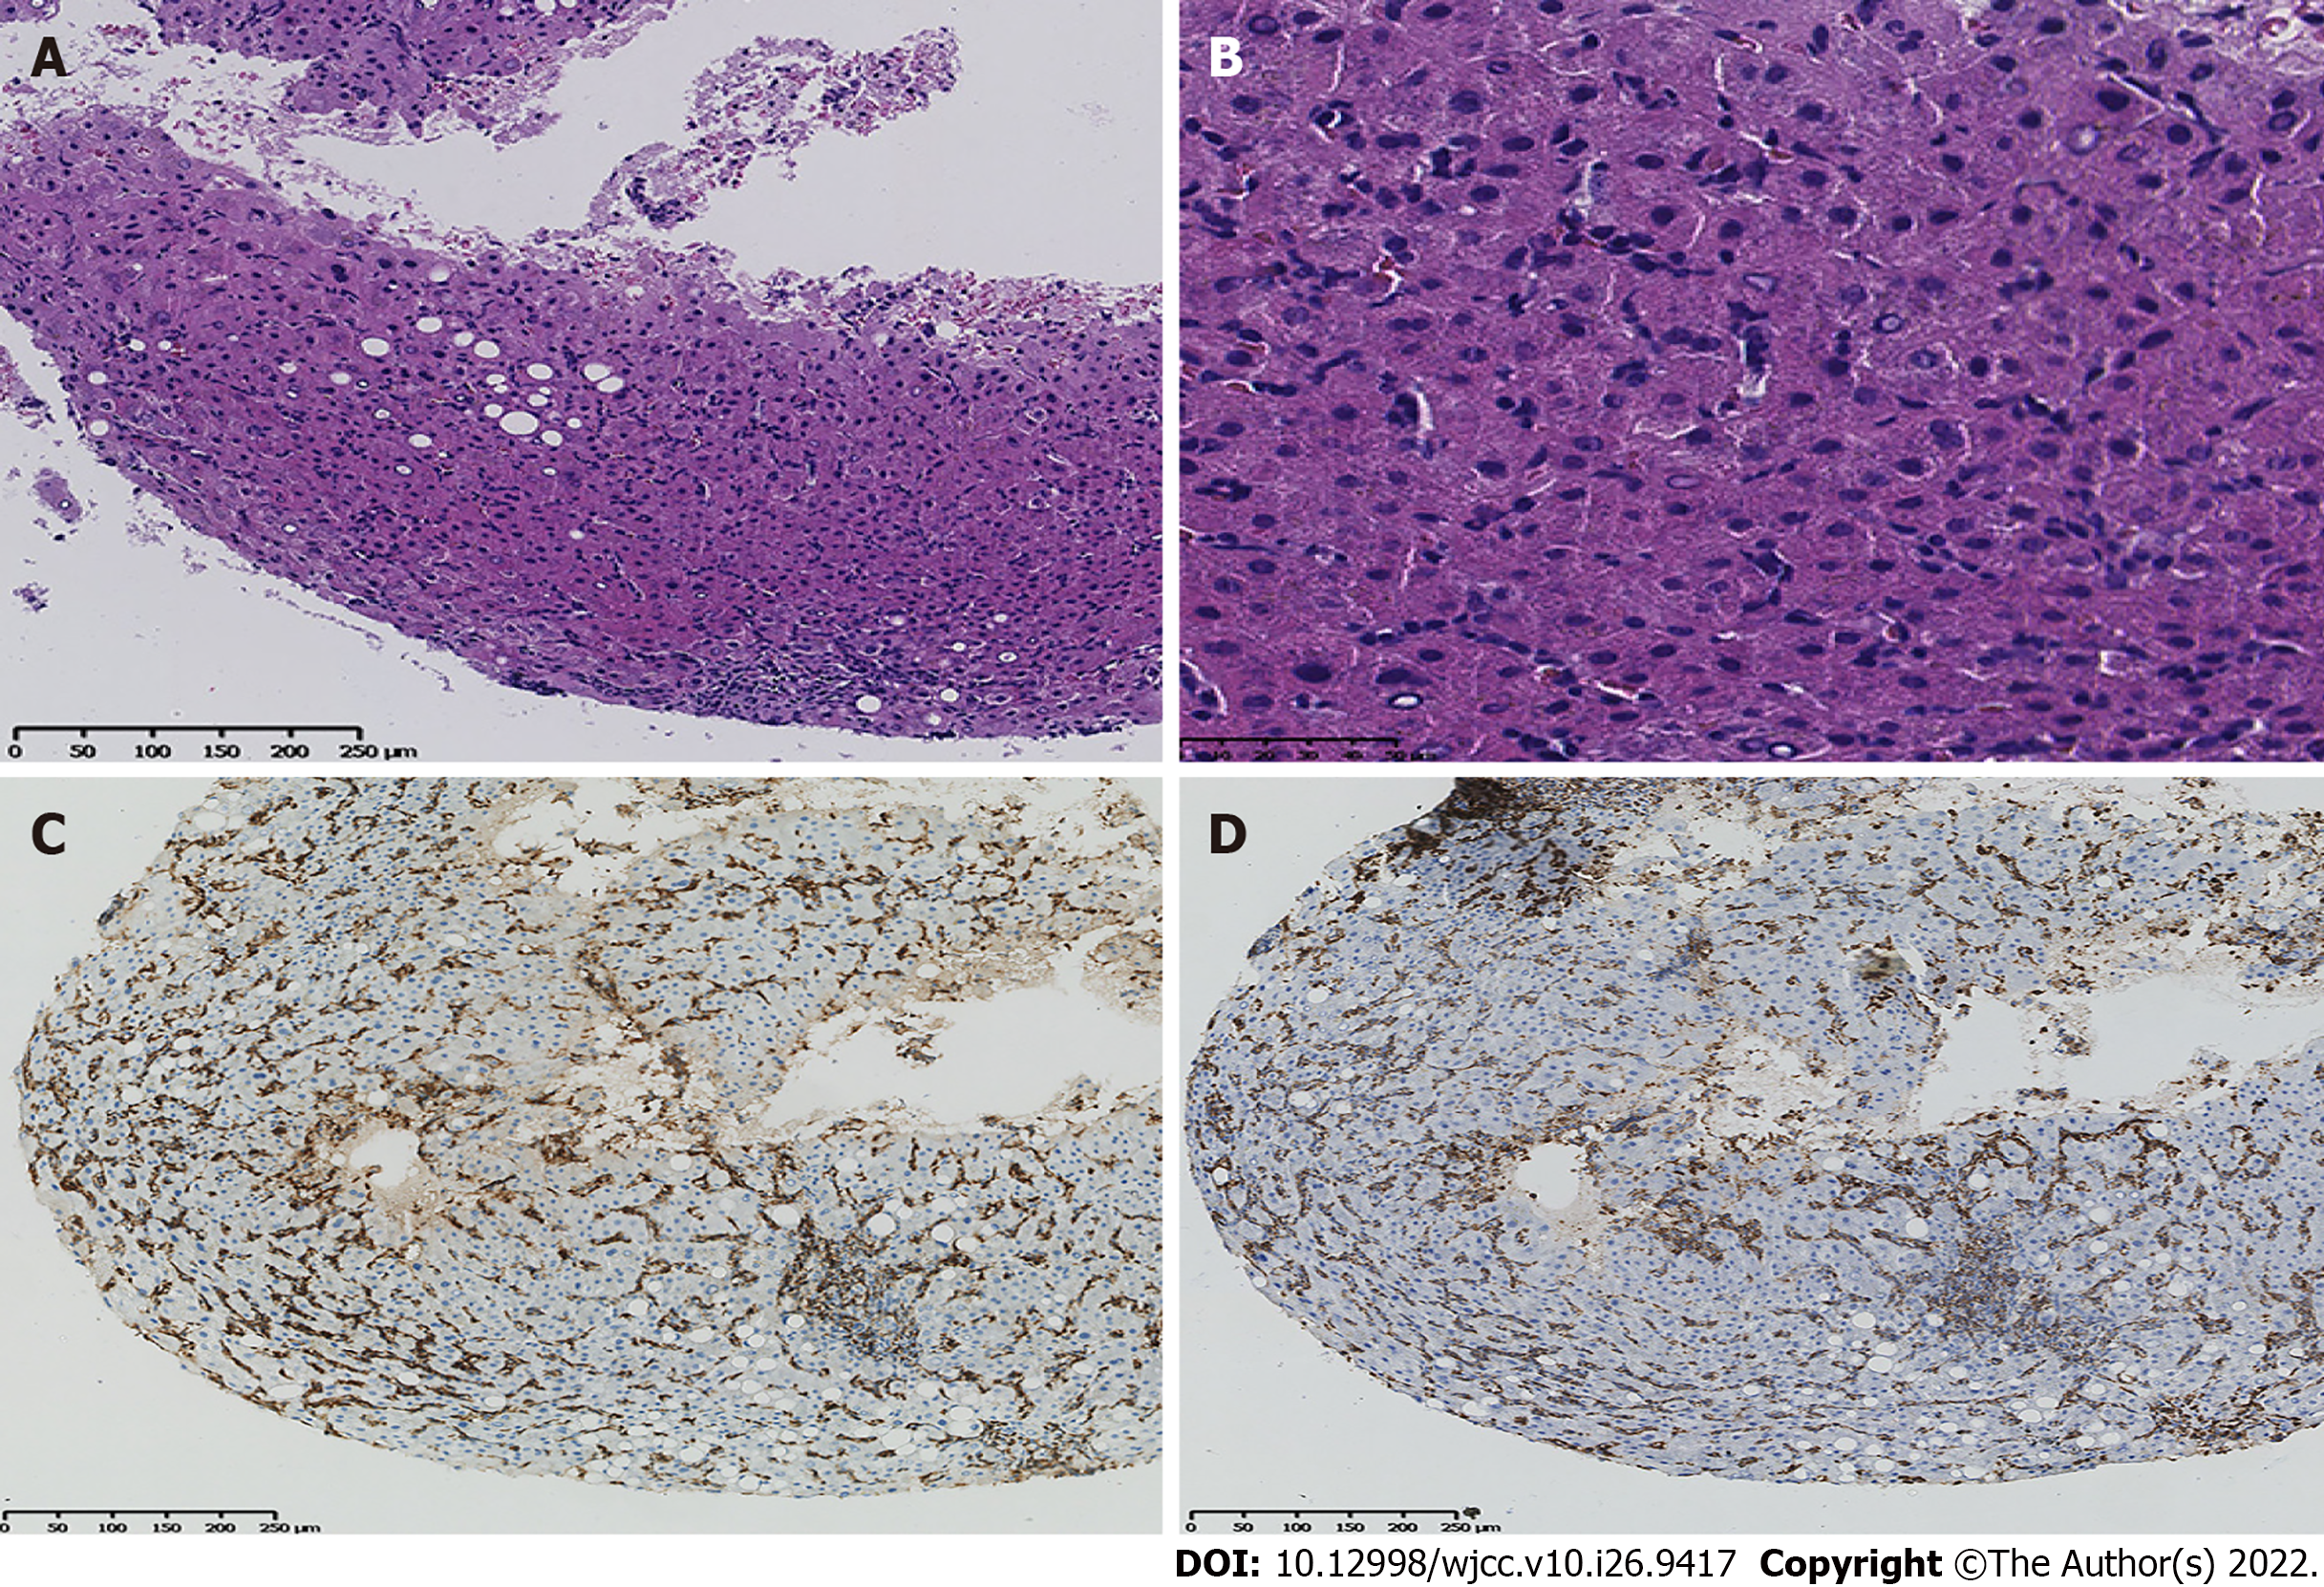
Figure 4 Pathology and immunochemistry were performed on four pieces of liver tissue.
A: Histopathological examination by haematoxylin and eosin staining (100 ×); B: Histopathological examination by haematoxylin and eosin staining (400×) showed few hepatocytes that were watery and lipomatous and multiple small focal lymphoid cell infiltrates; C: Immunochemical staining shows CD3 positivity; D: Immunochemical staining shows CD7 positivity. H&E, haematoxylin and eosin.
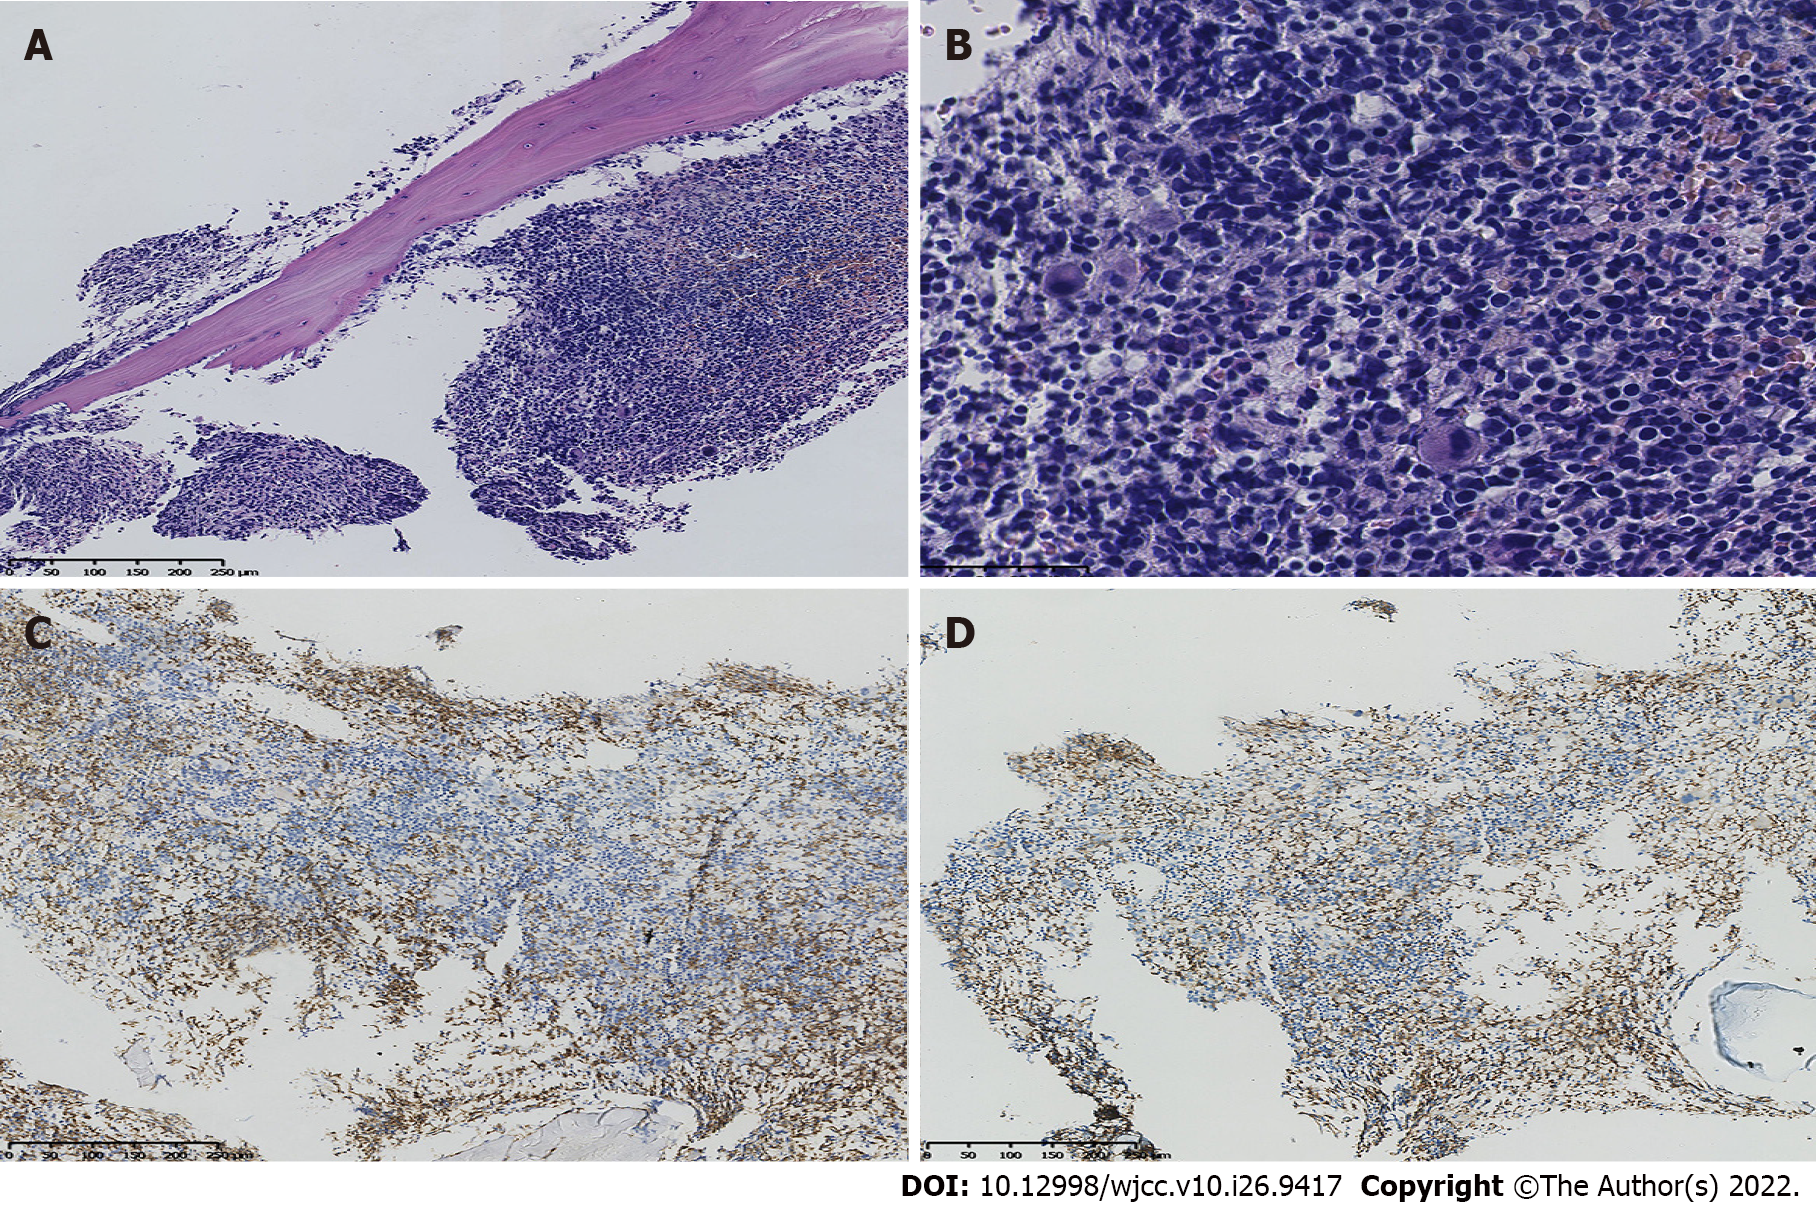
Figure 5 Pathology and immunochemistry of bone marrow.
A: Histopathological examination by haematoxylin and eosin staining (100 ×); B: Histopathological examination by haematoxylin and eosin staining (400×) shows nucleated cells actively proliferating and replacing most of the adipose tissue, with more red blood cells than granulocytes and 2–4 megakaryocytes/hpf. The pathology showed that the bone marrow was nucleated and cell proliferation was active; C: Immunochemical staining shows CD3 positivity; D: Immunochemical staining shows CD7 positivity. H&E, haematoxylin and eosin; HPF, high power field.
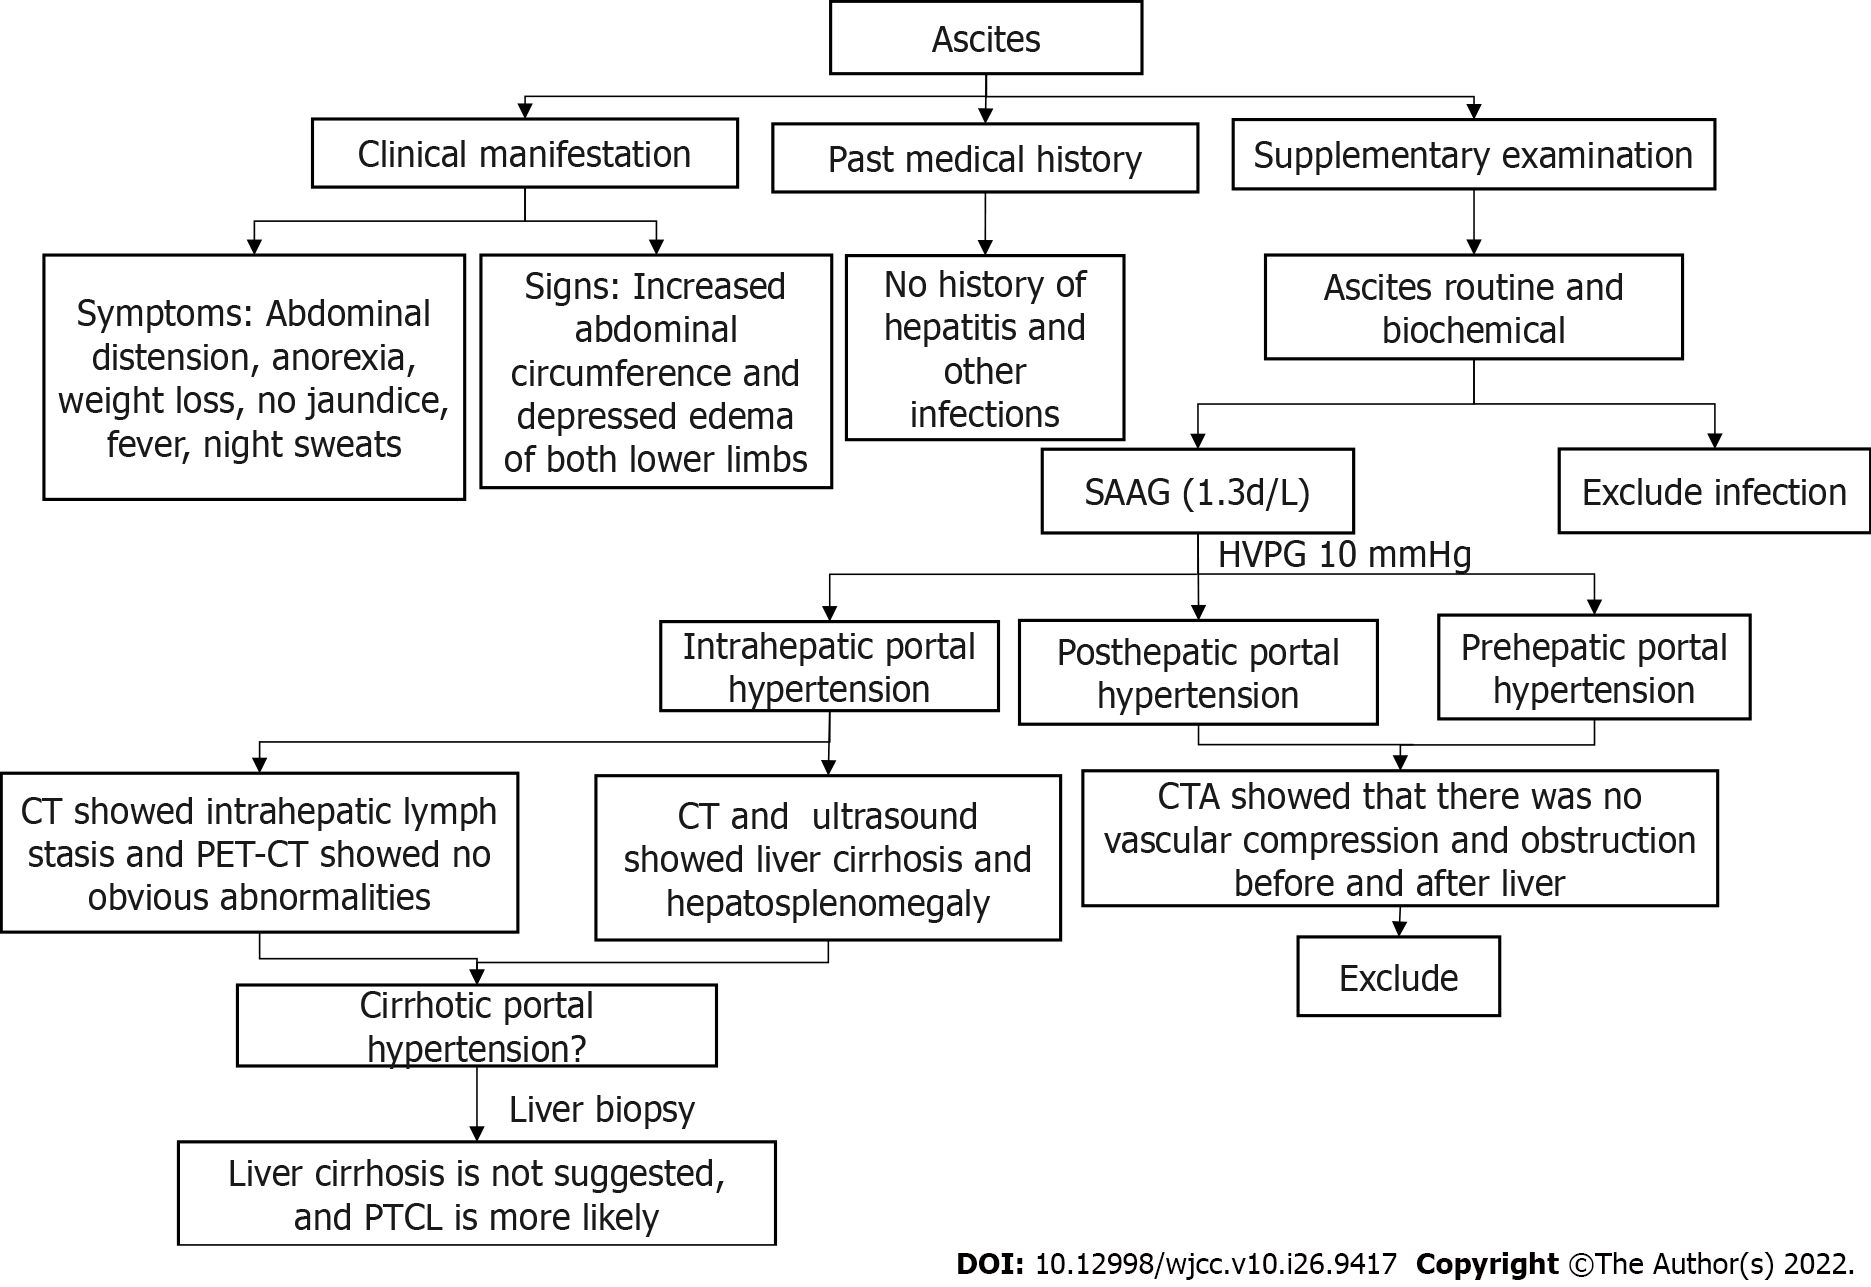
Figure 6 Diagnosis flow charts.
PTCL: Peripheral T-cell lymphoma; CT: Computed tomography; CTA: Computed tomography angiography; SAAG: Serum-ascites albumin gradient; PET-CT: Positron emission tomography-CT.
- Citation: Wu MM, Fu WJ, Wu J, Zhu LL, Niu T, Yang R, Yao J, Lu Q, Liao XY. Noncirrhotic portal hypertension due to peripheral T-cell lymphoma, not otherwise specified: A case report. World J Clin Cases 2022; 10(26): 9417-9427
- URL: https://www.wjgnet.com/2307-8960/full/v10/i26/9417.htm
- DOI: https://dx.doi.org/10.12998/wjcc.v10.i26.9417


