Copyright
©The Author(s) 2022.
World J Clin Cases. Sep 16, 2022; 10(26): 9361-9367
Published online Sep 16, 2022. doi: 10.12998/wjcc.v10.i26.9361
Published online Sep 16, 2022. doi: 10.12998/wjcc.v10.i26.9361
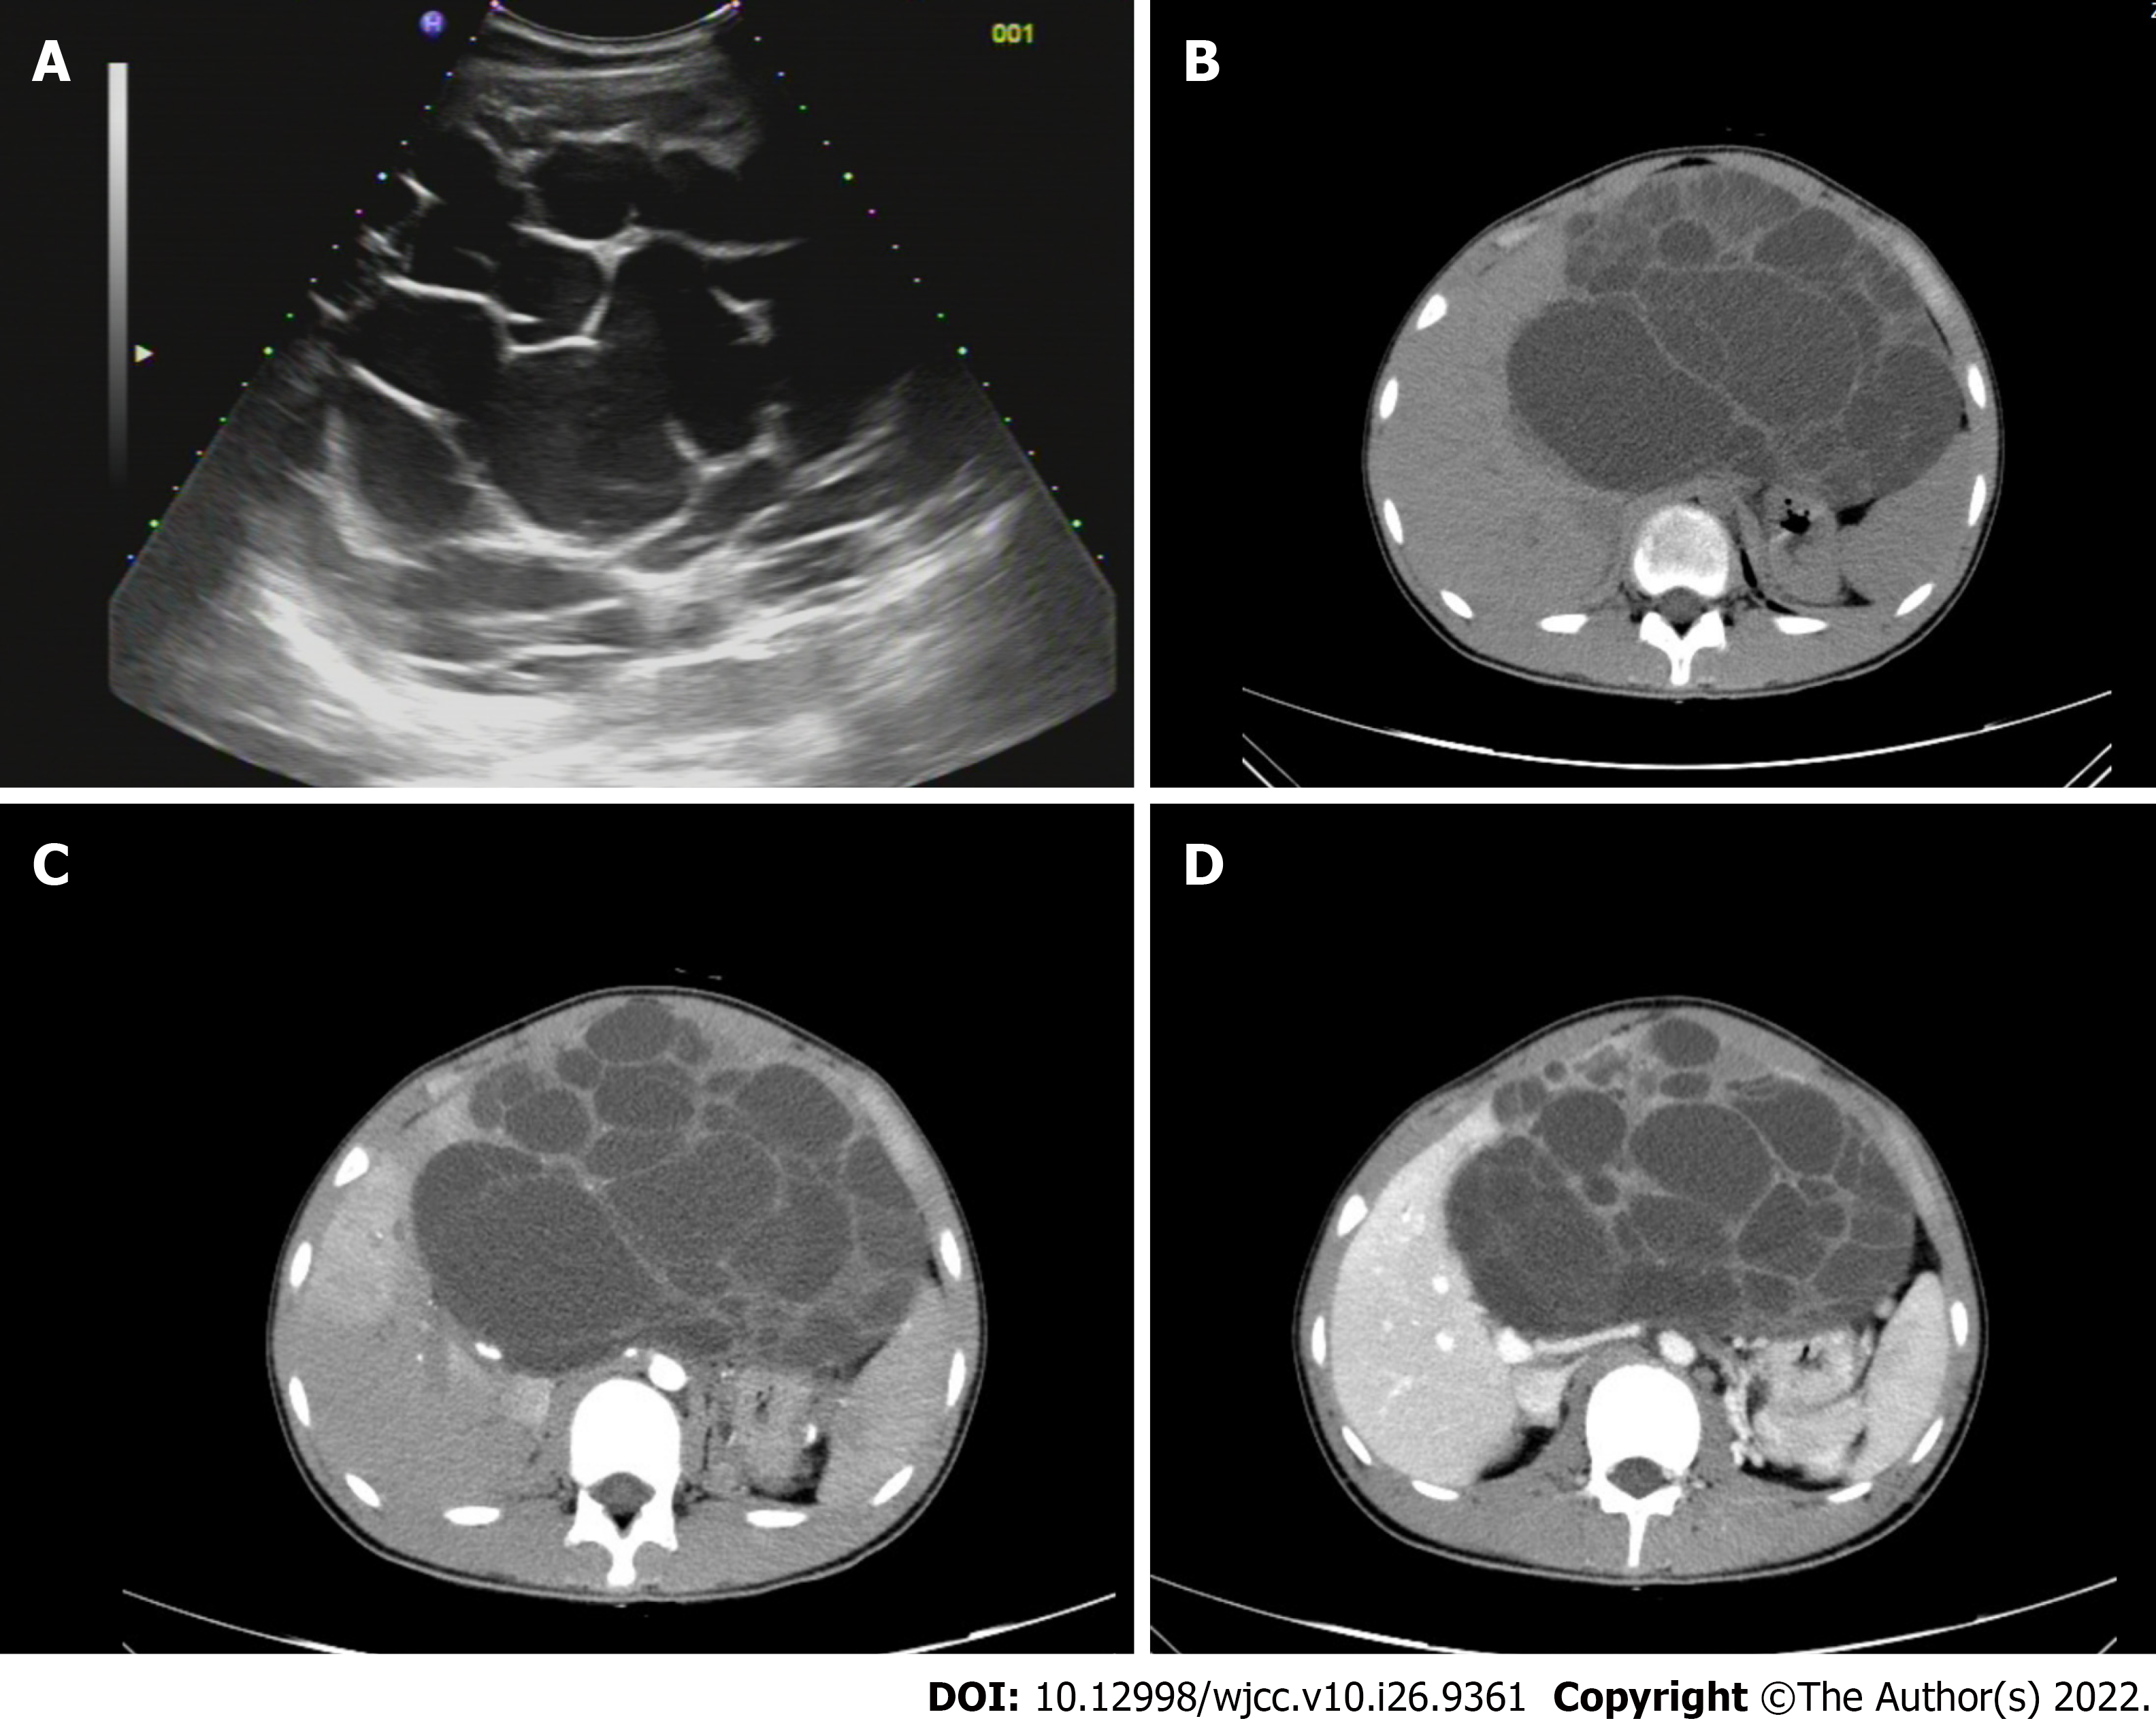
Figure 1 Computed tomography imaging.
A: Liver ultrasound; B: Computed tomography (CT) plain scan; C: The arterial phase of enhanced CT scans; and D: The portal phase of enhanced CT scans.
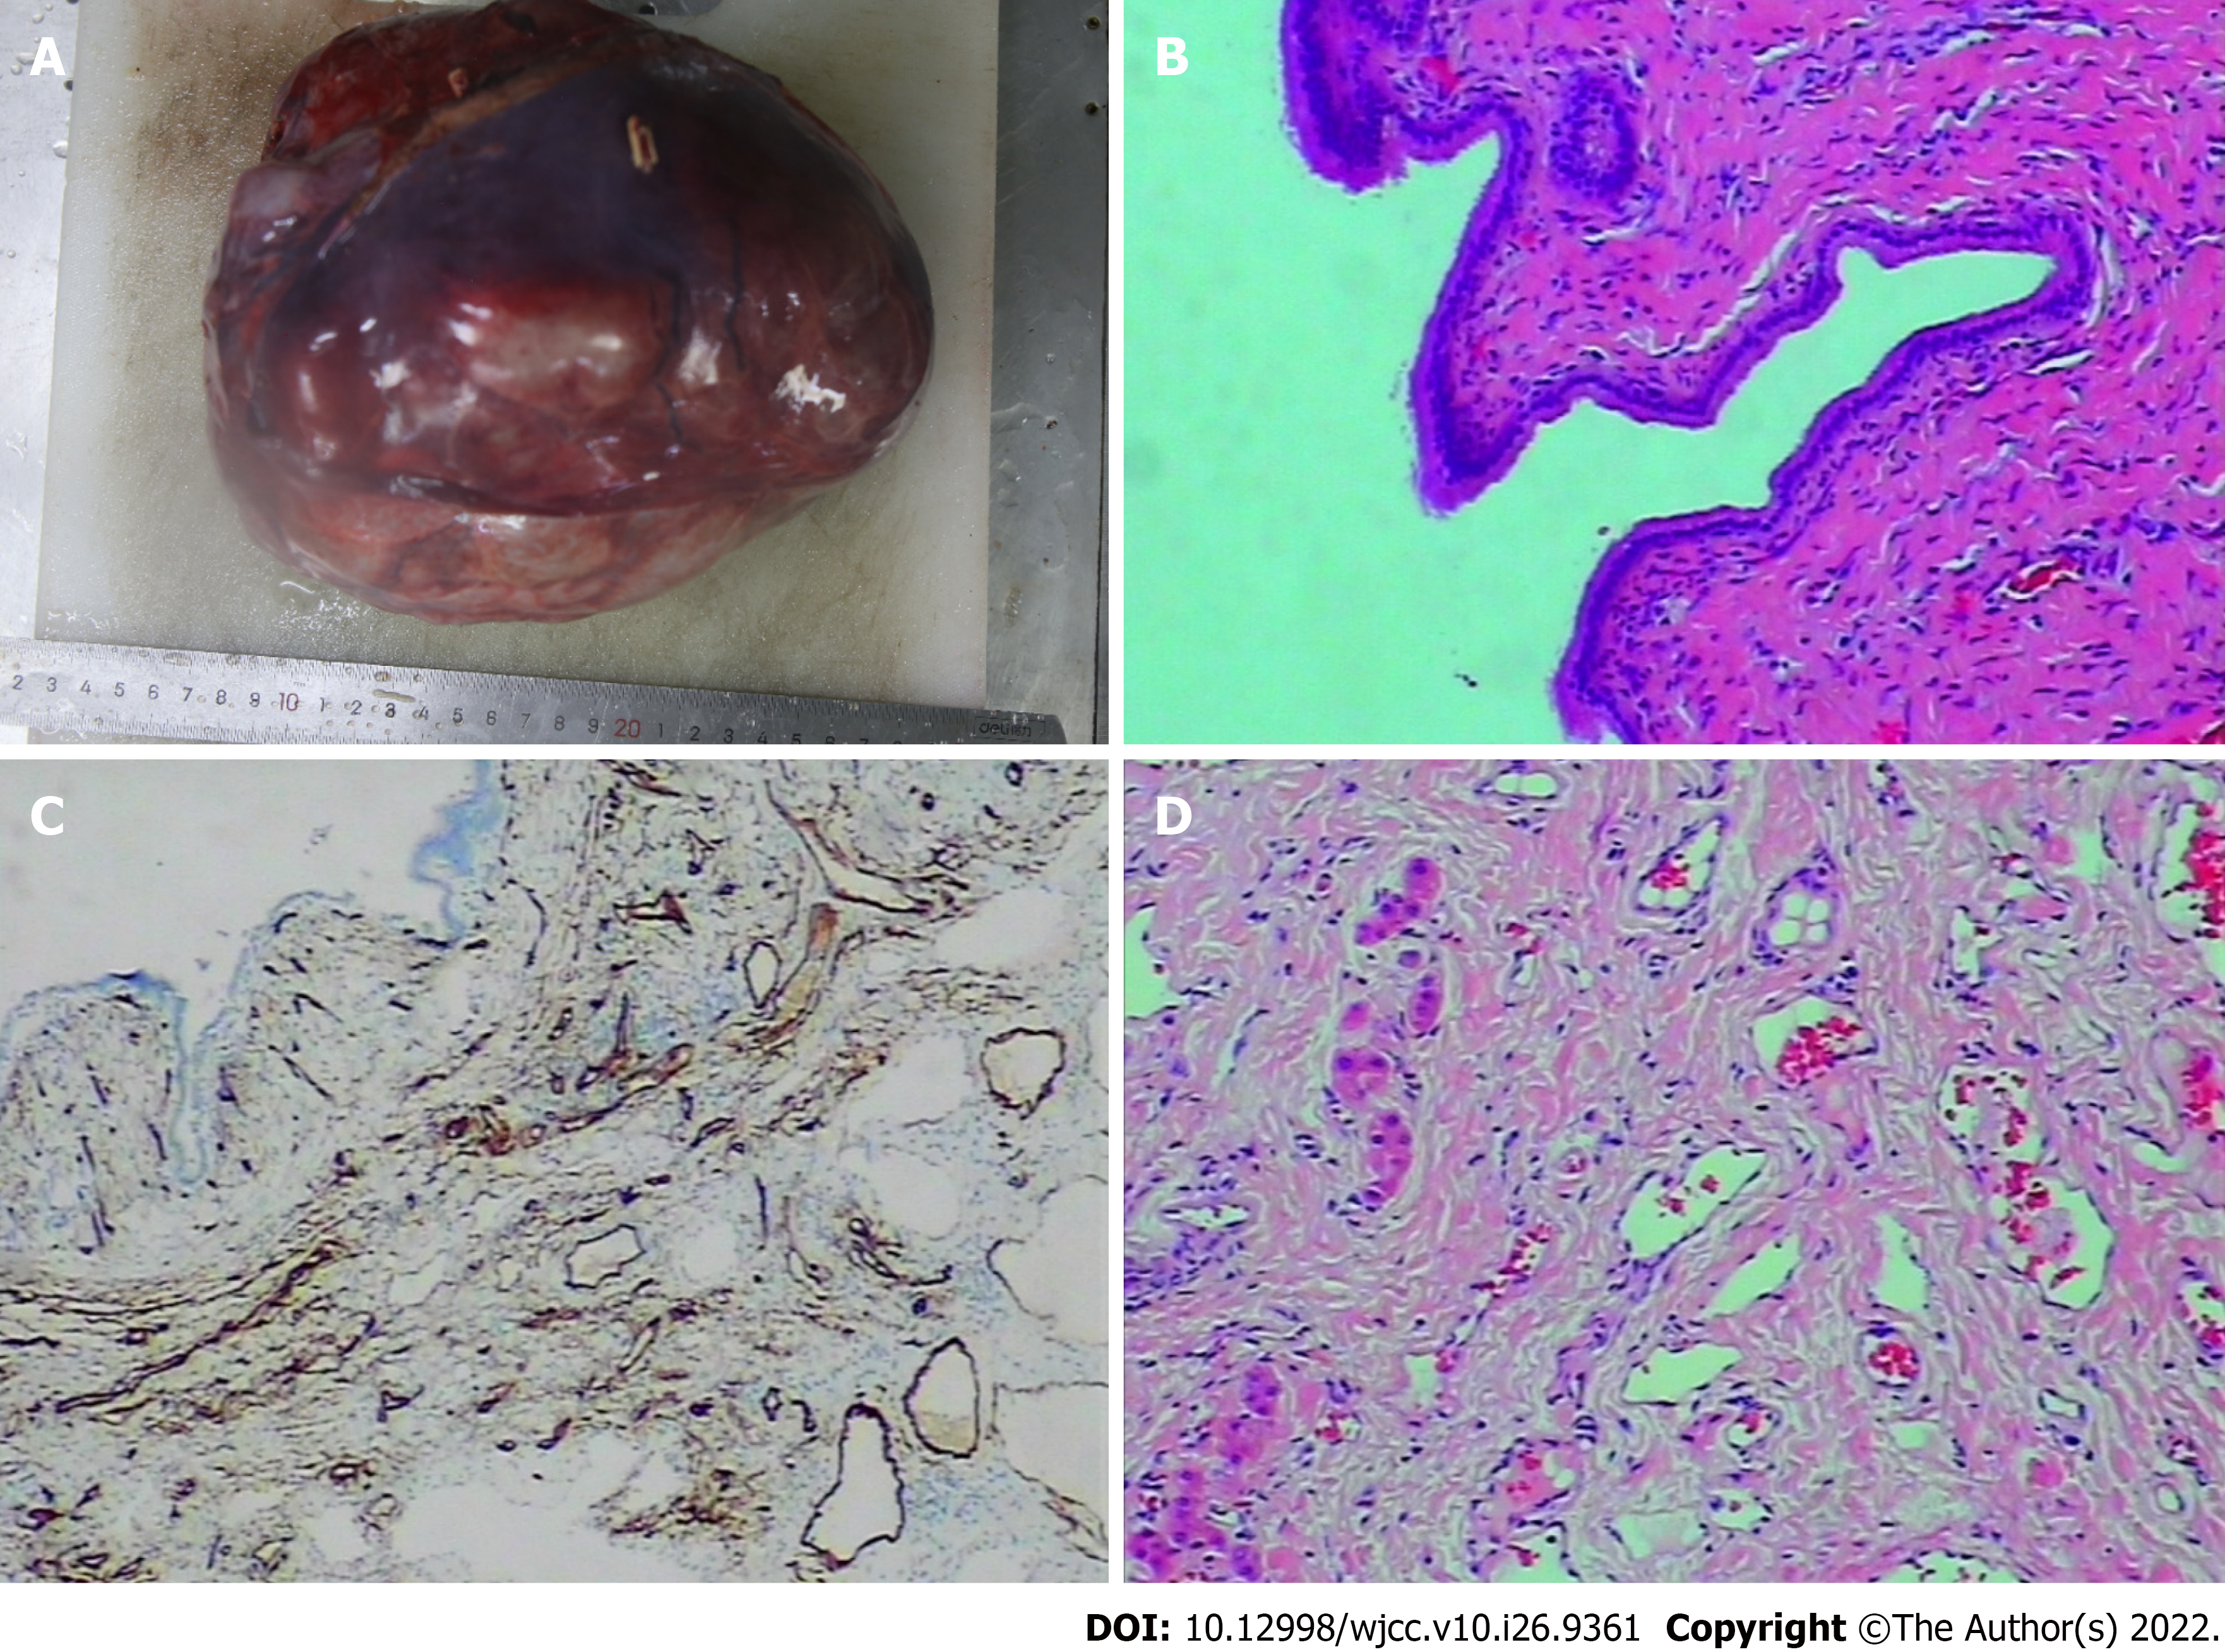
Figure 2 Paraffin section analysis and immunohistochemical analysis.
A: Gross specimen of liver tumor (21 cm × 19 cm × 12 cm); B: Microscopic image of the liver tumor; C: Immunohistochemical staining of the cyst gland duct epithelium (CK+); and D: Immunohistochemical vascular staining (CD34+).
Figure 3 Postoperative imaging.
A: Computed tomography (CT) plain scan after surgery; B: The arterial phase of enhanced CT scan after surgery; and C: The portal phase of enhanced CT scan after surgery.
- Citation: Wang CY, Shi FY, Huang WF, Tang Y, Li T, He GL. Intrahepatic multicystic biliary hamartoma: A case report. World J Clin Cases 2022; 10(26): 9361-9367
- URL: https://www.wjgnet.com/2307-8960/full/v10/i26/9361.htm
- DOI: https://dx.doi.org/10.12998/wjcc.v10.i26.9361


