Copyright
©The Author(s) 2022.
World J Clin Cases. Aug 26, 2022; 10(24): 8709-8717
Published online Aug 26, 2022. doi: 10.12998/wjcc.v10.i24.8709
Published online Aug 26, 2022. doi: 10.12998/wjcc.v10.i24.8709
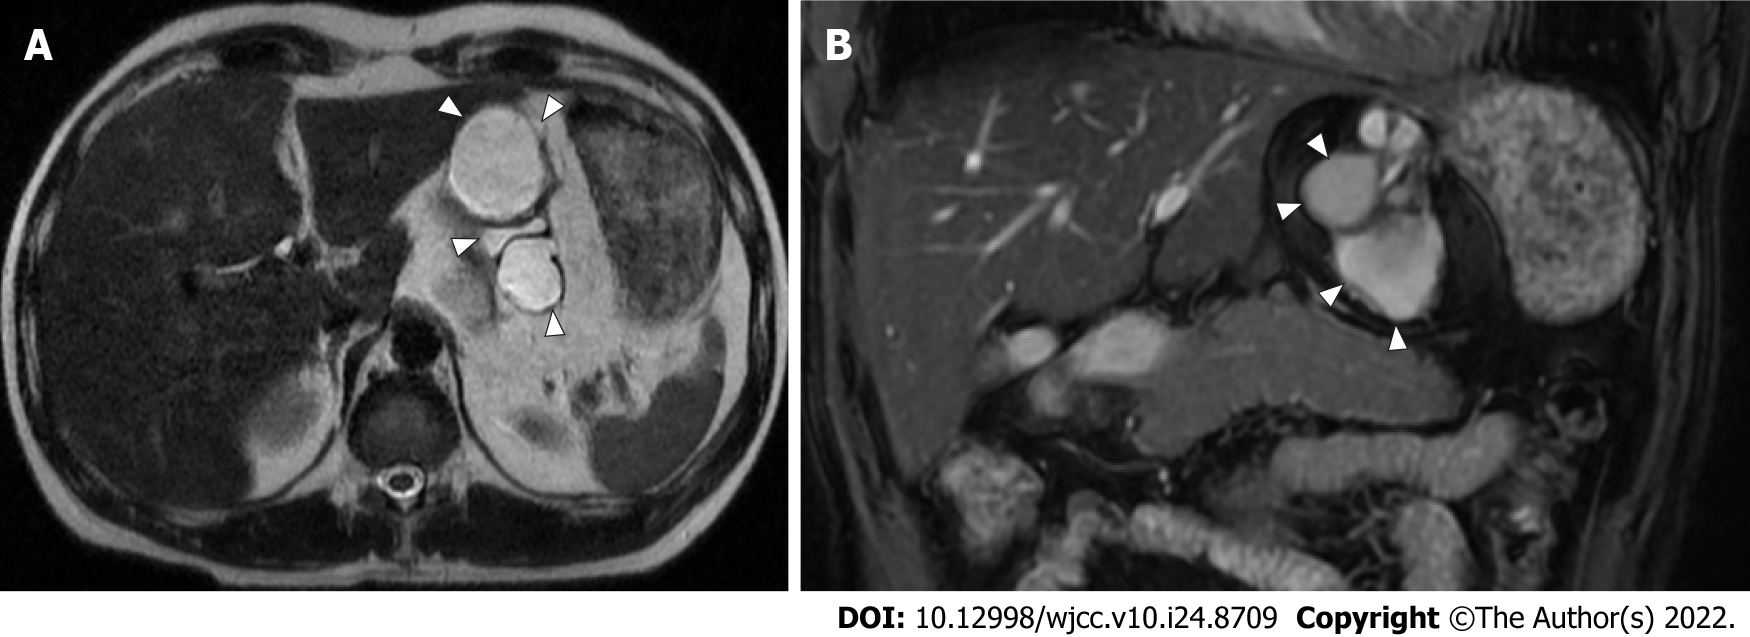
Figure 1 Abdominal magnetic resonance imaging findings in 2007.
Axial and coronal views of magnetic resonance imaging T2-weighted images show a multifocal, cystic mass with a diameter of 8 cm between the stomach and left lateral lobe of the liver. The white arrowhead indicates the mass. A: Axial view; B: Coronal view.
Figure 2 Abdominal contrast-enhanced computed tomography and endoscopic findings in 2020.
A and B: Coronal view of abdominal contrast-enhanced computed tomography shows that the size of the mass has increased to 15 cm (white arrowhead). Part of the wall of the mass shows thickness and contains calcification, but no obvious intracystic nodules are seen. Stomach and pancreas were compressed (orange arrows); C: Esophagogastroduodenoscopy shows that the lesser curvature of the stomach is compressed by the mass (white arrowhead).
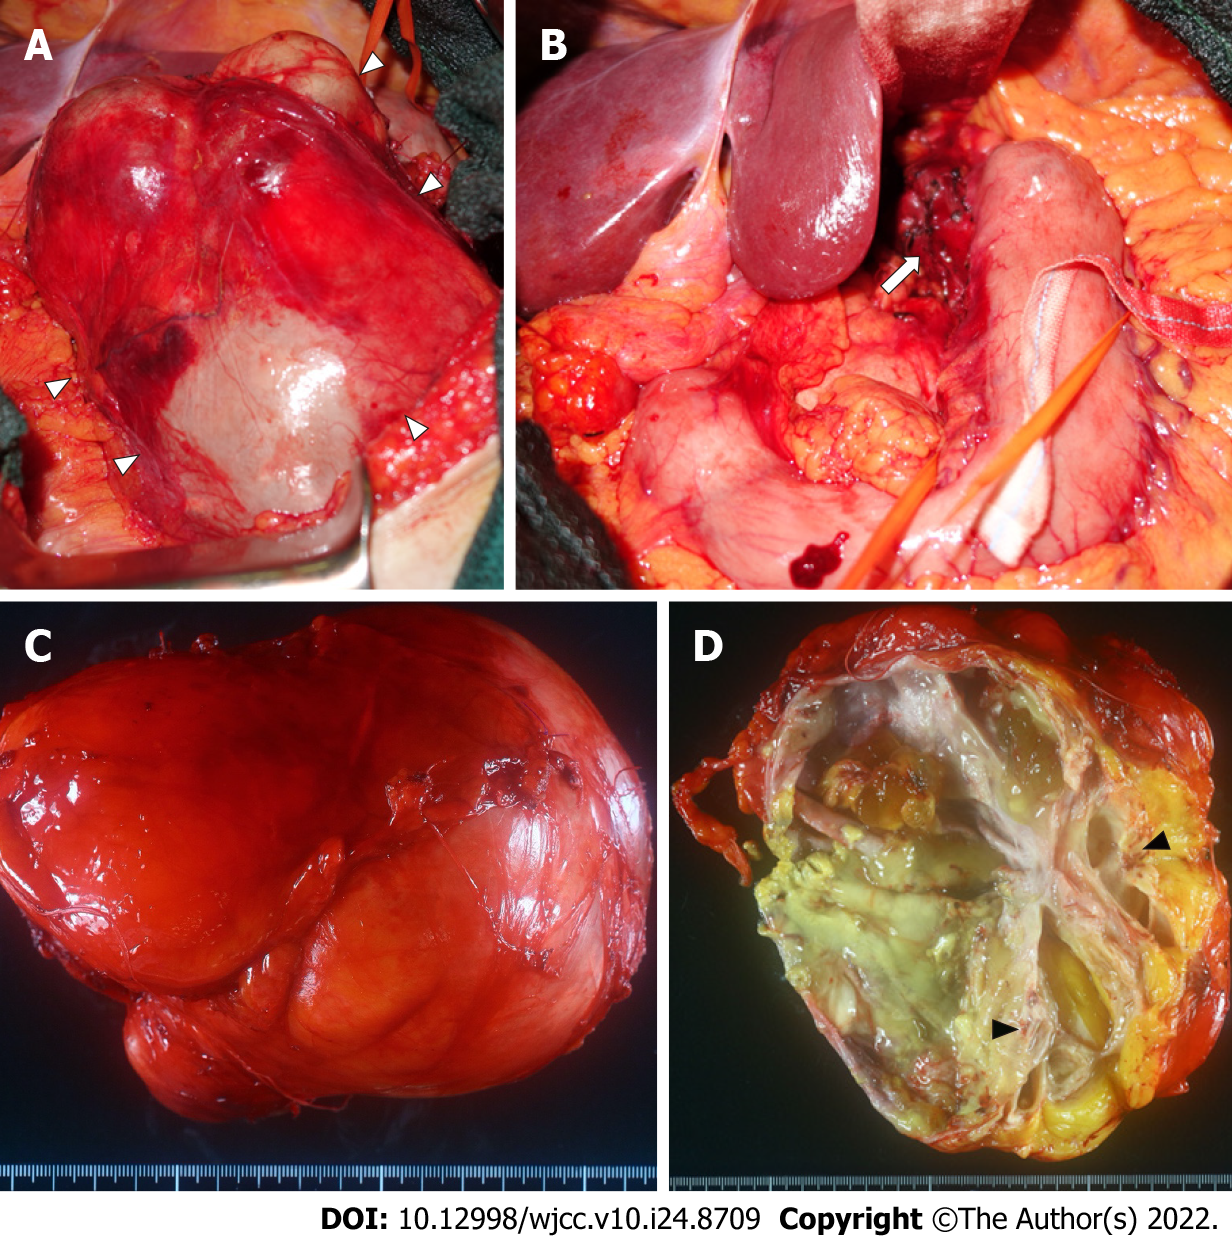
Figure 3 Intraoperative findings and macroscopic findings of the resected specimen.
A: A smooth surfaced mass (white arrowhead) is exposed after resection of the lesser omentum; B: The mass is resected with a part of the seromuscular layer of the lessor curvature of the stomach (white arrow) and removed; C: The resected specimen is a multifocal mass filled with viscous mucus, 15 cm × 12 cm × 12 cm in size and weighing 1240 g; D: Cartilage-like tissue (black arrowhead) is observed in part of the cystic wall.
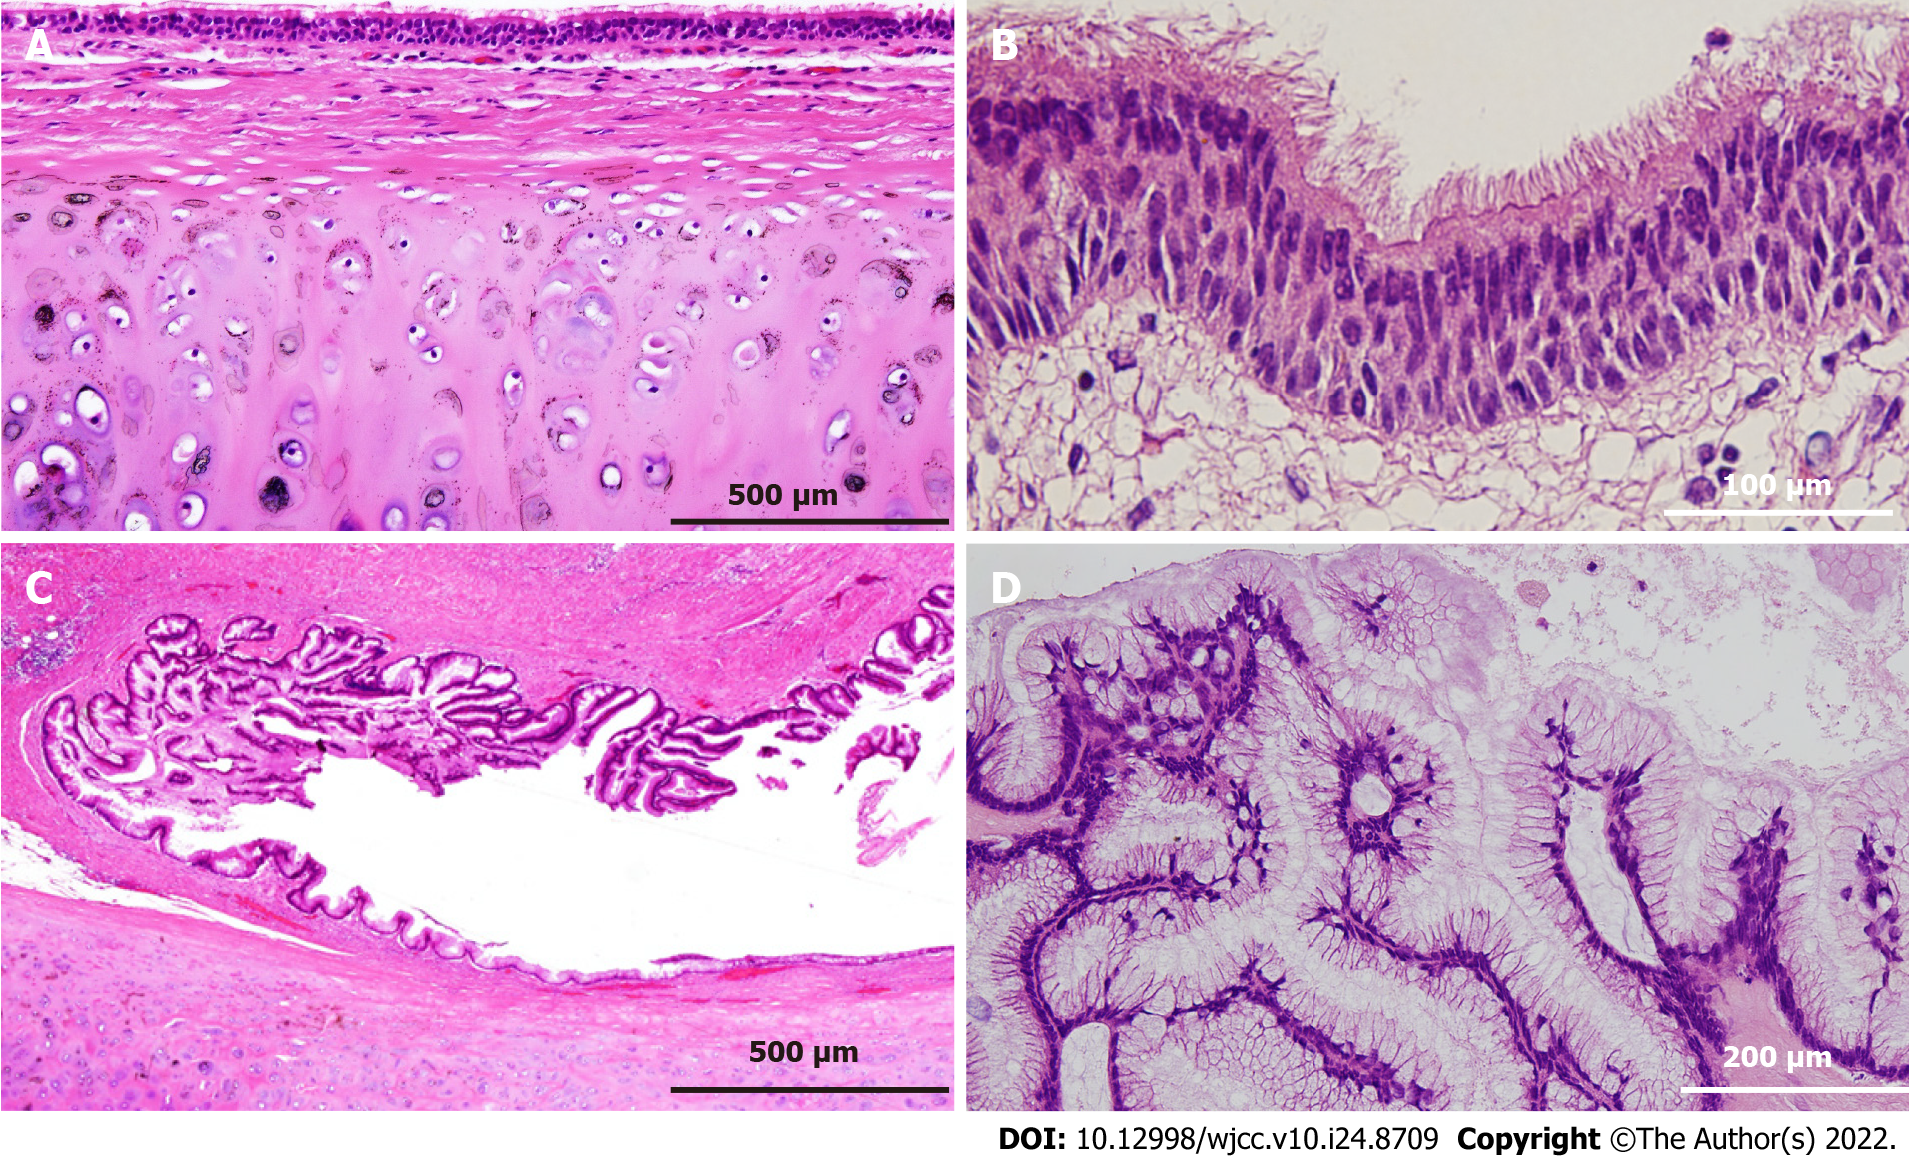
Figure 4 Histological findings of the resected specimen.
A and B: The majority of the cystic wall is lined by ciliated columnar epithelium, and bronchial cartilage is observed in the deeper layer of the mucosa (A, × 100; B × 400); C and D: High columnar epithelium containing mucus in the cytoplasm is observed in part of the cystic epithelium, considered to be a low-grade mucinous neoplasm (C, × 100; D × 200).
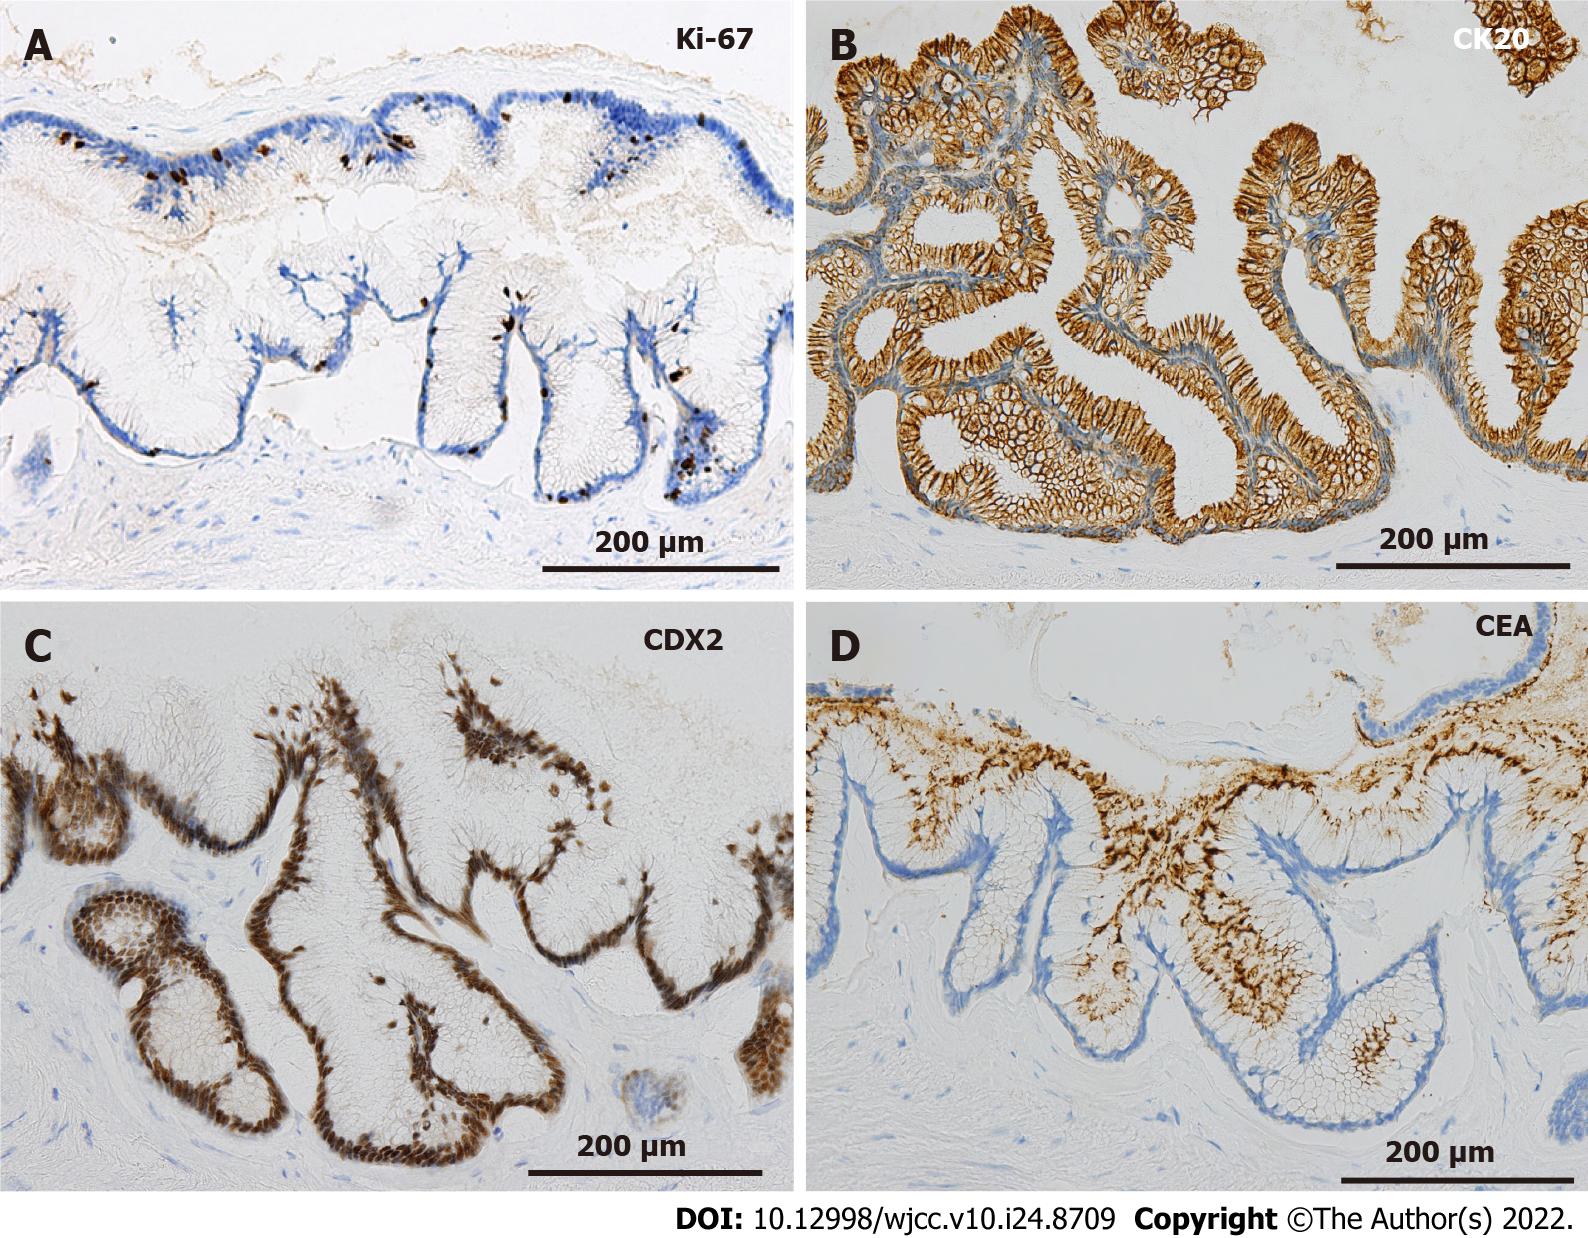
Figure 5 Immunohistochemical staining at the site of the low-grade mucinous neoplasm.
A: The MIB-1 index is 5% at the site of the low-grade mucinous neoplasm (× 200); B-D: The area with the low-grade mucinous neoplasm is positive for CK20, CDX2, and carcinoembryonic antigen (× 200).
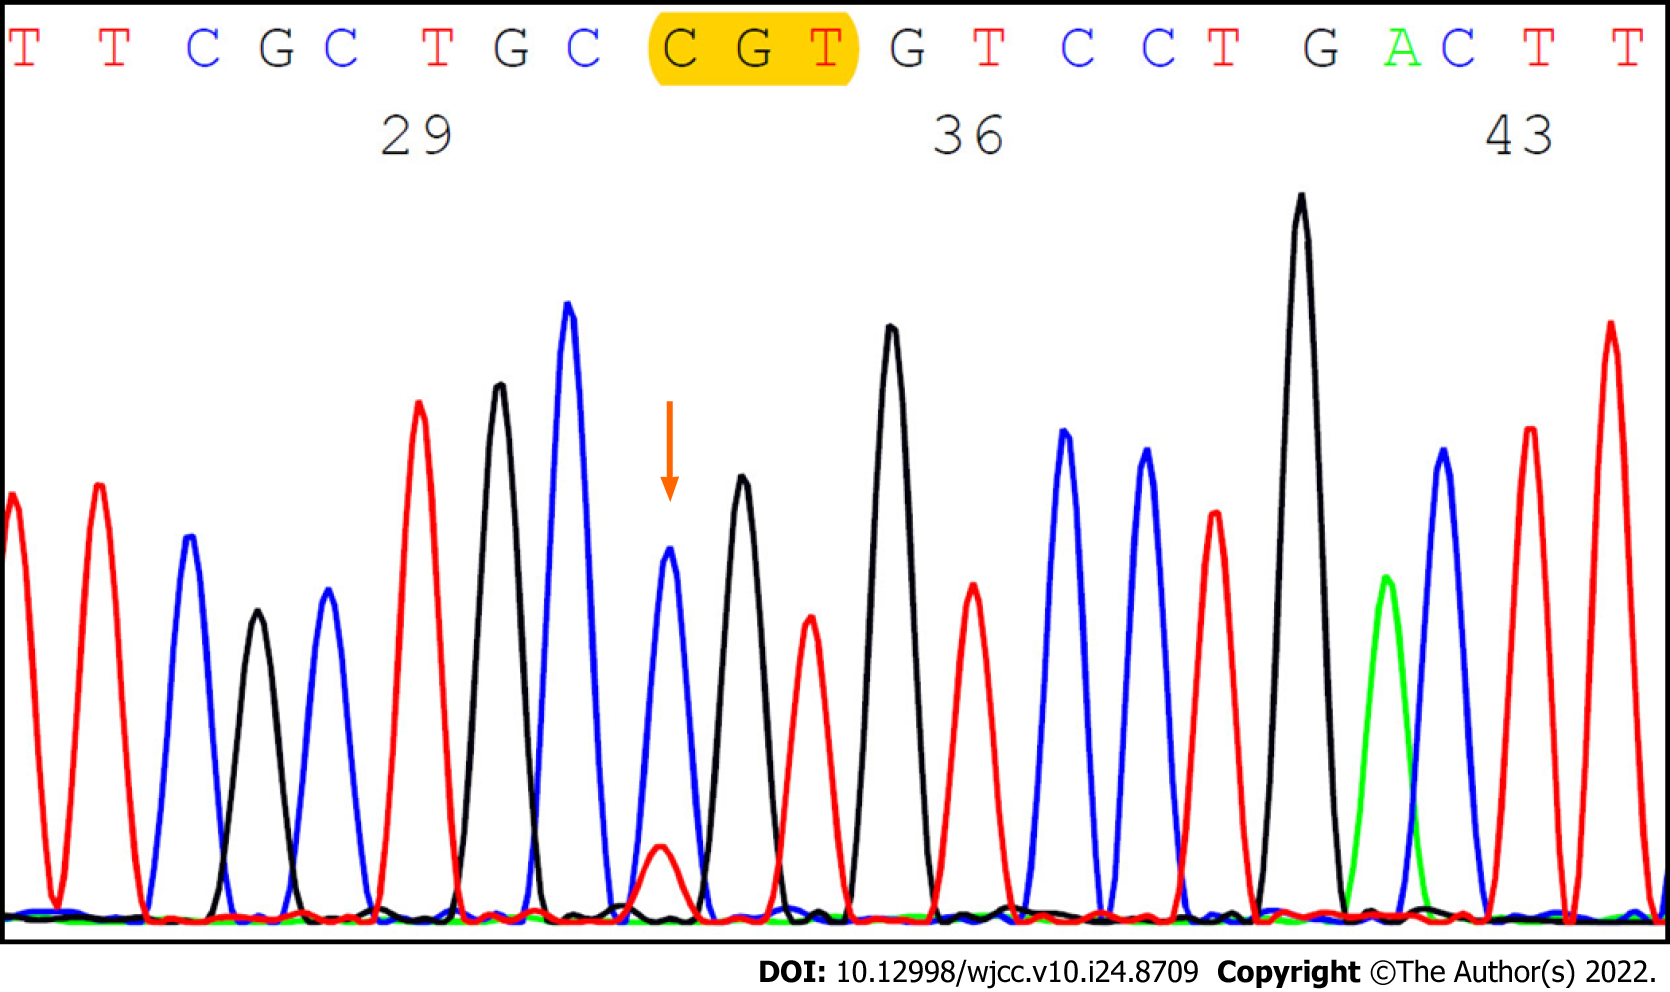
Figure 6 GNAS expression analysis by the Sanger method.
The Sanger method shows a missense alteration on codon 201 (p.R201C) in the lesion with the low-grade mucinous neoplasm.
- Citation: Murakami T, Shimizu H, Yamazaki K, Nojima H, Usui A, Kosugi C, Shuto K, Obi S, Sato T, Yamazaki M, Koda K. Intra-abdominal ectopic bronchogenic cyst with a mucinous neoplasm harboring a GNAS mutation: A case report. World J Clin Cases 2022; 10(24): 8709-8717
- URL: https://www.wjgnet.com/2307-8960/full/v10/i24/8709.htm
- DOI: https://dx.doi.org/10.12998/wjcc.v10.i24.8709


