Copyright
©The Author(s) 2022.
World J Clin Cases. Aug 26, 2022; 10(24): 8568-8577
Published online Aug 26, 2022. doi: 10.12998/wjcc.v10.i24.8568
Published online Aug 26, 2022. doi: 10.12998/wjcc.v10.i24.8568
Figure 1 A 42-year-old male with a history of chronic pancreatitis (patient 1).
A: A tortuous vascular shadow was observed in the upper esophagus and gastric fundus area on plain computed tomography (CT); B: The tortuous venous cluster was more evident on enhanced CT, and the longest diameter (red line) measured was 50 mm (perpendicular to the gastric wall, orange line); C: On gastroscopy, obvious tortuosity was observed in the inferior fundus veins (blue arrow); D: On gastroscopy, the blood vessels of the gastric body appeared as beaded, tumor-like bulges (G3, blue arrow).
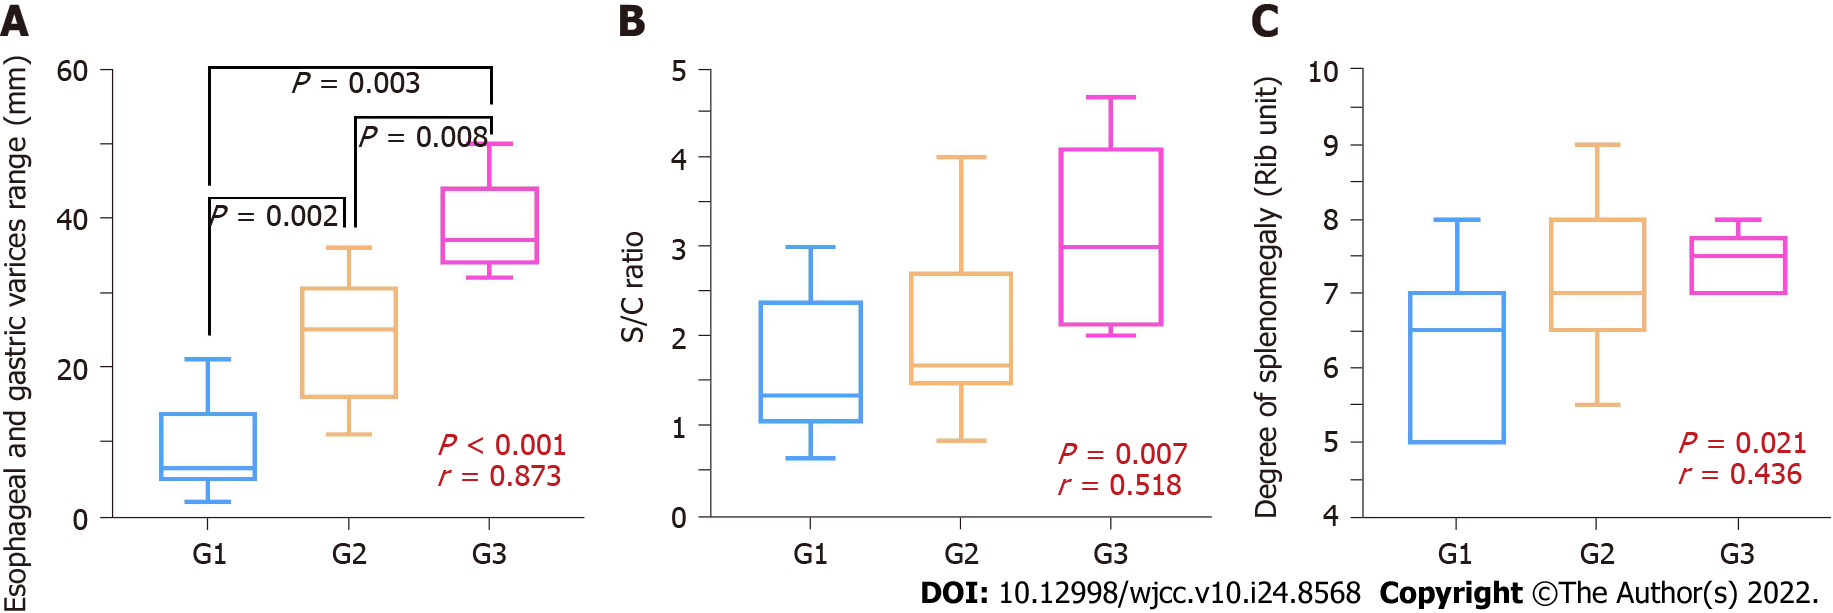
Figure 2 Box diagram of each parameter graded by gastroscopy.
A: Varicose vein range (mm); B: S/C ratio; C: Spleen size (number of rib units).
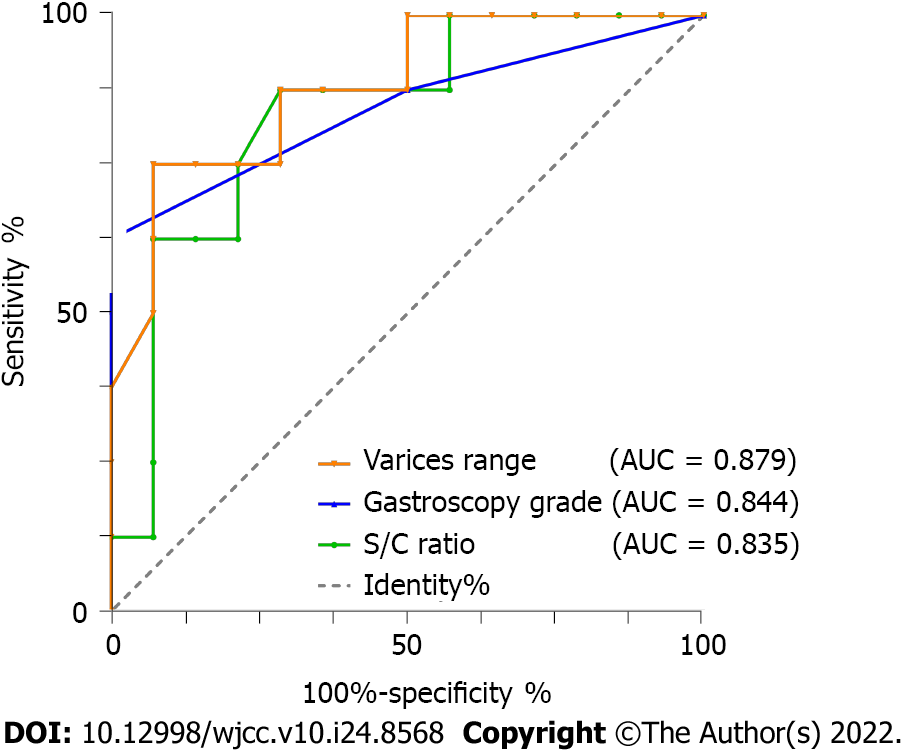
Figure 3 Receiver operating characteristic curves of computed tomography measurements and gastroscopy stage for predicting bleeding risk in patients with pancreatic segmental portal hypertension.
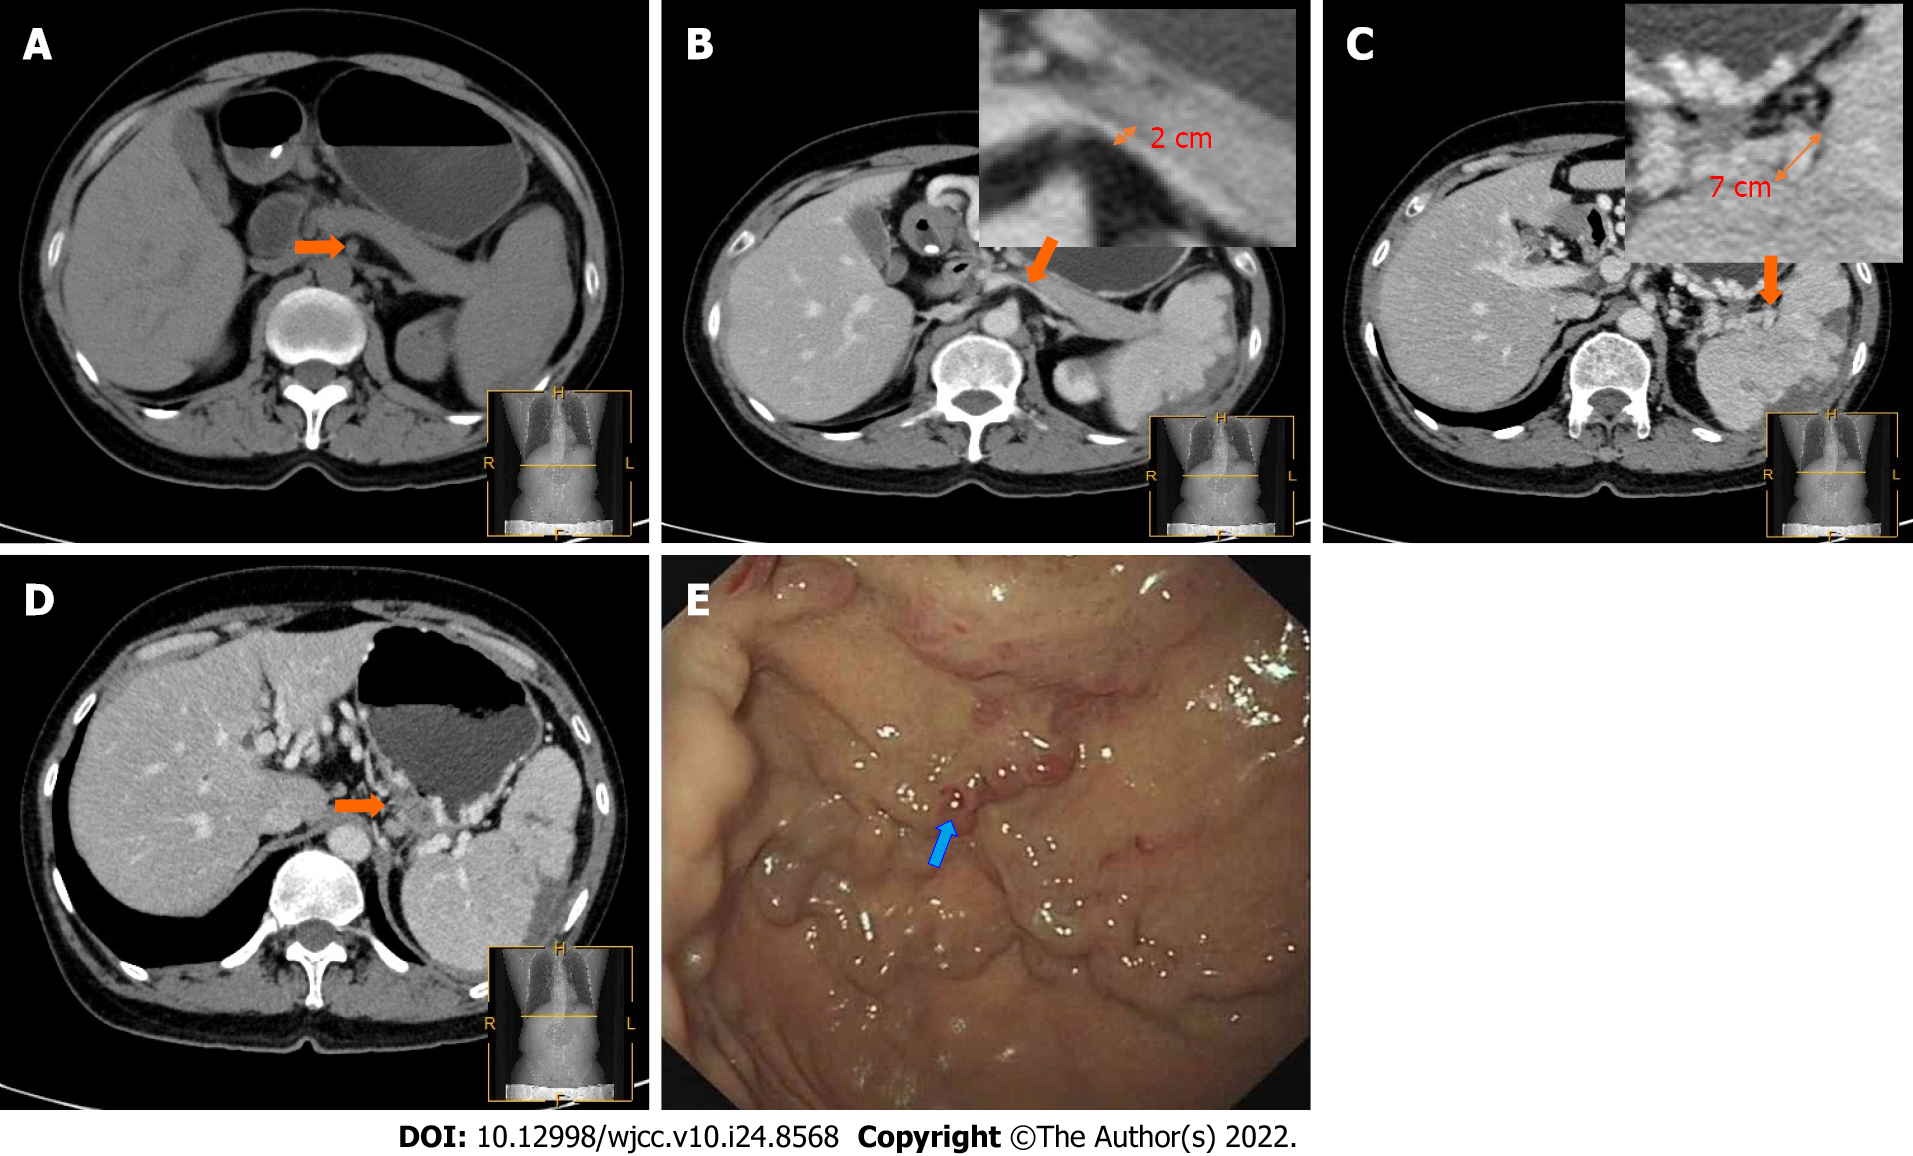
Figure 4 A 58-year-old man with a clinical history of IgG4-related hypophysitis (patient 2).
A: Signs of IgG4-related disease, including “sausage-like” changes (orange arrow), were observed in the pancreas on plain computed tomography (CT); B: Pancreatic compression causing splenic vein stenosis (orange arrow) was observed on enhanced CT; C: Splenic portal vein dilation was observed (orange arrow); D: Tortuous venous clusters (orange arrows) were observed on enhanced CT; E: On gastroscopy, tortuous "earthworm-like" blood vessels in the fundus of the stomach were observed, along with the "red sign" (blue arrow).
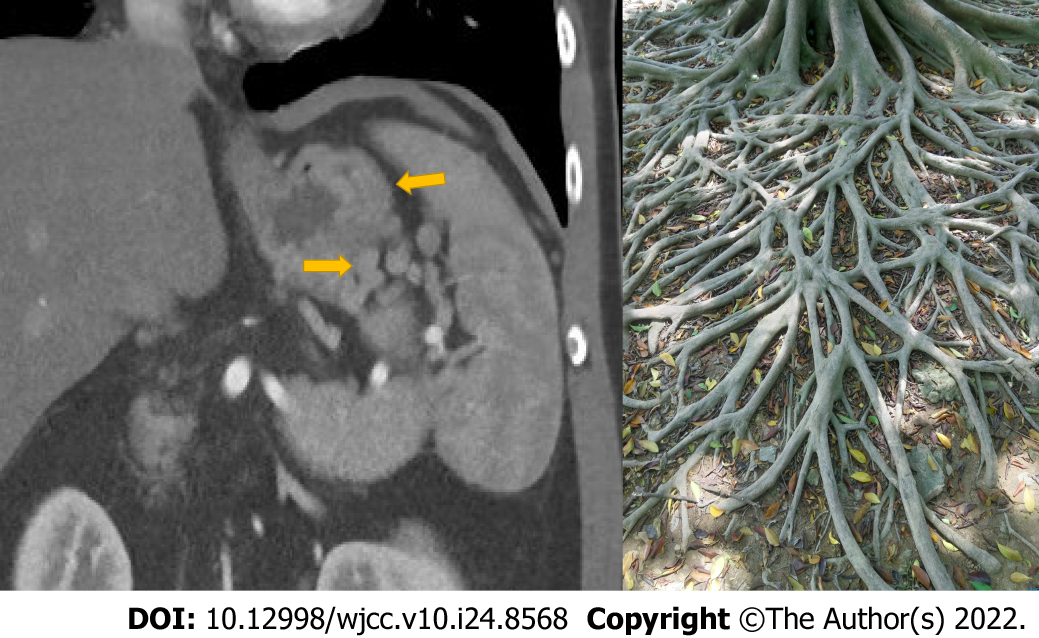
Figure 5 Grade 3 was determined based on a tortuous vascular shadow observed on gastroscopy; computed tomography showed “banyan tree root”-like changes (yellow arrow).
- Citation: Wang YL, Zhang HW, Lin F. Computed tomography combined with gastroscopy for assessment of pancreatic segmental portal hypertension. World J Clin Cases 2022; 10(24): 8568-8577
- URL: https://www.wjgnet.com/2307-8960/full/v10/i24/8568.htm
- DOI: https://dx.doi.org/10.12998/wjcc.v10.i24.8568


