Copyright
©The Author(s) 2022.
World J Clin Cases. Aug 26, 2022; 10(24): 8535-8546
Published online Aug 26, 2022. doi: 10.12998/wjcc.v10.i24.8535
Published online Aug 26, 2022. doi: 10.12998/wjcc.v10.i24.8535
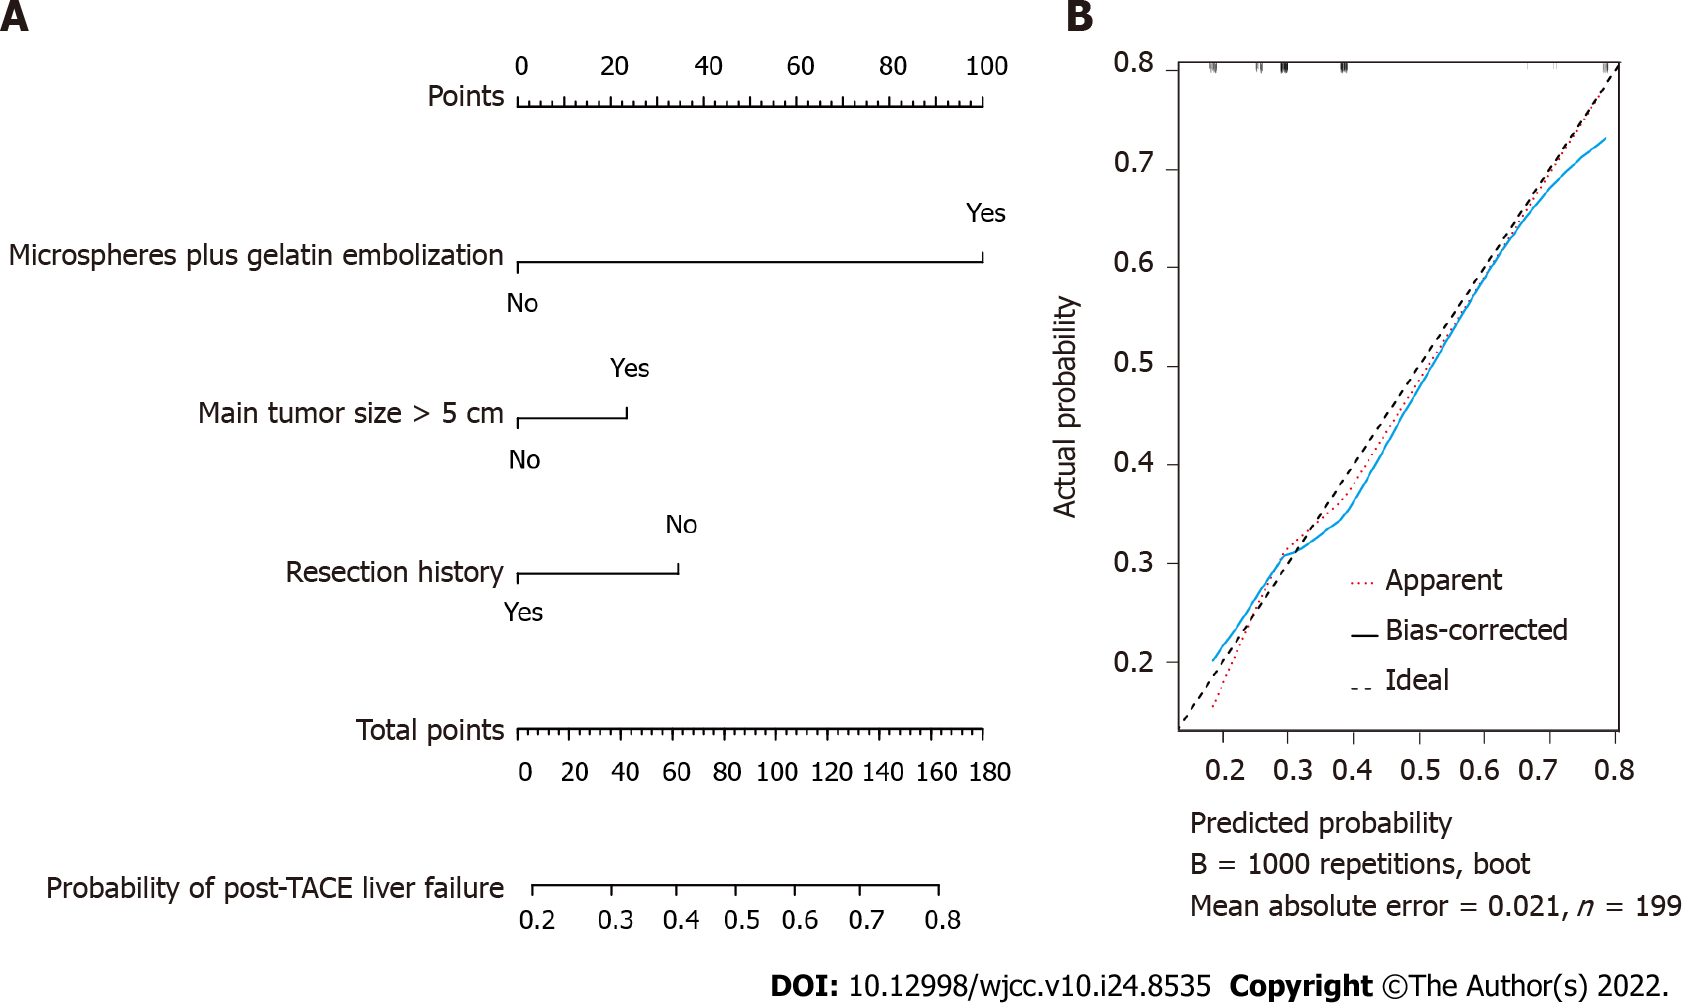
Figure 1 Nomogram for probability of post-transarterial chemoembolization liver failure in hepatocellular carcinoma patients.
A: The nomogram model; B: The calibration curve of the nomogram model with internal validation through bootstrapping. TACE: Transarterial chemoembolization.
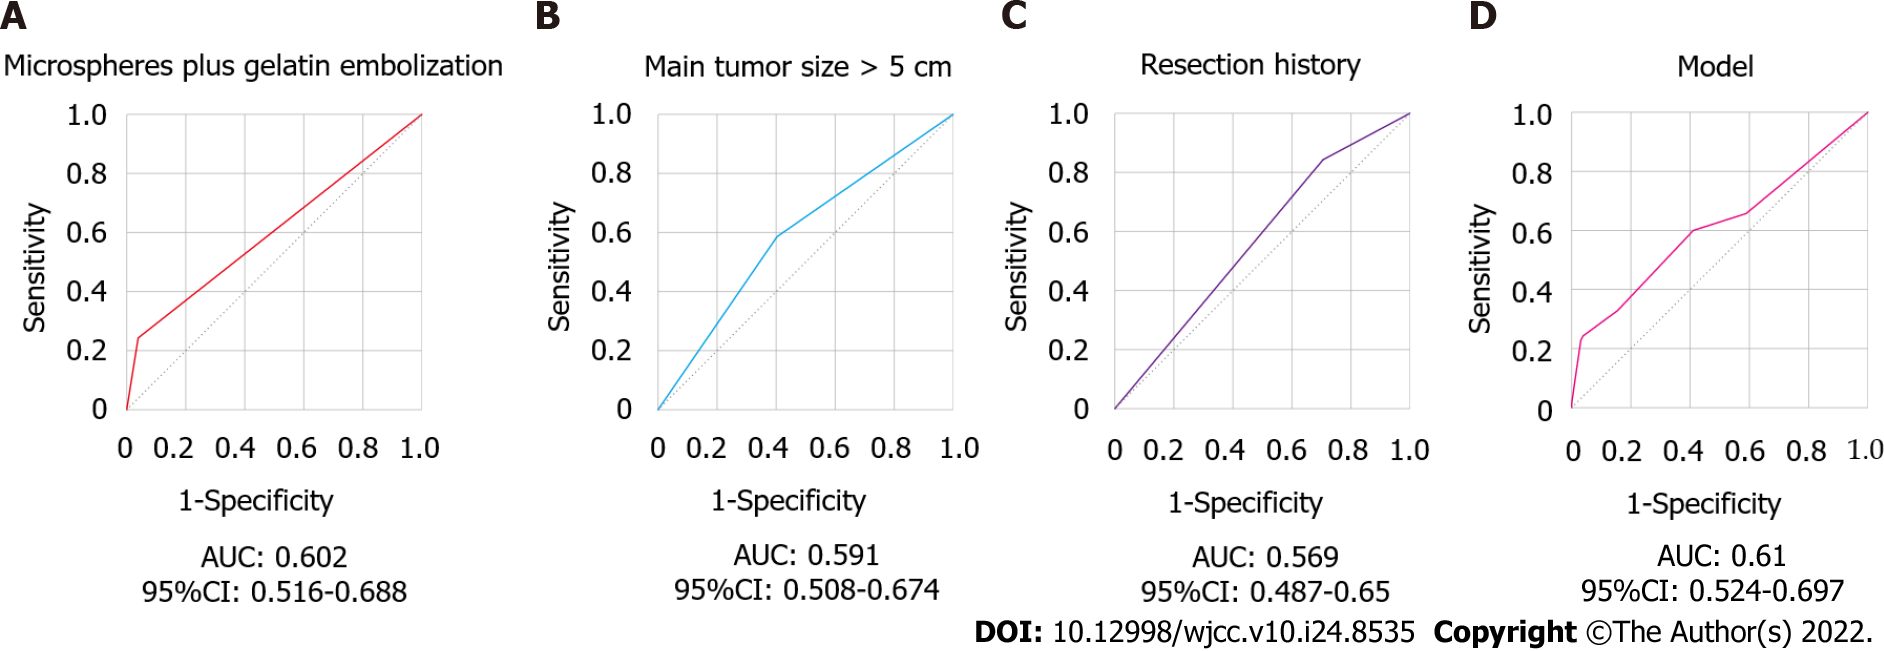
Figure 2 Receiver operating characteristic curves of predictors for post-transarterial chemoembolization liver failure.
A: Receiver operating characteristic (ROC) of microspheres plus gelatin embolization; B: ROC of main tumor size > 5 cm; C: ROC of resection history; D: ROC of the nomogram model. AUC: Area under the curve; CI: Confidence interval.
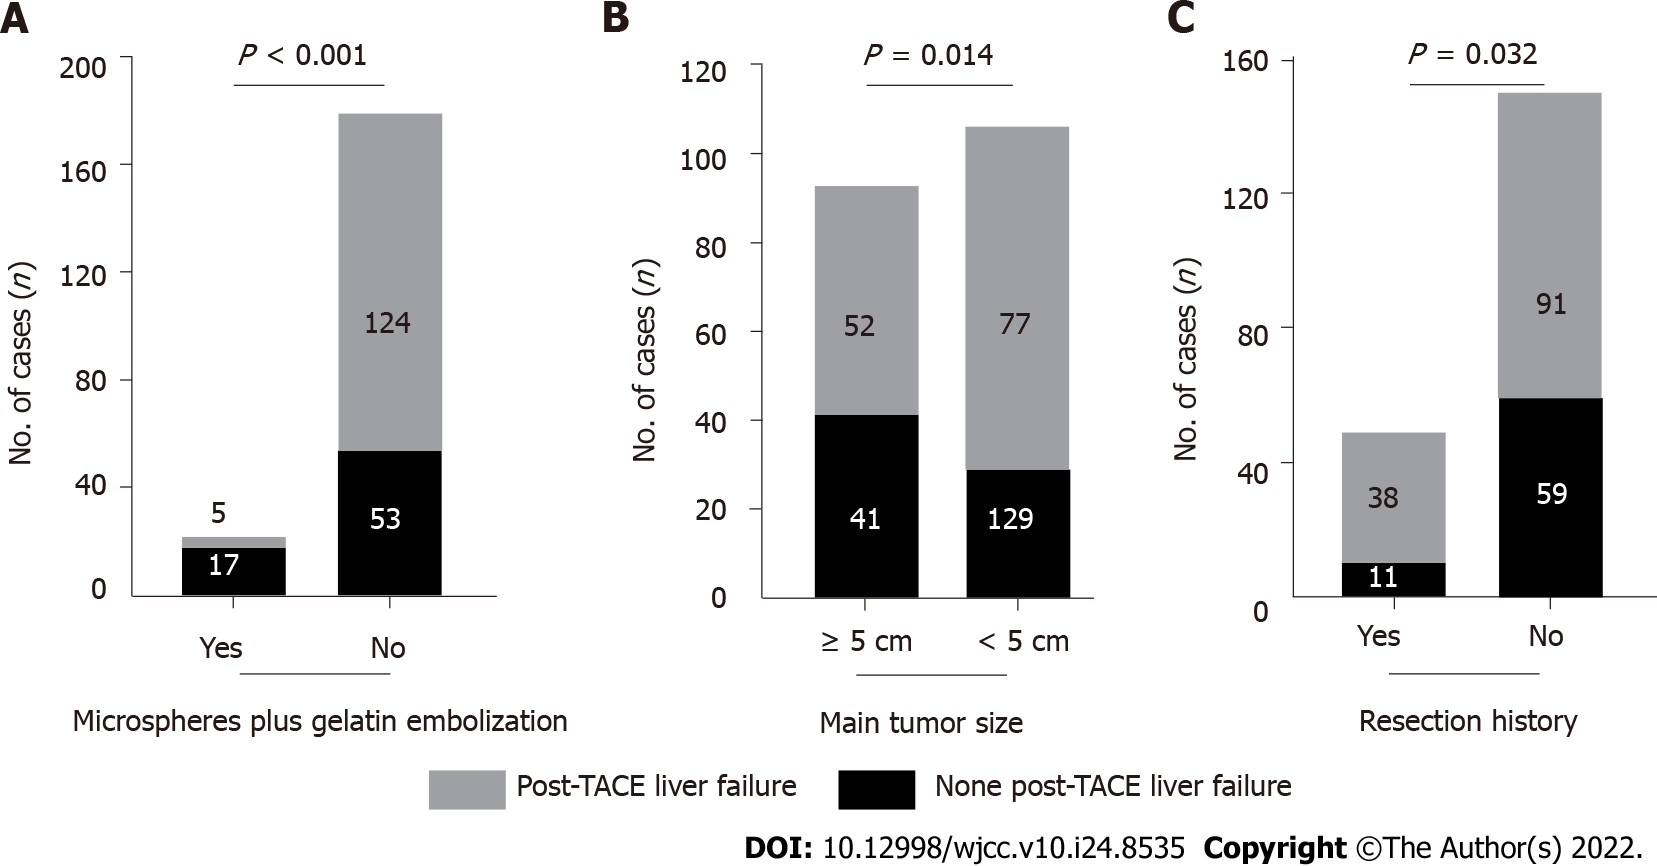
Figure 3 Frequency of post-transarterial chemoembolization liver failure.
A: Occurrence of post-transarterial chemoembolization (TACE) liver failure by microspheres plus gelatin embolization; B: Occurrence of post-TACE liver failure by main tumor size; C: Occurrence of post-TACE liver failure by resection history. TACE: Transarterial chemoembolization.
- Citation: Yuan M, Chen TY, Chen XR, Lu YF, Shi J, Zhang WS, Ye C, Tang BZ, Yang ZG. Identification of predictive factors for post-transarterial chemoembolization liver failure in hepatocellular carcinoma patients: A retrospective study. World J Clin Cases 2022; 10(24): 8535-8546
- URL: https://www.wjgnet.com/2307-8960/full/v10/i24/8535.htm
- DOI: https://dx.doi.org/10.12998/wjcc.v10.i24.8535


