Copyright
©The Author(s) 2022.
World J Clin Cases. Aug 26, 2022; 10(24): 8525-8534
Published online Aug 26, 2022. doi: 10.12998/wjcc.v10.i24.8525
Published online Aug 26, 2022. doi: 10.12998/wjcc.v10.i24.8525
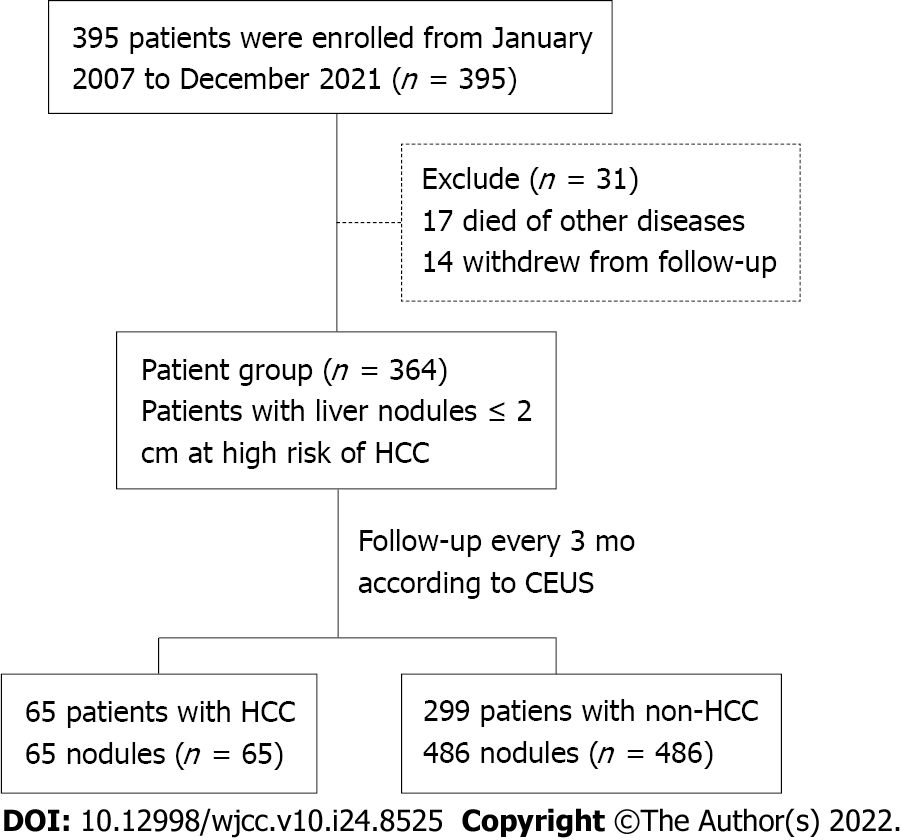
Figure 1 Study population flowchart.
HCC: Hepatocellular carcinoma; CEUS: Contrast-enhanced ultrasound.
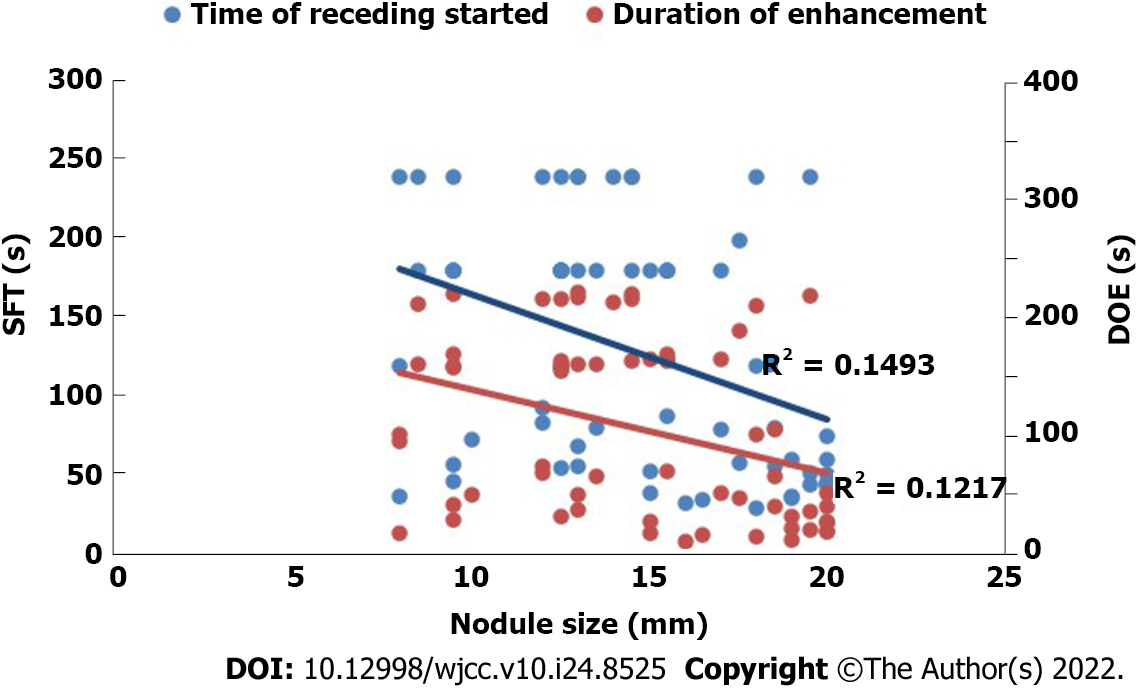
Figure 2 Correlation between hepatocellular carcinoma nodule size and start time of wash-out and duration of enhancement of contrast agent.
The blue line represents initial fading time, and the red line represents enhancement duration. Correlation coefficient: (r = –0.386) blue; (r = –0.349) red. SFT: Start time of wash-out; DOE: Duration of enhancement.
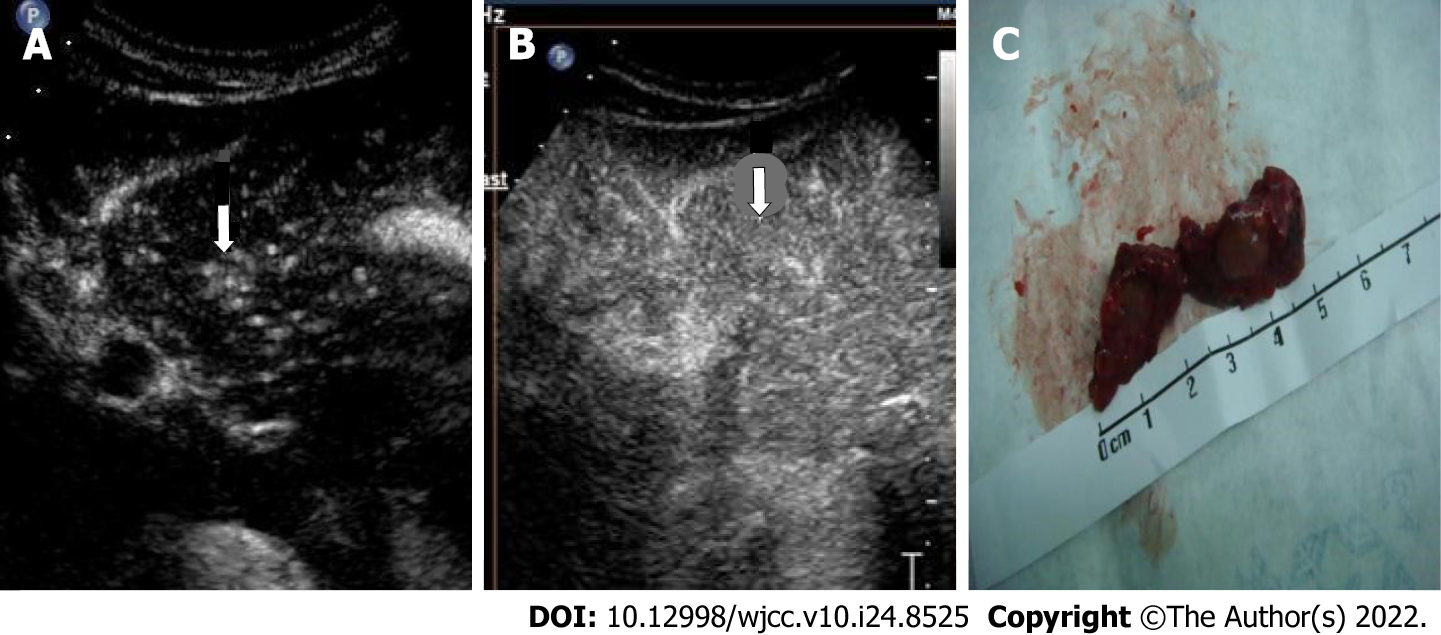
Figure 3 Representative images of contrast-enhanced ultrasound and pathological specimen from a 45-year-old woman.
A: A hyperechoic nodule (arrow) shown in the left lobe of the liver in the arterial phase (19 s); B: The same nodule (arrow) was visualized in the delayed phase (125 s); C: The pathological specimen after surgery resection displayed a tumor about 10 mm in diameter. Enhancement during time: 160 s.
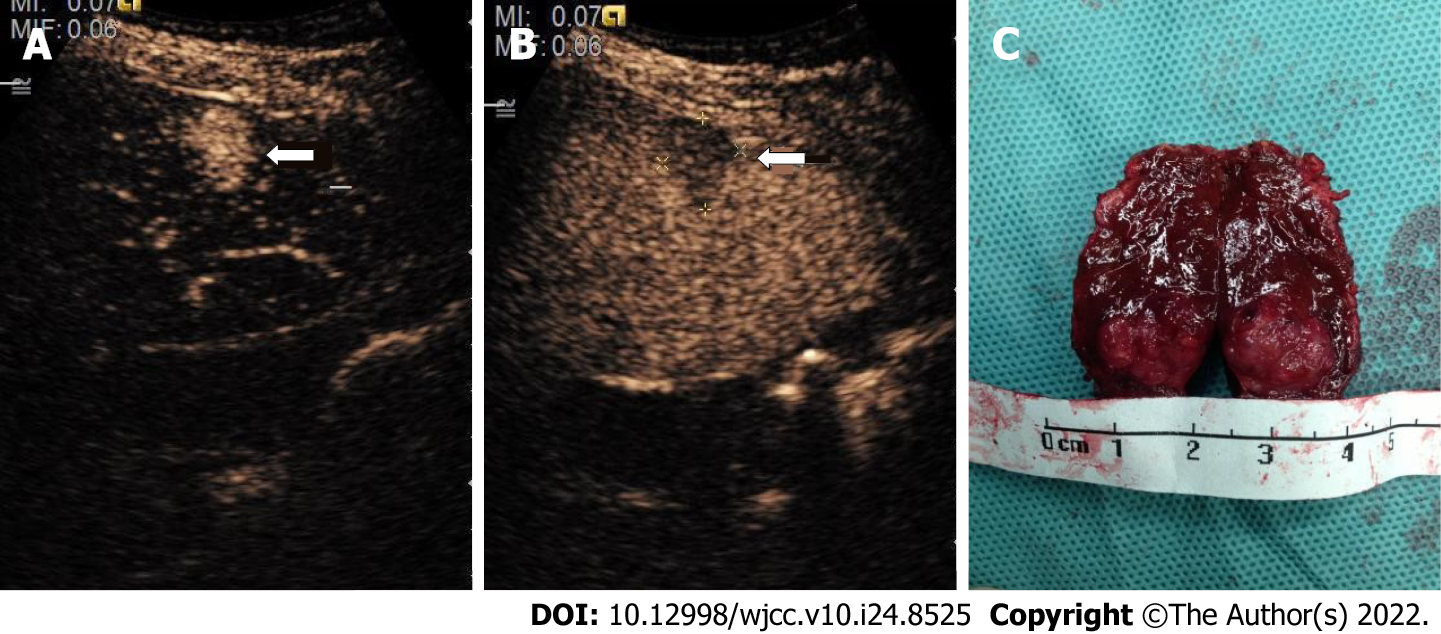
Figure 4 Representative images of contrast-enhanced ultrasound and pathological specimen from an 11-year-old child.
A: A hyperechoic nodule (arrow) shown in the right lobe of the liver in the arterial phase (18 s); B: The same nodule was visualized in the delayed phase (128 s); C: The pathological specimen after surgery resection displayed a tumor (wide diameter 10 mm, long diameter 18 mm). Enhancement during time: 130 s.
- Citation: Mei Q, Yu M, Chen Q. Clinical value of contrast-enhanced ultrasound in early diagnosis of small hepatocellular carcinoma (≤ 2 cm). World J Clin Cases 2022; 10(24): 8525-8534
- URL: https://www.wjgnet.com/2307-8960/full/v10/i24/8525.htm
- DOI: https://dx.doi.org/10.12998/wjcc.v10.i24.8525


