Copyright
©The Author(s) 2022.
World J Clin Cases. Aug 6, 2022; 10(22): 8009-8017
Published online Aug 6, 2022. doi: 10.12998/wjcc.v10.i22.8009
Published online Aug 6, 2022. doi: 10.12998/wjcc.v10.i22.8009
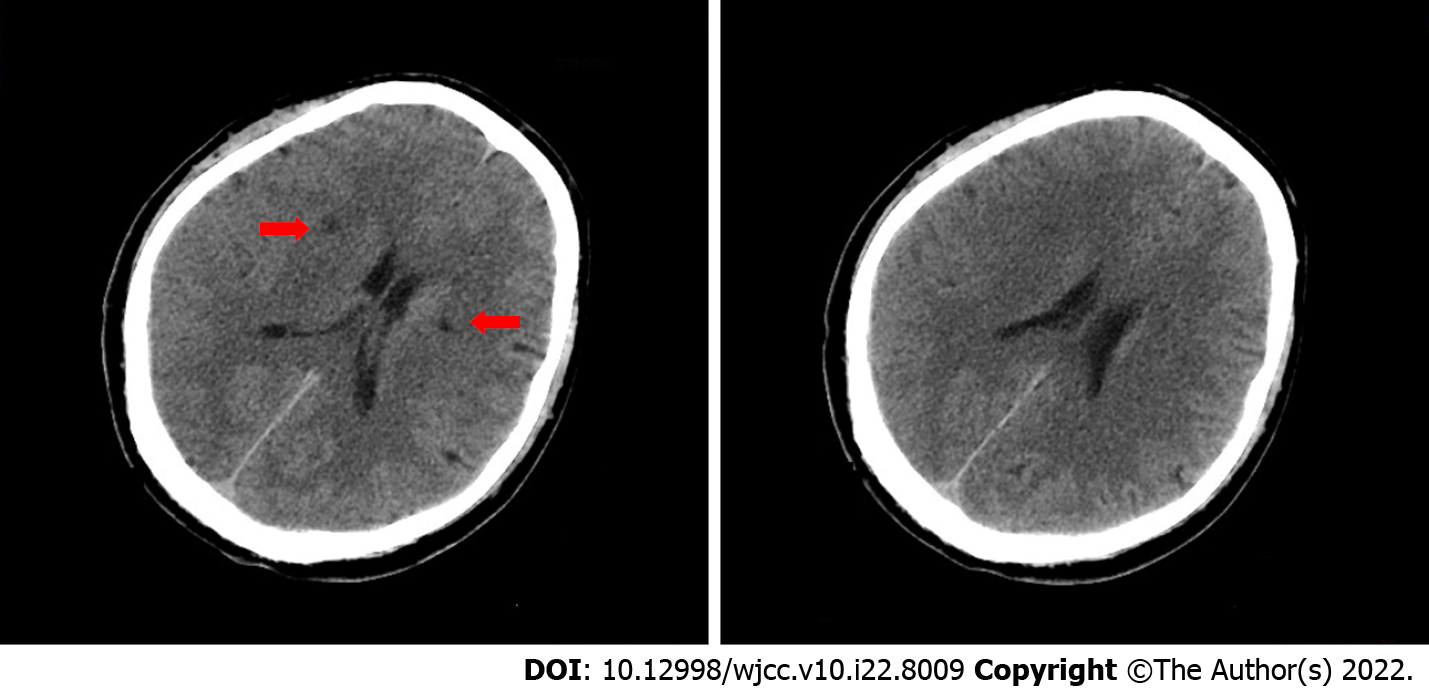
Figure 1 Cranial computed tomography within 2 h of the onset of illness.
Cranial computed tomography revealed small lacunar lesions next to the basal ganglia and lateral ventricles (red arrows).
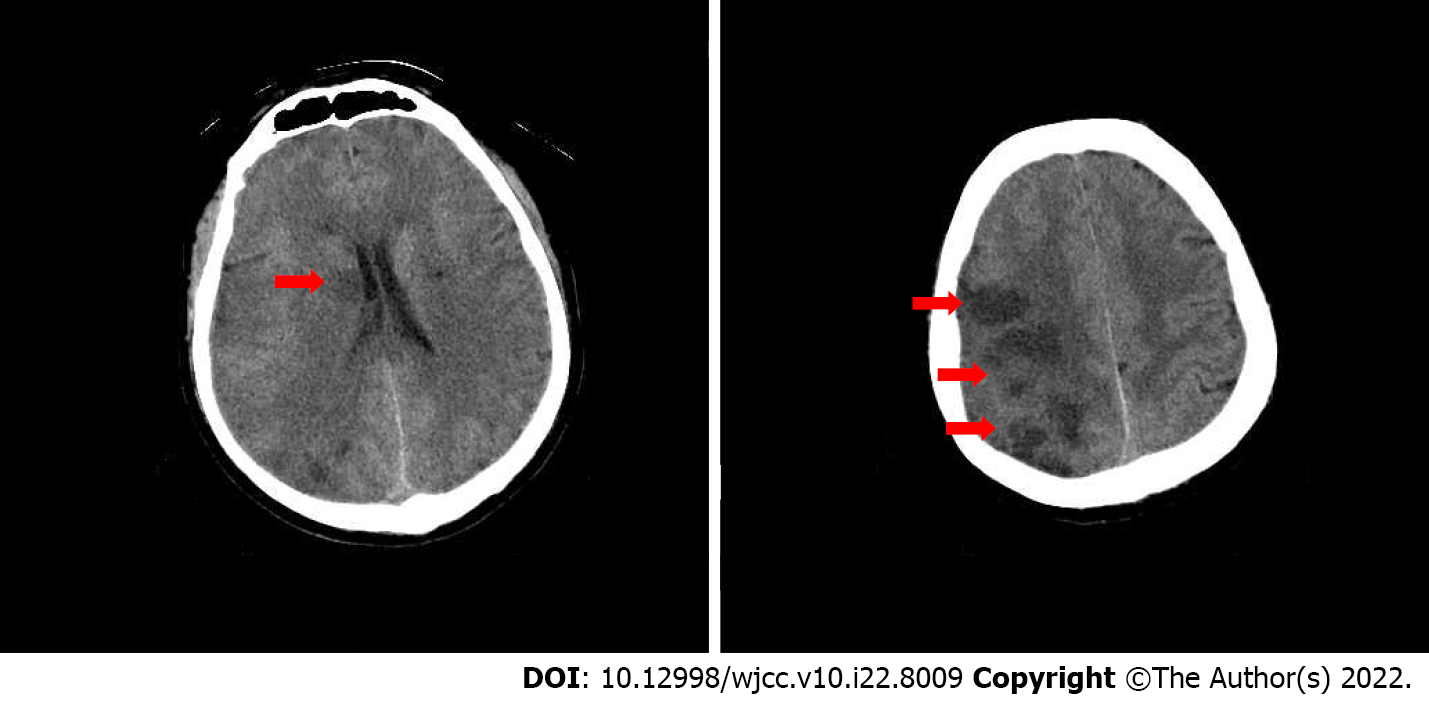
Figure 2 Cranial computed tomography on the second day of intravenous thrombolytic therapy.
Computed tomography shows right basal ganglia (A) and right frontotemporoparietal (B) brain tissue infarction (the red arrows).
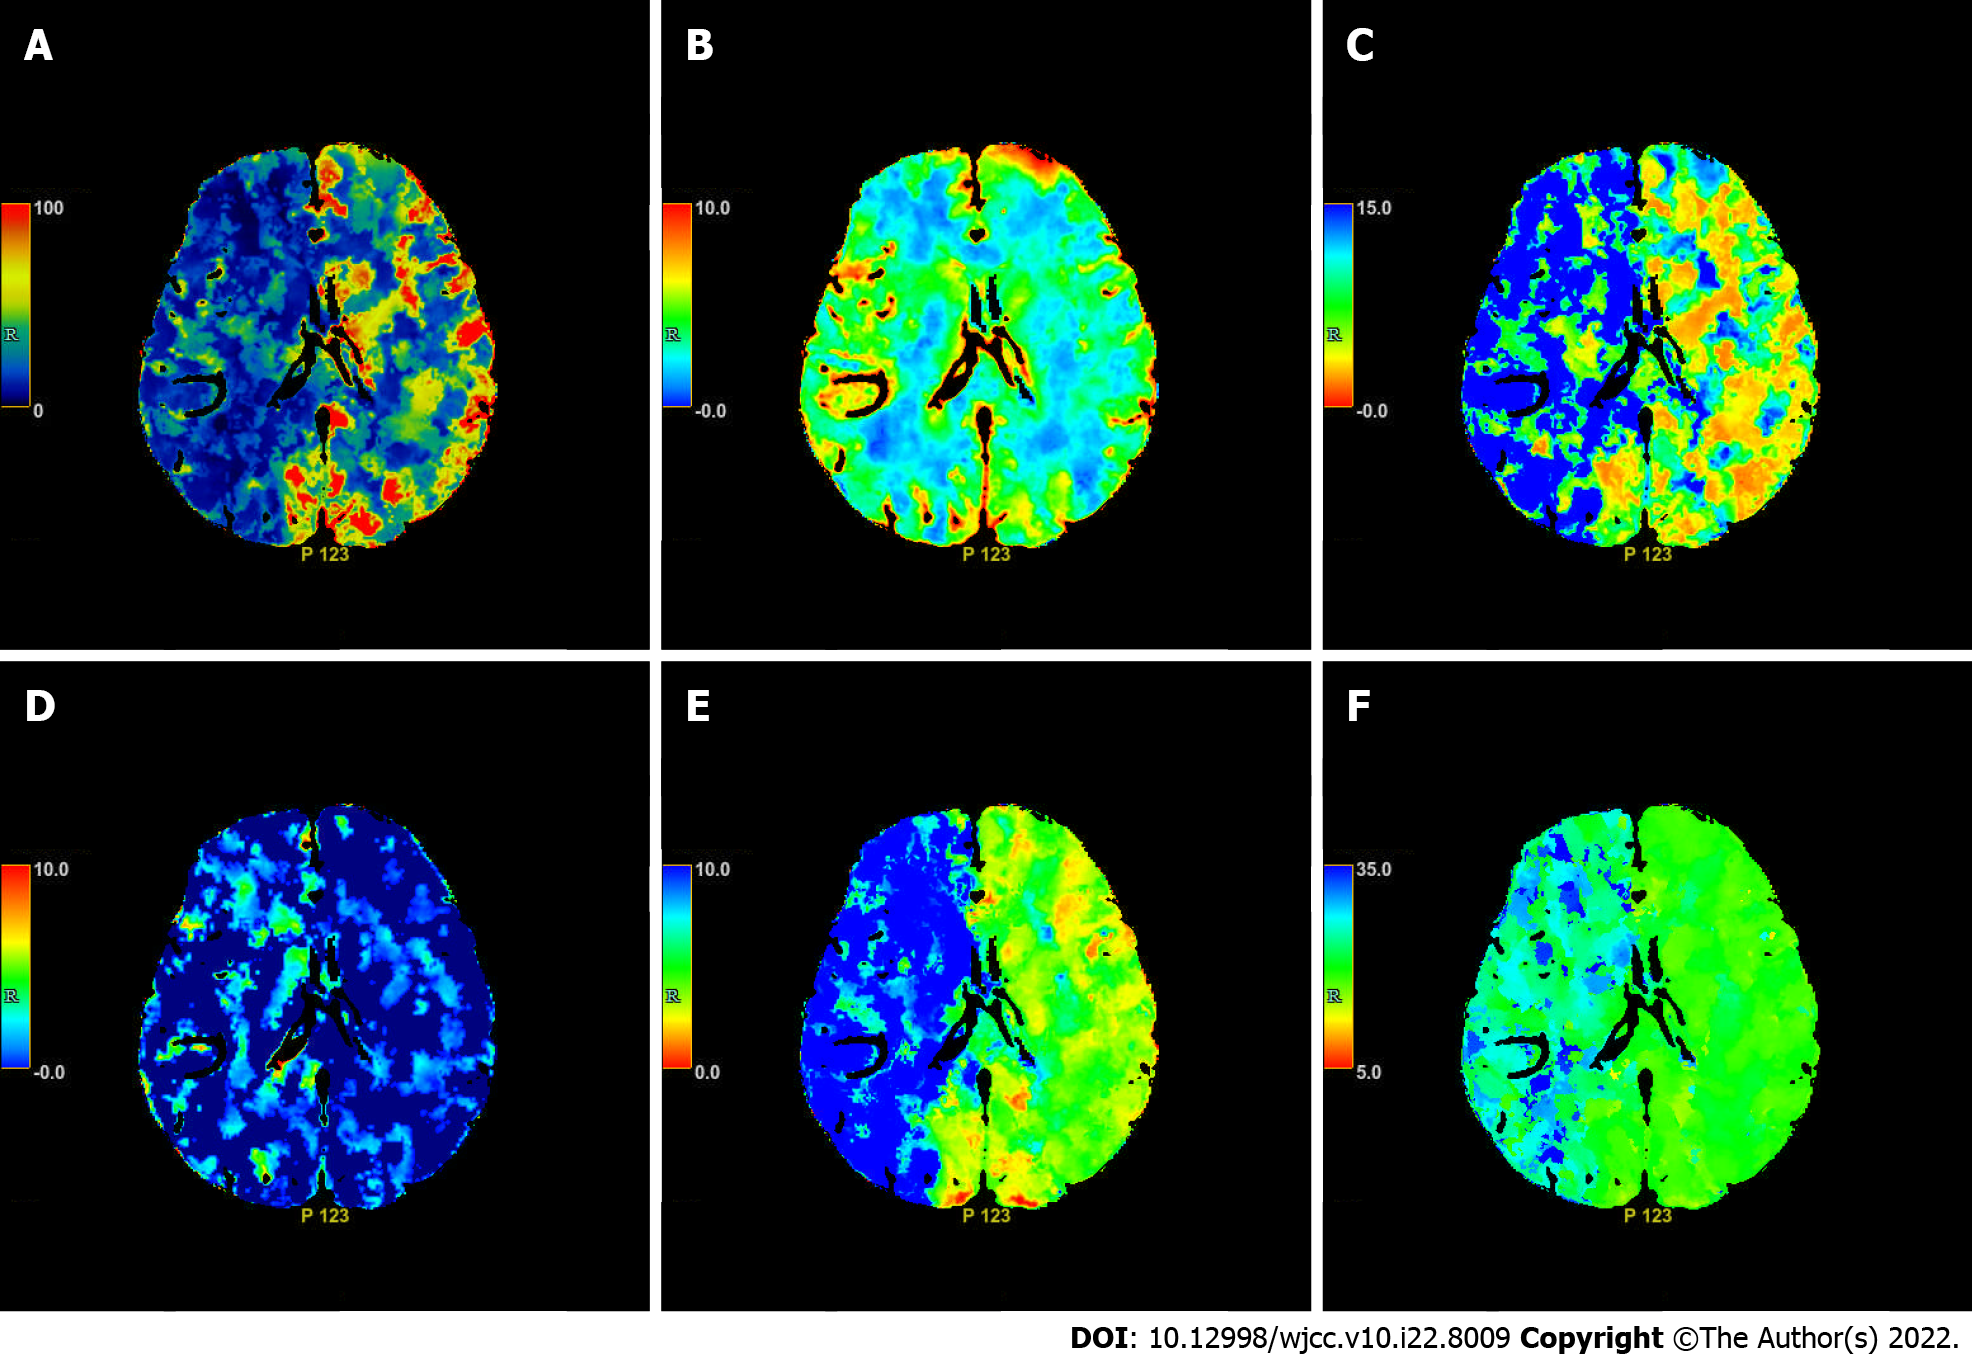
Figure 3 Axial computed tomography perfusion images on the second day of intravenous thrombolysis.
Cerebral blood flow (A), cerebral blood volume (B), mean transit time (C), PS (D), Tmax (E) and Time to peak (F) show multiple ischemic cores in the right frontotemporoparietal lobe as well as relatively extensive hypoperfusion area.
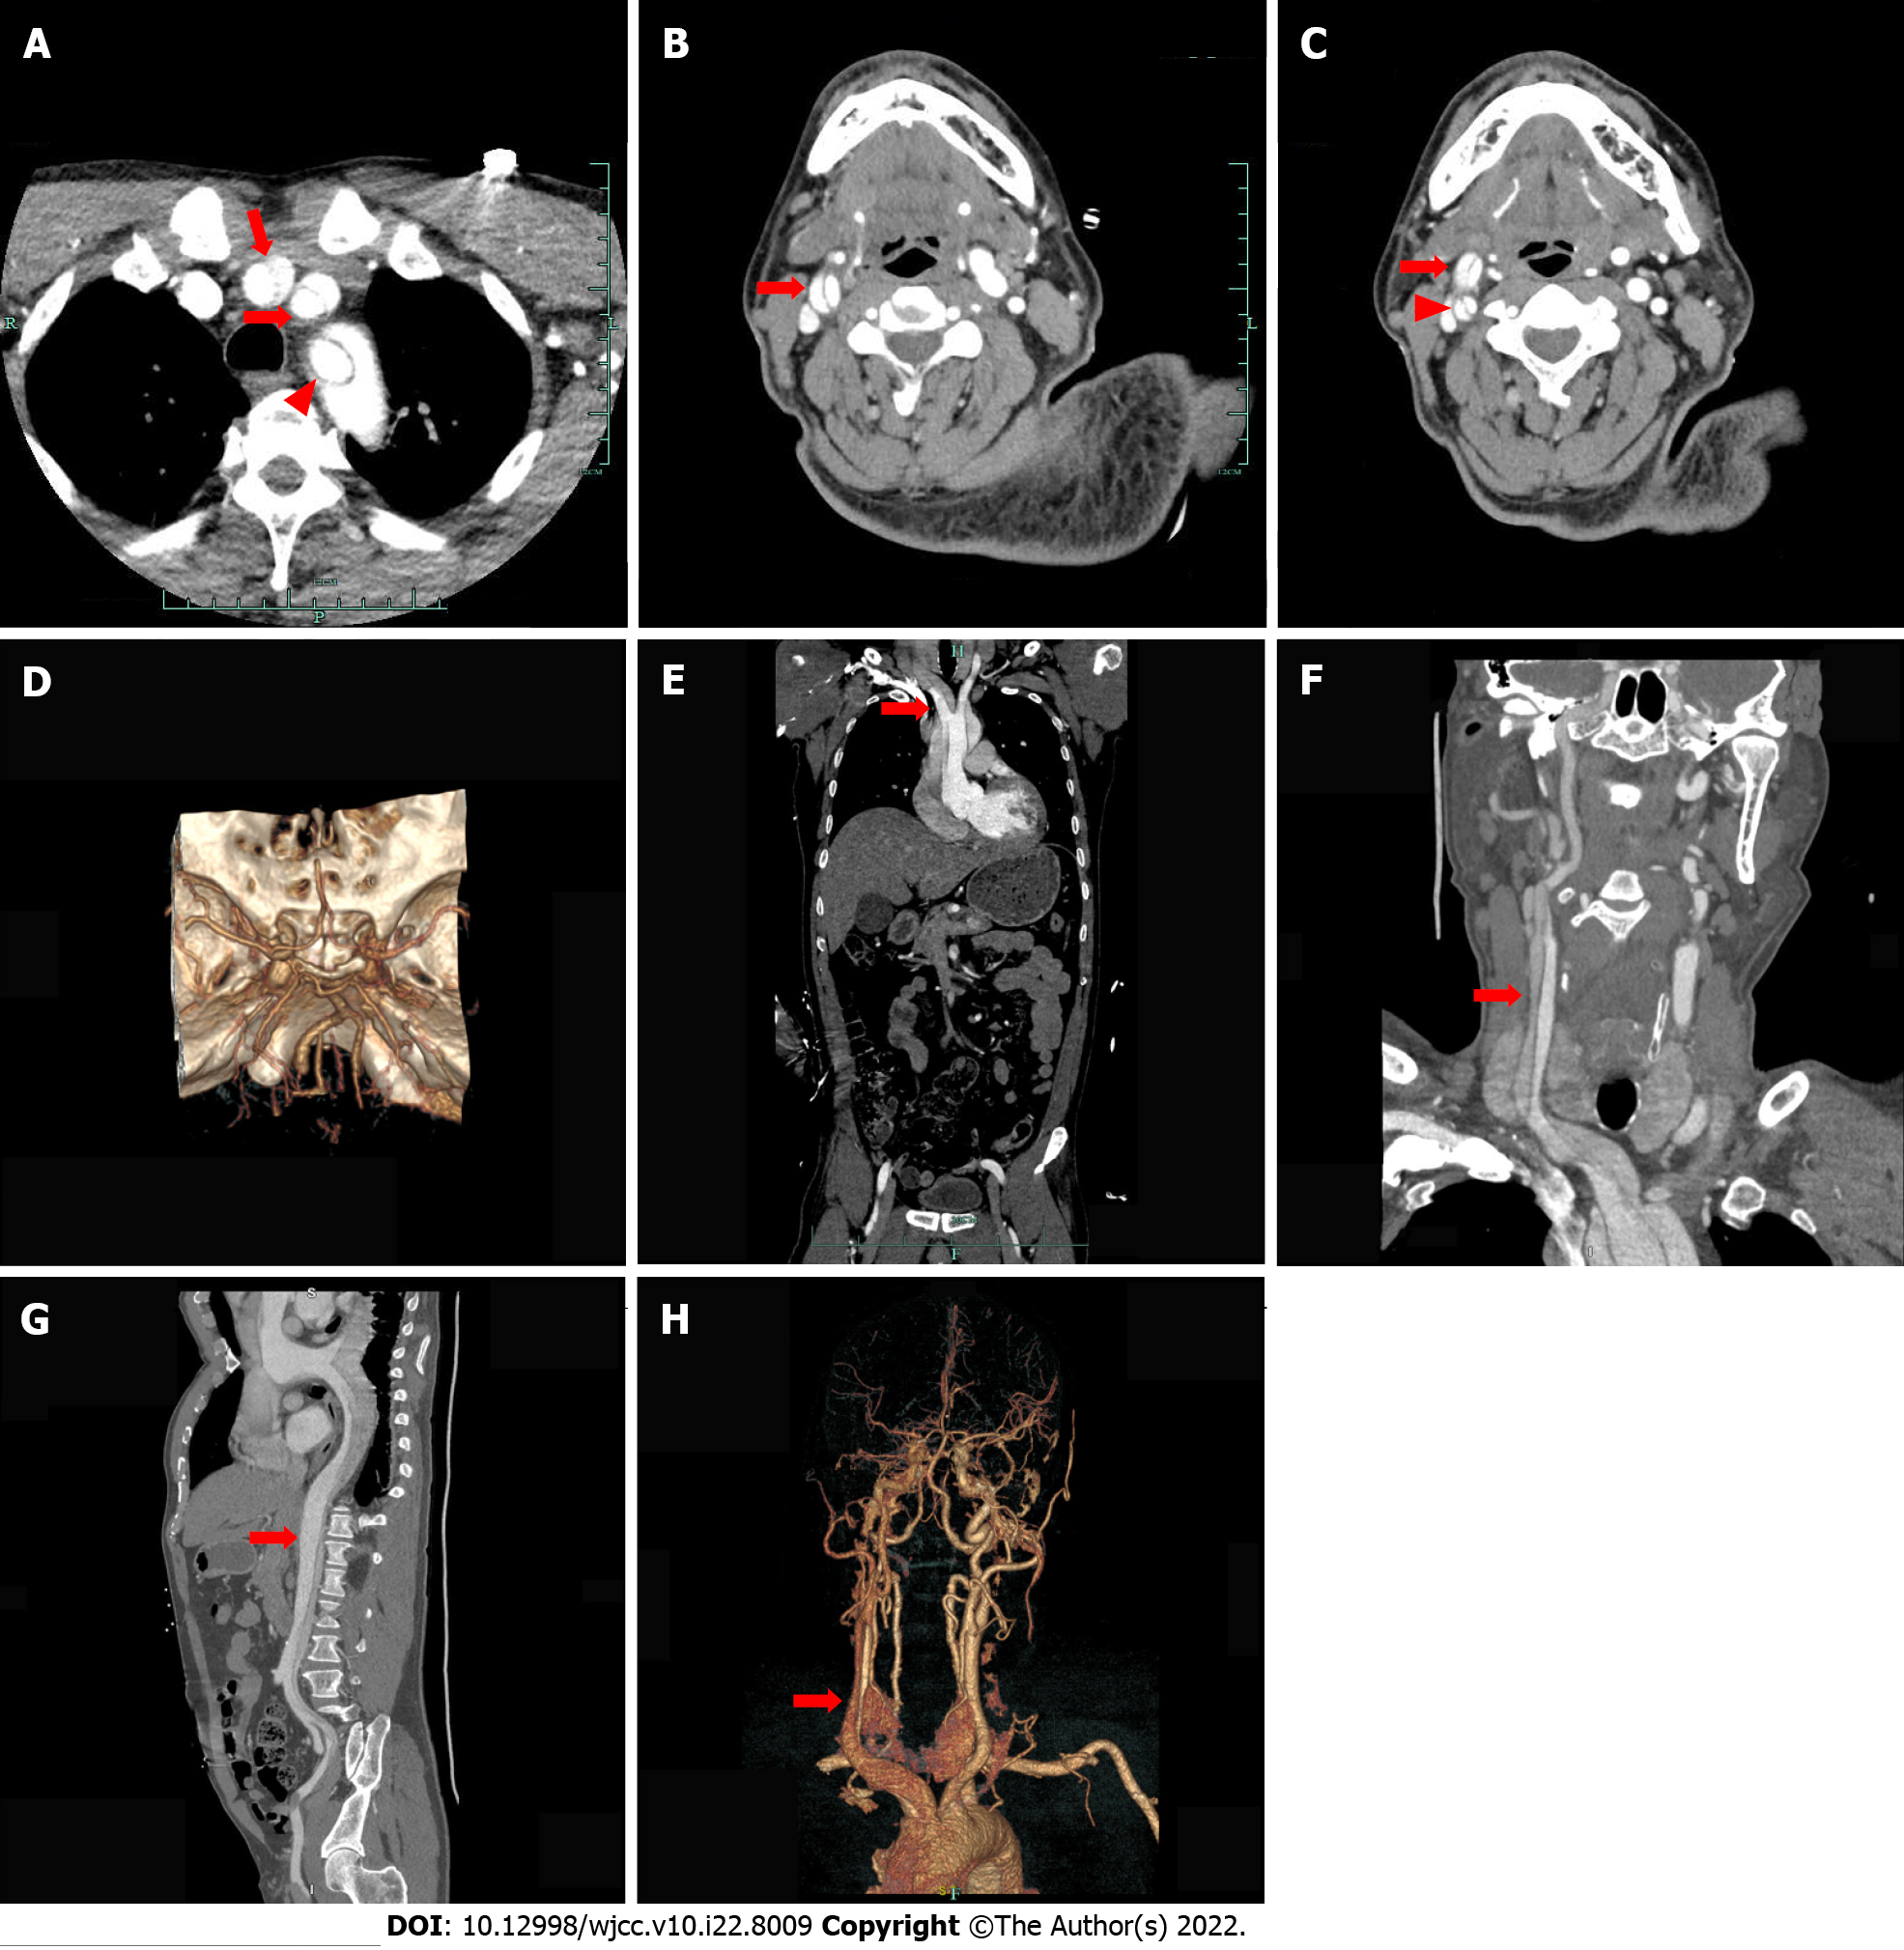
Figure 4 Enhanced computed tomography the day after thrombolytic therapy.
A: Axial enhanced computed tomography (CT) showing type A thoracic aortic dissection and an intimal flap within the innominate artery (long red arrow), left common carotid artery (short red arrow) and left subclavian artery (red triangle); B: Axial enhanced CT showing an intimal flap (red arrow) separating the right common carotid artery into two channels; C: Axial enhanced CT showing carotid artery dissection of the right external carotid artery (red arrow) and the right internal carotid artery (red triangle); D: Intracranial reconstruction CT angiography (CTA) did not show abnormalities; E: Coronal enhanced CT showing an intimal flap (red arrow) within the innominate artery; F: Coronal enhanced CT showing aortic dissection extending from the aortic root to the right common carotid artery (red arrow); G: Sagittal enhanced CT showing an intimal flap (red arrow) within the ascending aorta extending to the left external iliac artery; H: Reconstructive CTA of the head showing aortic dissection involving the innominate artery and the right common carotid artery.
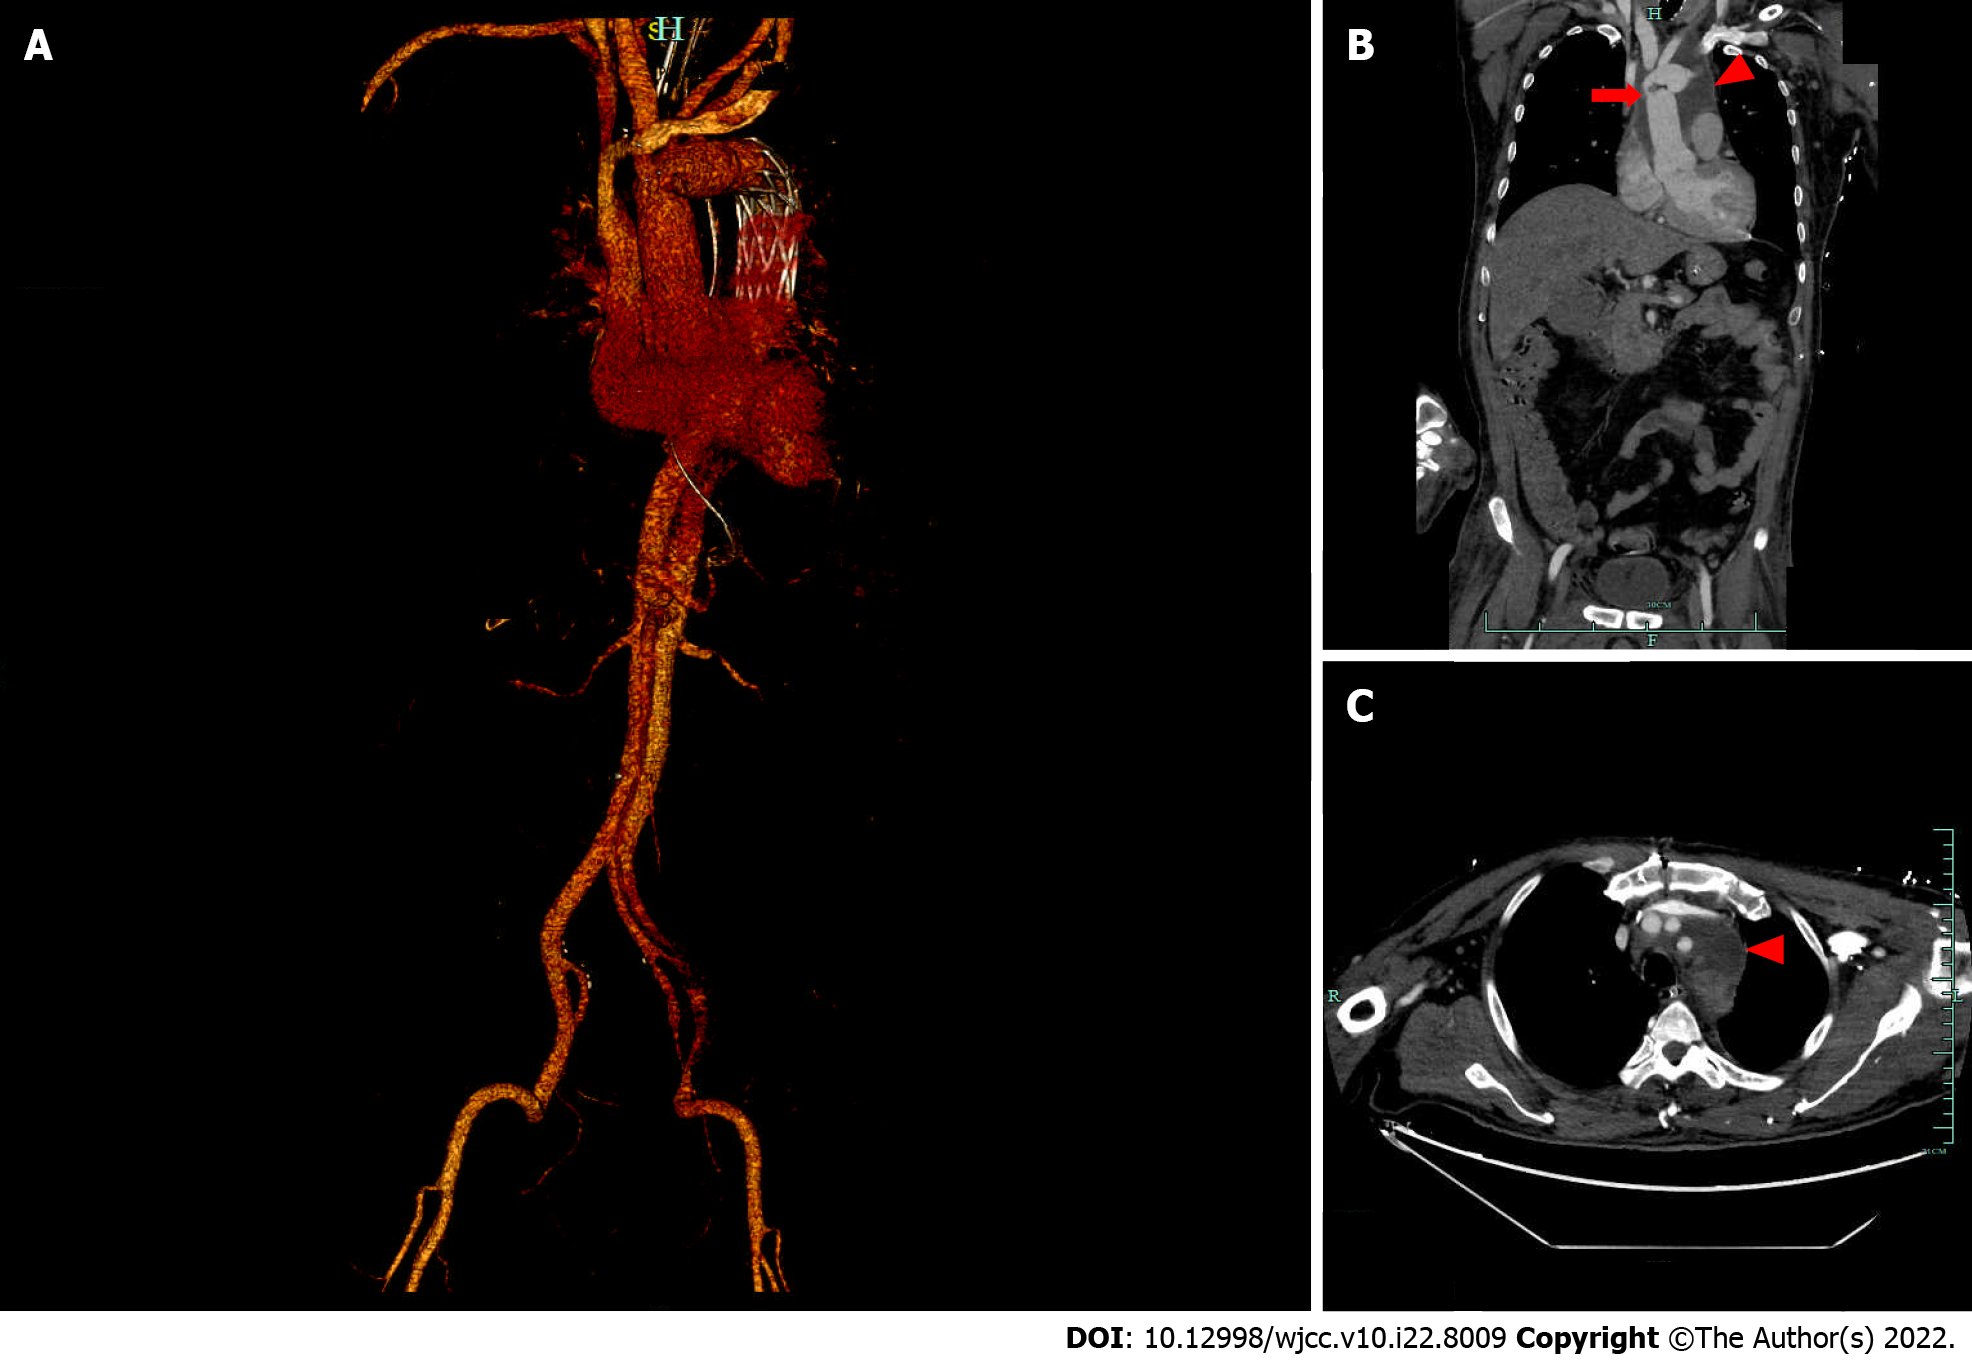
Figure 5 Enhanced thoracoabdominal computed tomography 19 d after surgery for type A dissection.
A: Reconstruction of a computed tomography (CT) angiogram showing replacement of the aortic arch (red arrow) and a vascular stent implanted in the descending aorta (red triangle); B: Coronal enhanced CT revealed replacement of the aortic arch (red arrow) and postoperative effusion surrounding the aortic arch (red triangle); C: Axial enhanced CT shows periaortic arch effusion (red triangle).
- Citation: He ZY, Yao LP, Wang XK, Chen NY, Zhao JJ, Zhou Q, Yang XF. Acute ischemic Stroke combined with Stanford type A aortic dissection: A case report and literature review. World J Clin Cases 2022; 10(22): 8009-8017
- URL: https://www.wjgnet.com/2307-8960/full/v10/i22/8009.htm
- DOI: https://dx.doi.org/10.12998/wjcc.v10.i22.8009


