Copyright
©The Author(s) 2022.
World J Clin Cases. Jul 16, 2022; 10(20): 7116-7123
Published online Jul 16, 2022. doi: 10.12998/wjcc.v10.i20.7116
Published online Jul 16, 2022. doi: 10.12998/wjcc.v10.i20.7116
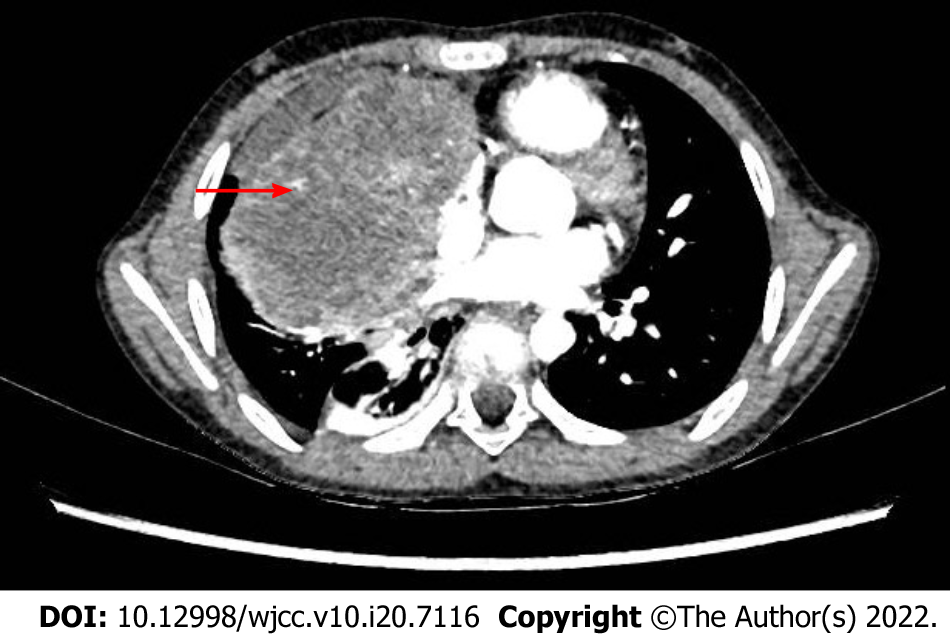
Figure 1 Enhanced chest computed tomography scan at the beginning of the disease.
The arrow points to the tumor.
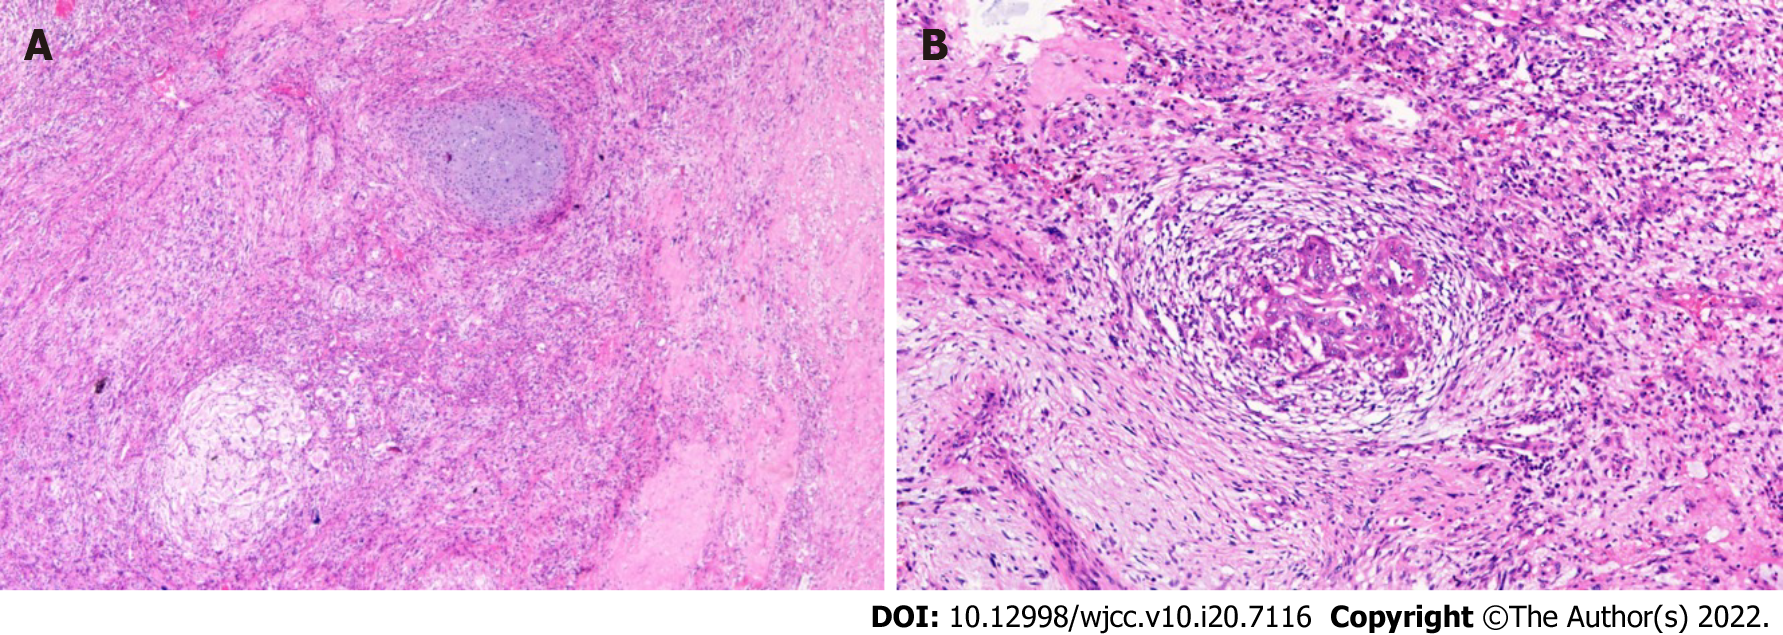
Figure 2 Histology of the tumor specimen from the first resection.
Hematoxylin-eosin stain. A: 40 ×; B: 100 ×.
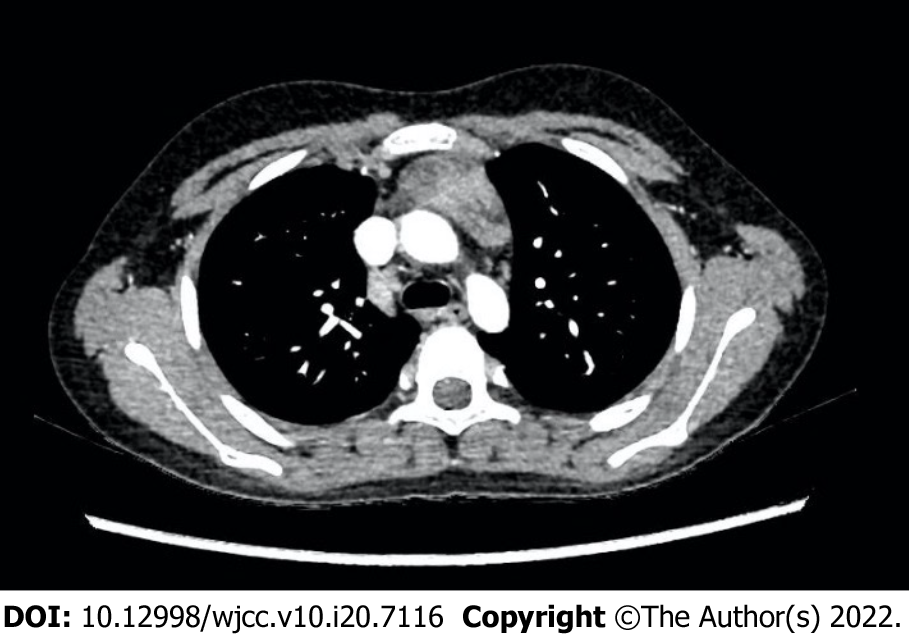
Figure 3 Chest computed tomography scan of the recurrent tumor.
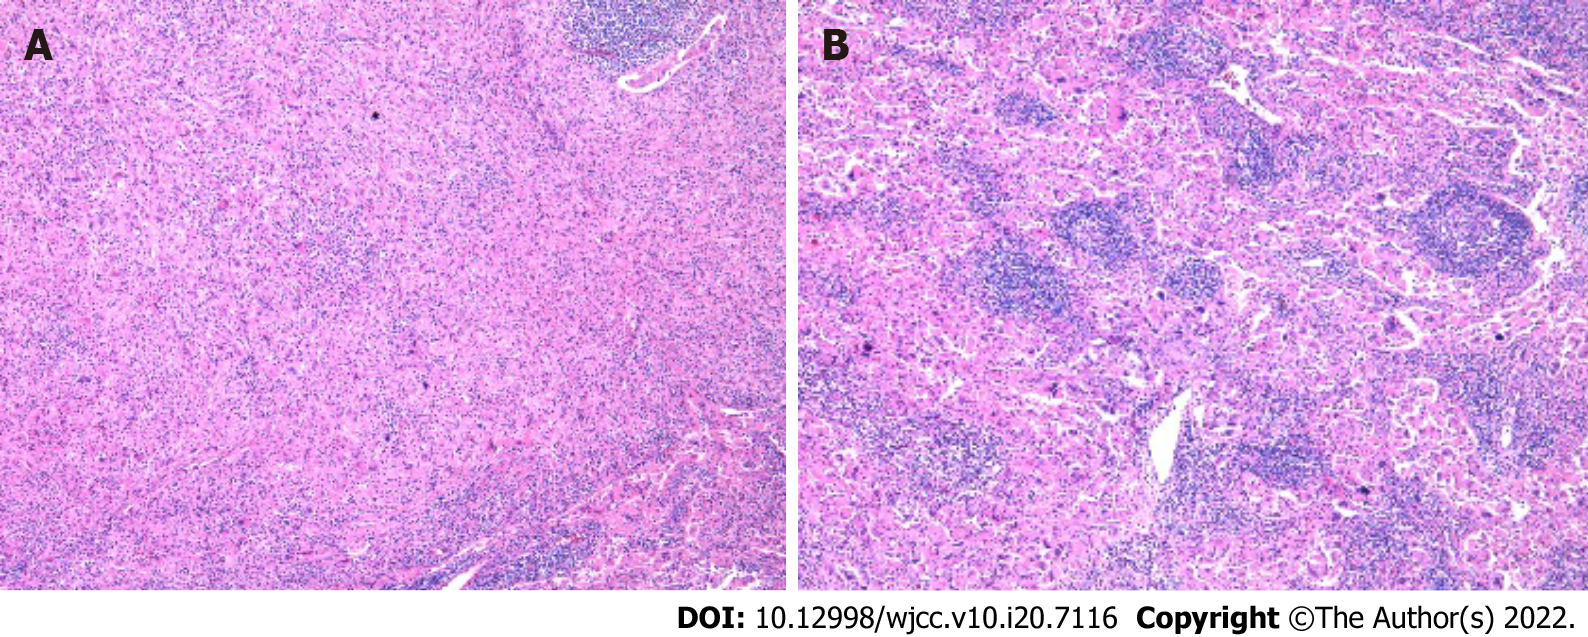
Figure 4 Histology of the tumor specimen from the second resection.
Hematoxylin-eosin stain. A: 100 ×; B: 200 ×.
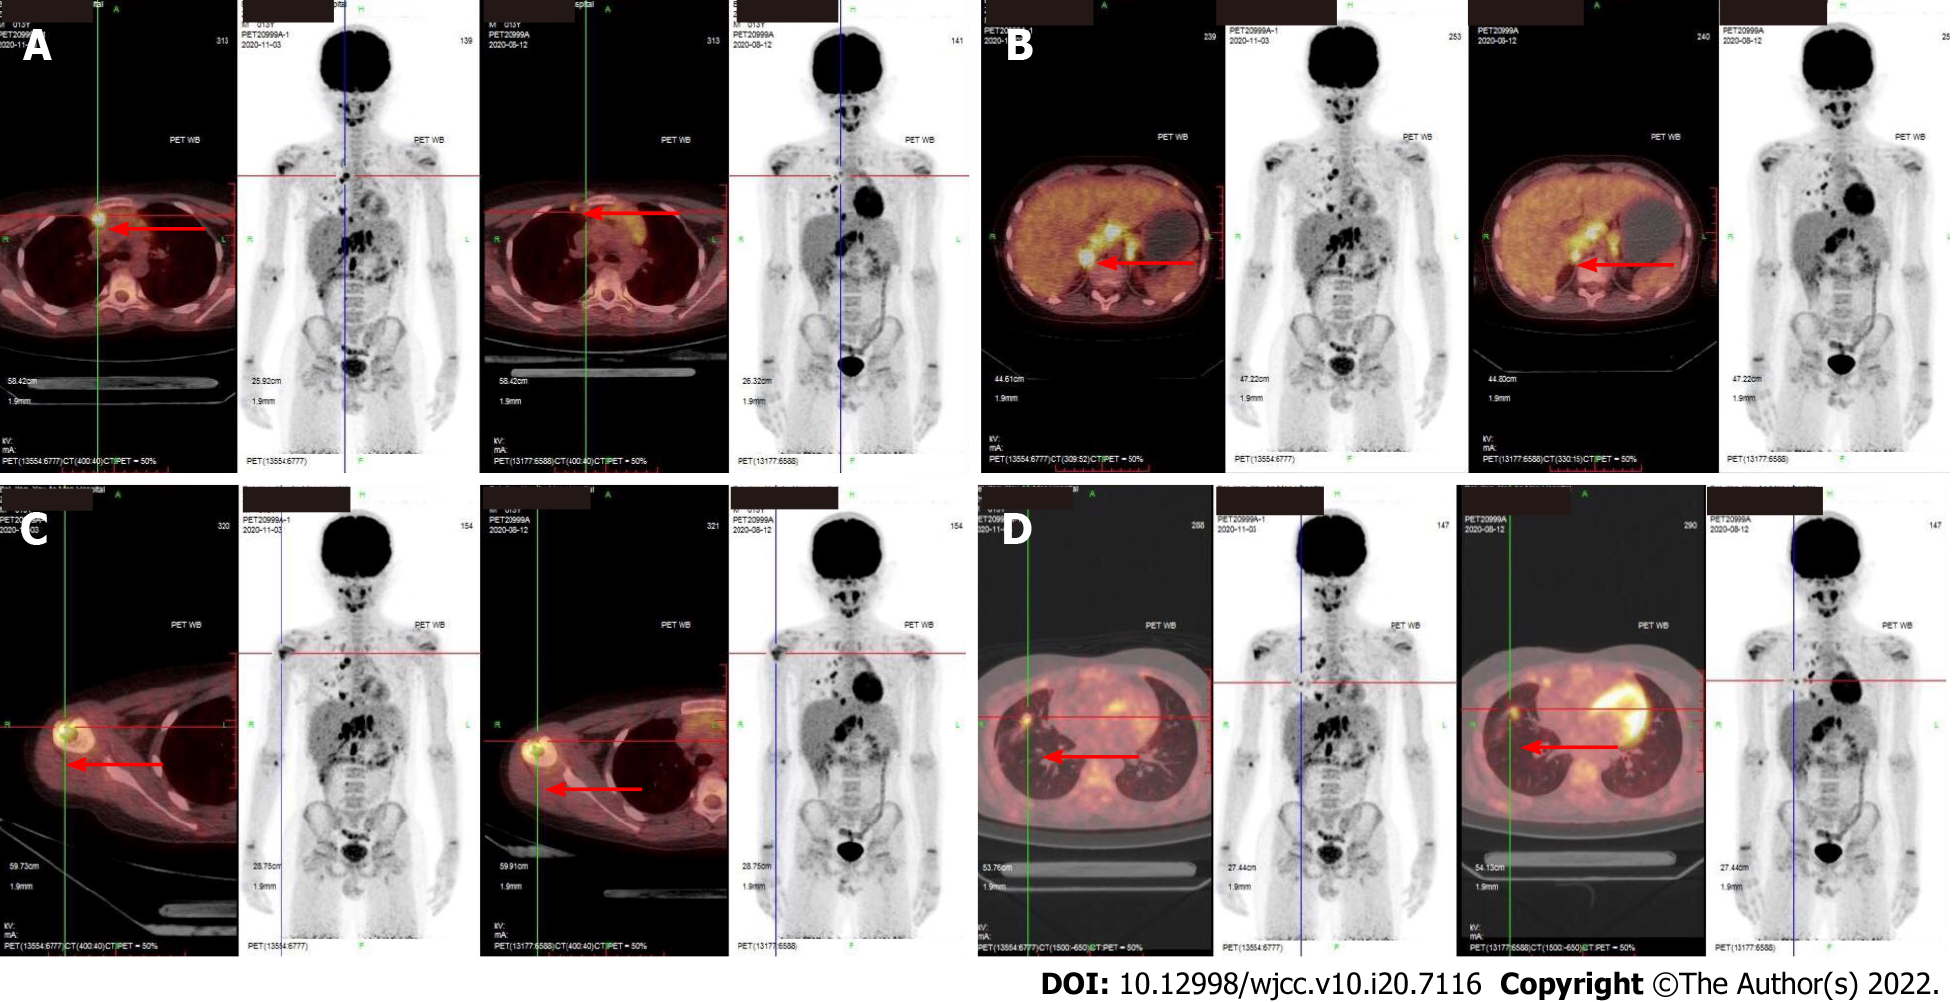
Figure 5 Comparison of the first and second positron emission tomography-computed tomography.
The images of the second positron emission tomography-computed tomography (PET/CT) obtained in November 2020 are on the left side, and that of first PET/CT obtained in August 2020 are on the right side of the Figure. The arrows point to the lesions. A: Lesions of right pleura were enlarged; B: Retroperitoneal lymph nodes increased; C: New metastases were found in the head of the right humerus; D: Metastases in the right lung were approximately the same as before.
- Citation: Yang PY, Ma XL, Zhao W, Fu LB, Zhang R, Zeng Q, Qin H, Yu T, Su Y. Malignant histiocytosis associated with mediastinal germ cell tumor: A case report . World J Clin Cases 2022; 10(20): 7116-7123
- URL: https://www.wjgnet.com/2307-8960/full/v10/i20/7116.htm
- DOI: https://dx.doi.org/10.12998/wjcc.v10.i20.7116


