Copyright
©The Author(s) 2022.
World J Clin Cases. Jul 6, 2022; 10(19): 6360-6369
Published online Jul 6, 2022. doi: 10.12998/wjcc.v10.i19.6360
Published online Jul 6, 2022. doi: 10.12998/wjcc.v10.i19.6360
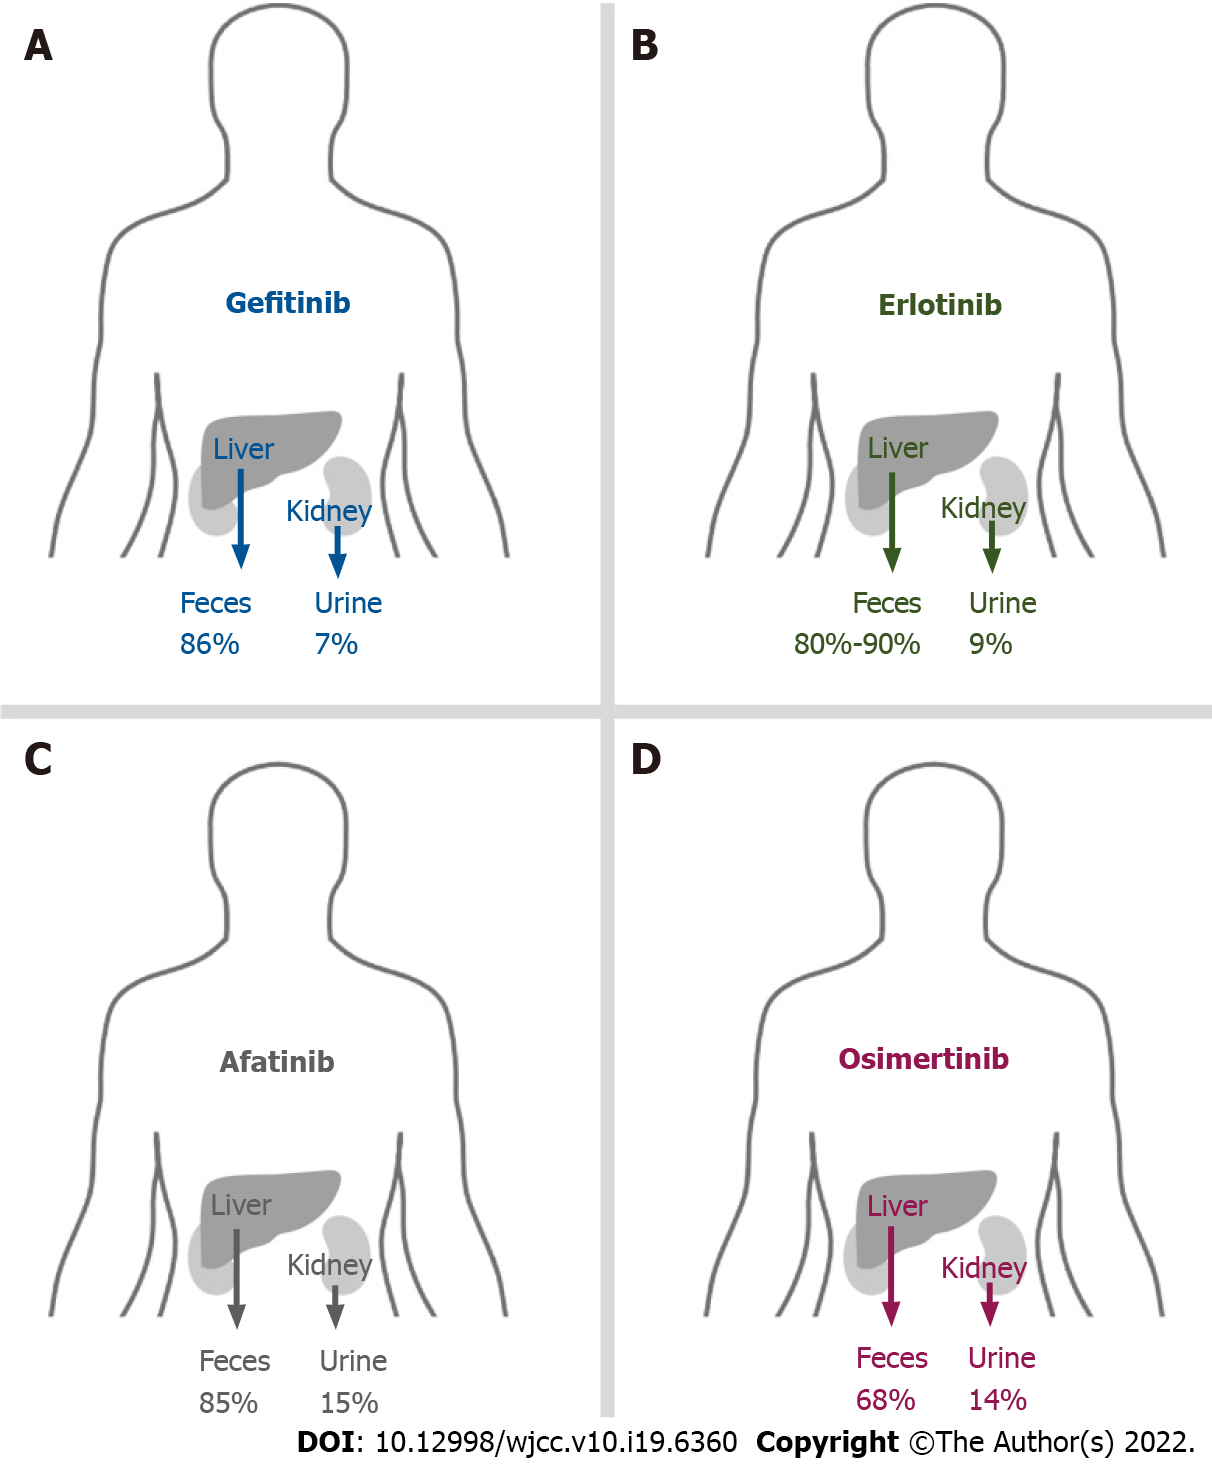
Figure 1 Main routines of elimination of epidermal growth factor receptor-tyrosine kinase inhibitors.
A: 86% of gefitinib is metabolized by the liver and excreted via feces; B: 80%-90% of erlotinib is metabolized by the liver and excreted via feces; C: 85% of afatinib is metabolized by the liver and excreted via feces; D: 68% of osimertinib is metabolized by the liver and excreted via feces.
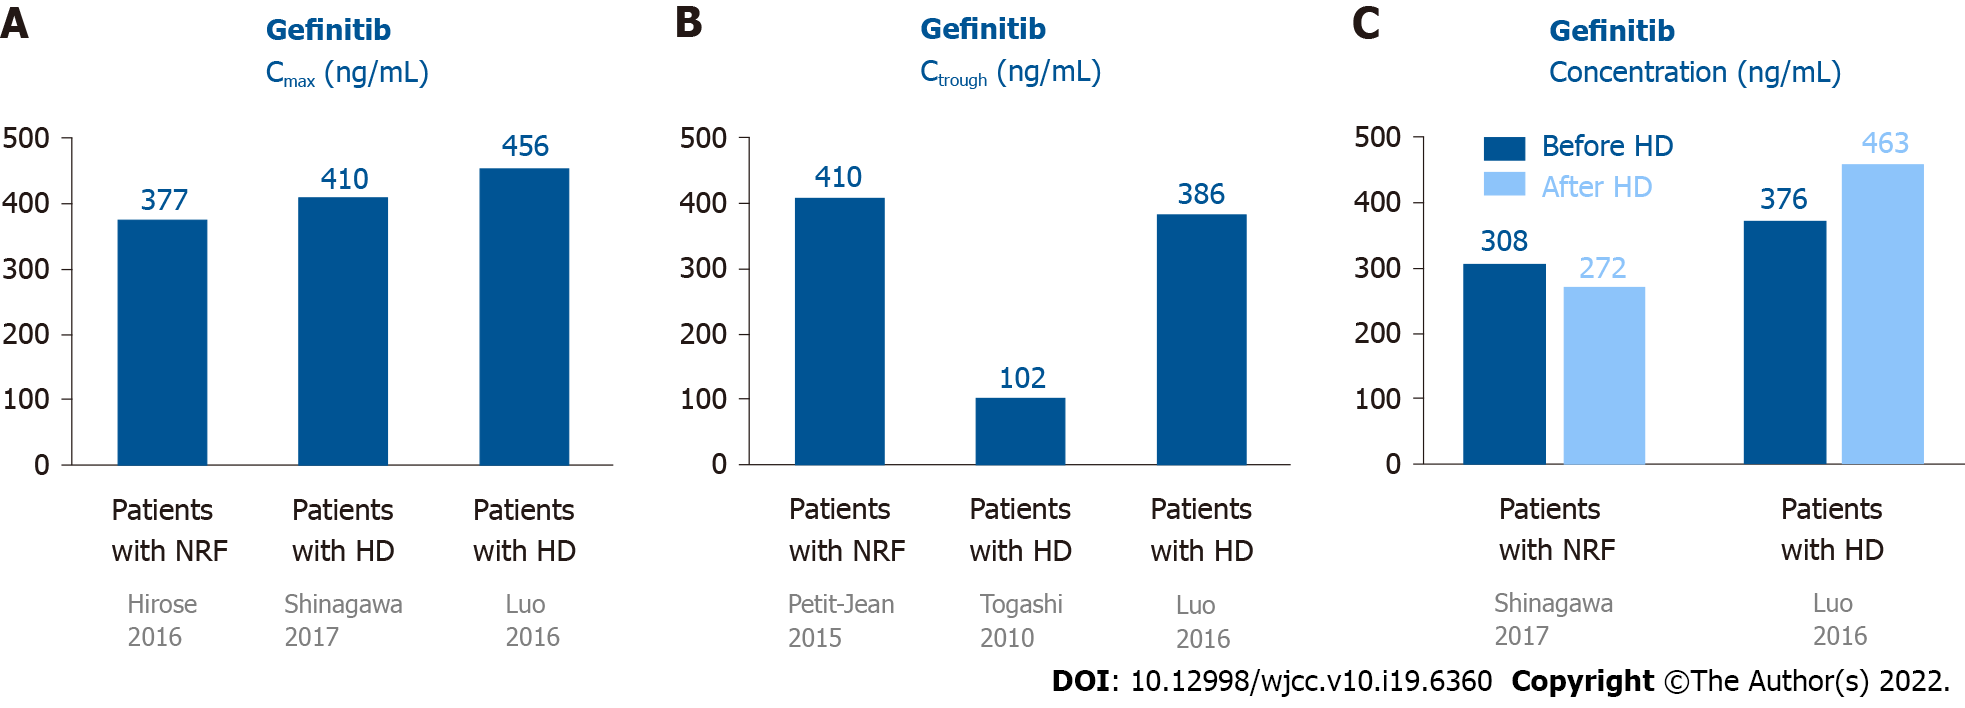
Figure 2 Pharmacokinetics of gefitinib in patients undergoing hemodialysis and those with normal renal function.
A: The Cmax of gefitinib in patients undergoing HD was similar to subjects with NRF; B: One patient showed the Ctrough of gefitinib was 410 ng/mL. The two patients undergoing HD showed the Ctrough of gefitinib was 102-386 ng/mL; C: The plasma concentration of gefitinib were similar in patients before and after HD. Cmax: Maxium concentration; Ctrough: Trough concentration; HD: Hemodialysis; NRF: Normal renal function.
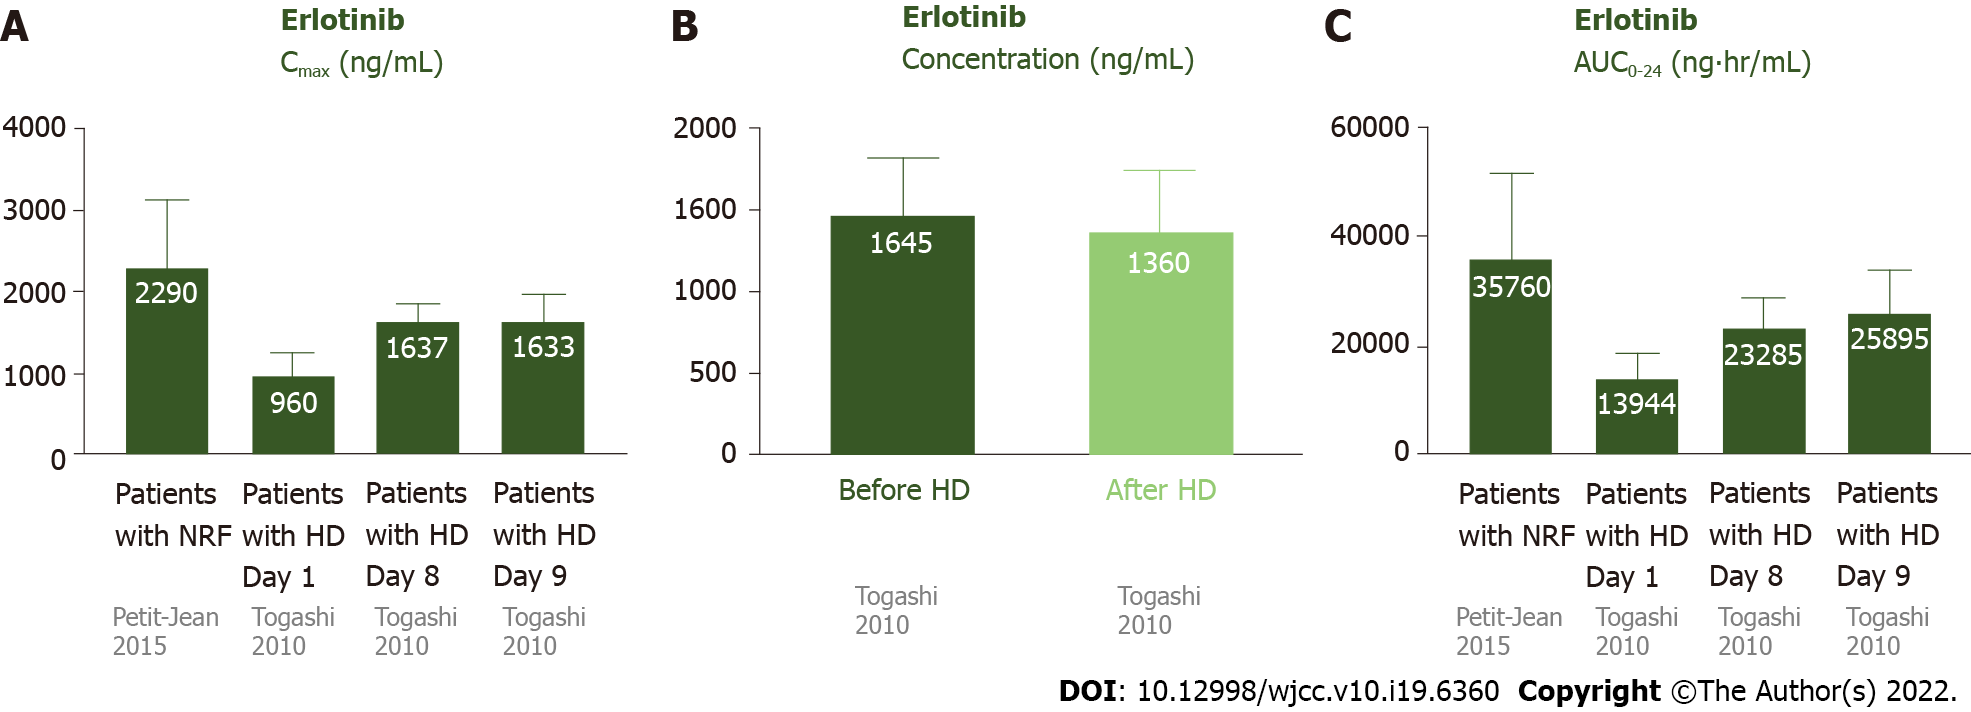
Figure 3 Pharmacokinetics of erlotinib in patients undergoing hemodialysis and those with normal renal function.
A: The Cmax of erlotinib was 2290 ± 840 ng/mL in patients with NRF. For the patients undergoing HD, the Cmax was 1638 ± 206 ng/mL on day 8 and 1638 ± 206 ng/mL on day 9 (after steady state). The Cmax was similar in patients with NRF and undergoing HD; B: The plasma concentrations of erlotinib were similar before and after HD; C: The AUC0-24 was 35760 ± 15720 ng· hr/mL in patients with NRF. For the patients undergoing HD, the AUC0-24 was 23285 ± 5338 ng· hr/mL on day 8 and 25895 ± 7747 ng· hr/mL on day 9. The AUC0-24 was similar in patients with NRF and undergoing HD. AUC0-24: Area under the curve of the plasma concentration from 0 to 24 h; Cmax: Maxium concentration; Ctrough: Trough concentration; HD: Hemodialysis; NRF: Normal renal function.
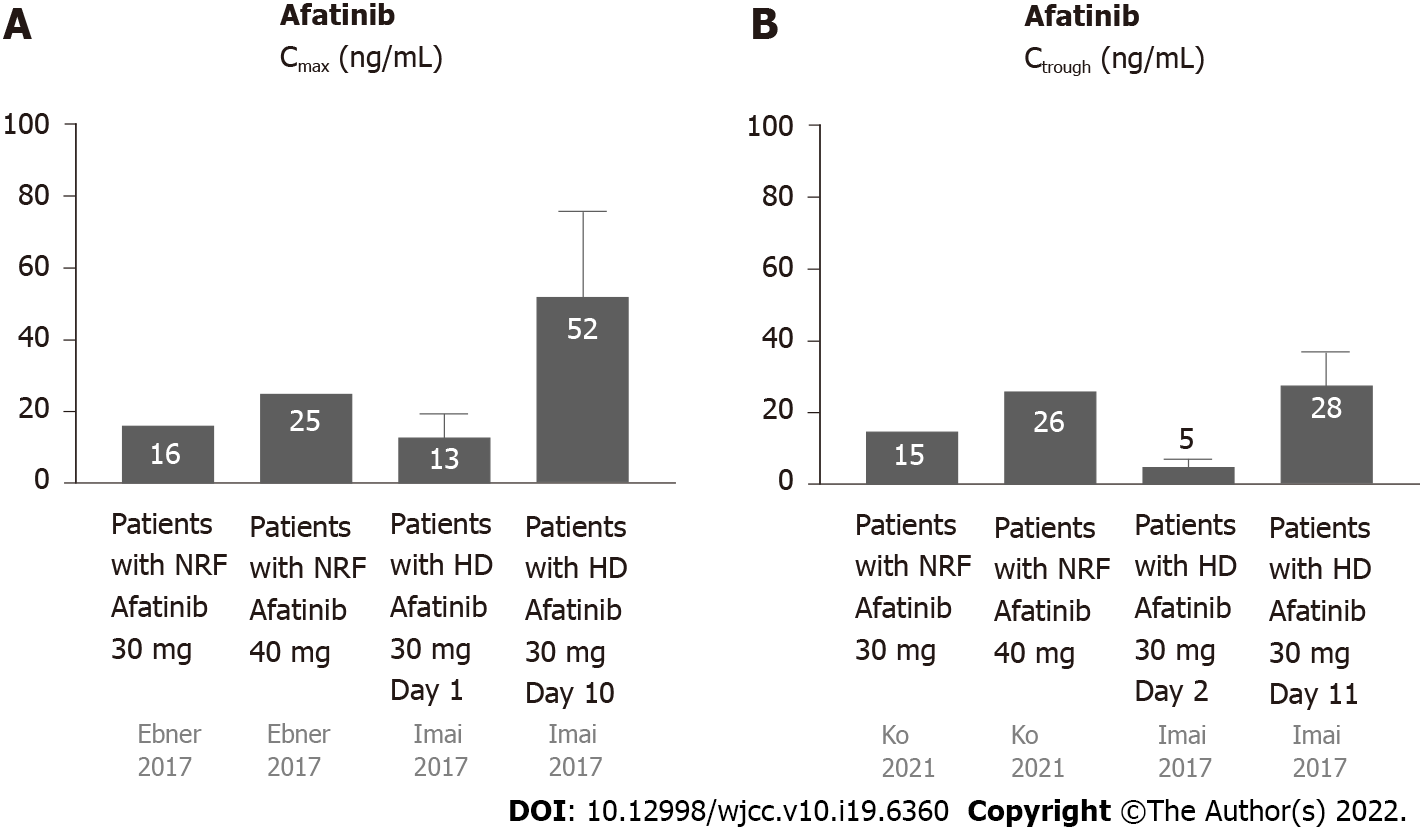
Figure 4 Pharmacokinetics of afatinib in patients undergoing hemodialysis and those with normal renal function.
A: The Cmax of afatinib 30 mg daily in patients with NRF was 16.3 ng/mL, while the Cmax of afatinib 40 mg daily in patients with was NRF 25.2 ng/mL. The Cmax of afatinib 30 mg daily in patients with HD was 13.4 ± 6.2 ng/mL on day 1 and 51.7 ± 23.8 ng/mL on day 10; B: The Ctrough of afatinib 30 mg daily in patients with NRF was 15.1 ng/mL, while the Ctrough of afatinib 40 mg daily in patients with NRF was 26 ng/mL. The Ctrough of afatinib 30 mg daily in patients with HD was 4.5 ± 2.3 ng/mL on day 1 and 28.3 ± 9.0 ng/mL on day 11. Cmax: Maxium concentration; Ctrough: Trough concentration; HD: Hemodialysis; NRF: Normal renal function.
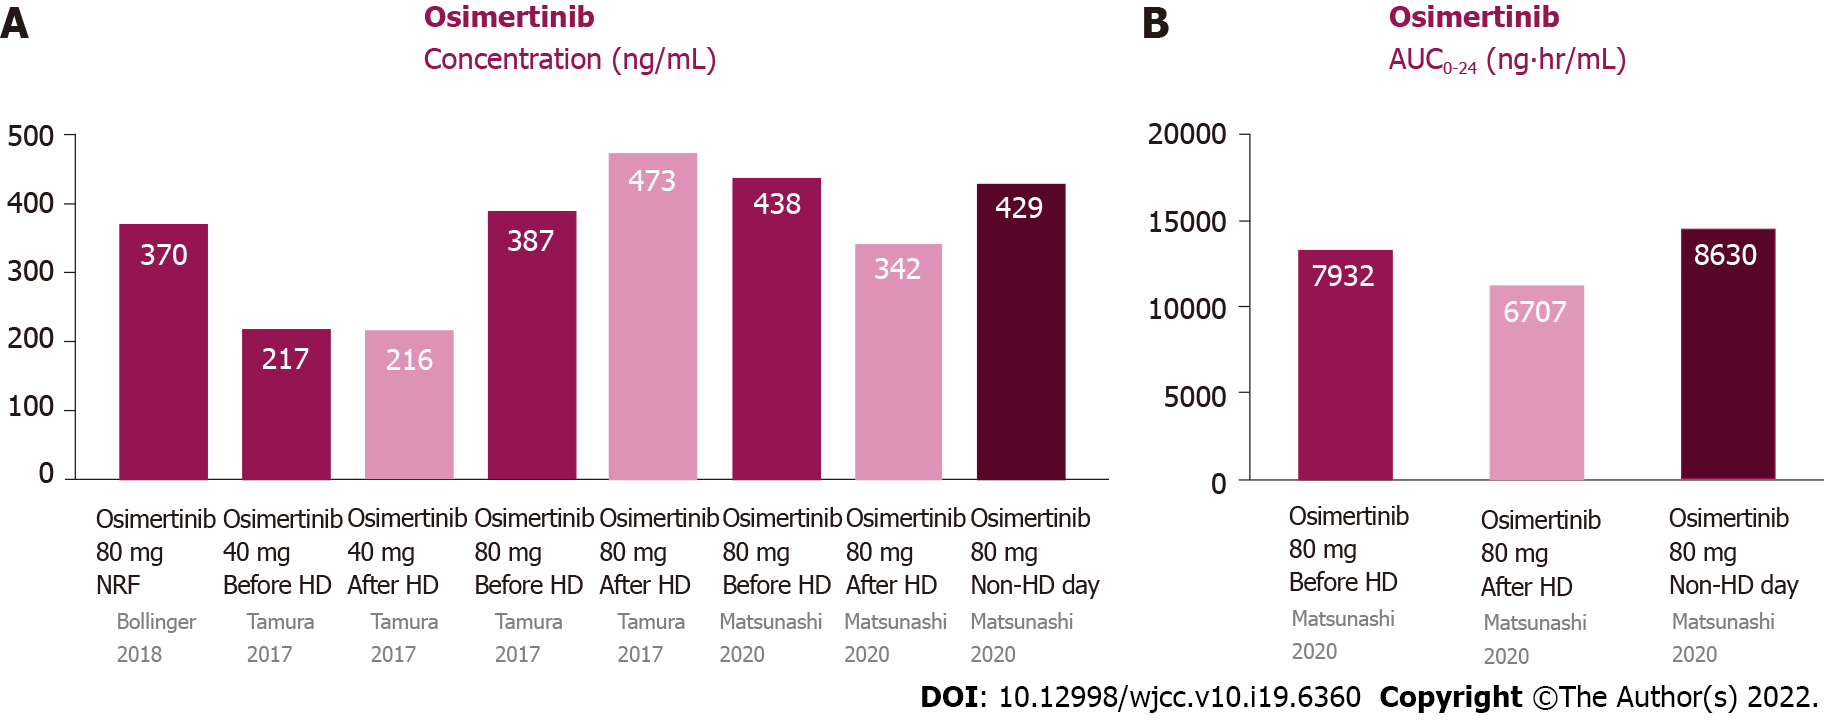
Figure 5 Pharmacokinetics of osimertinib in patients undergoing hemodialysis and those with normal renal function.
A: Plasma concentrations of osimertinib were similar among pre-HD, post-HD, and non-HD days; B: The AUC0–24 of osimertinib were similar among pre-HD, post-HD, and non-HD days. AUC0-24: Area under the curve of the plasma concentration from 0 to 24 h; HD: Hemodialysis; NRF: Normal renal function.
- Citation: Lan CC, Hsieh PC, Huang CY, Yang MC, Su WL, Wu CW, Wu YK. Review of epidermal growth factor receptor-tyrosine kinase inhibitors administration to non-small-cell lung cancer patients undergoing hemodialysis. World J Clin Cases 2022; 10(19): 6360-6369
- URL: https://www.wjgnet.com/2307-8960/full/v10/i19/6360.htm
- DOI: https://dx.doi.org/10.12998/wjcc.v10.i19.6360


