Copyright
©The Author(s) 2022.
World J Clin Cases. Jun 26, 2022; 10(18): 6289-6297
Published online Jun 26, 2022. doi: 10.12998/wjcc.v10.i18.6289
Published online Jun 26, 2022. doi: 10.12998/wjcc.v10.i18.6289
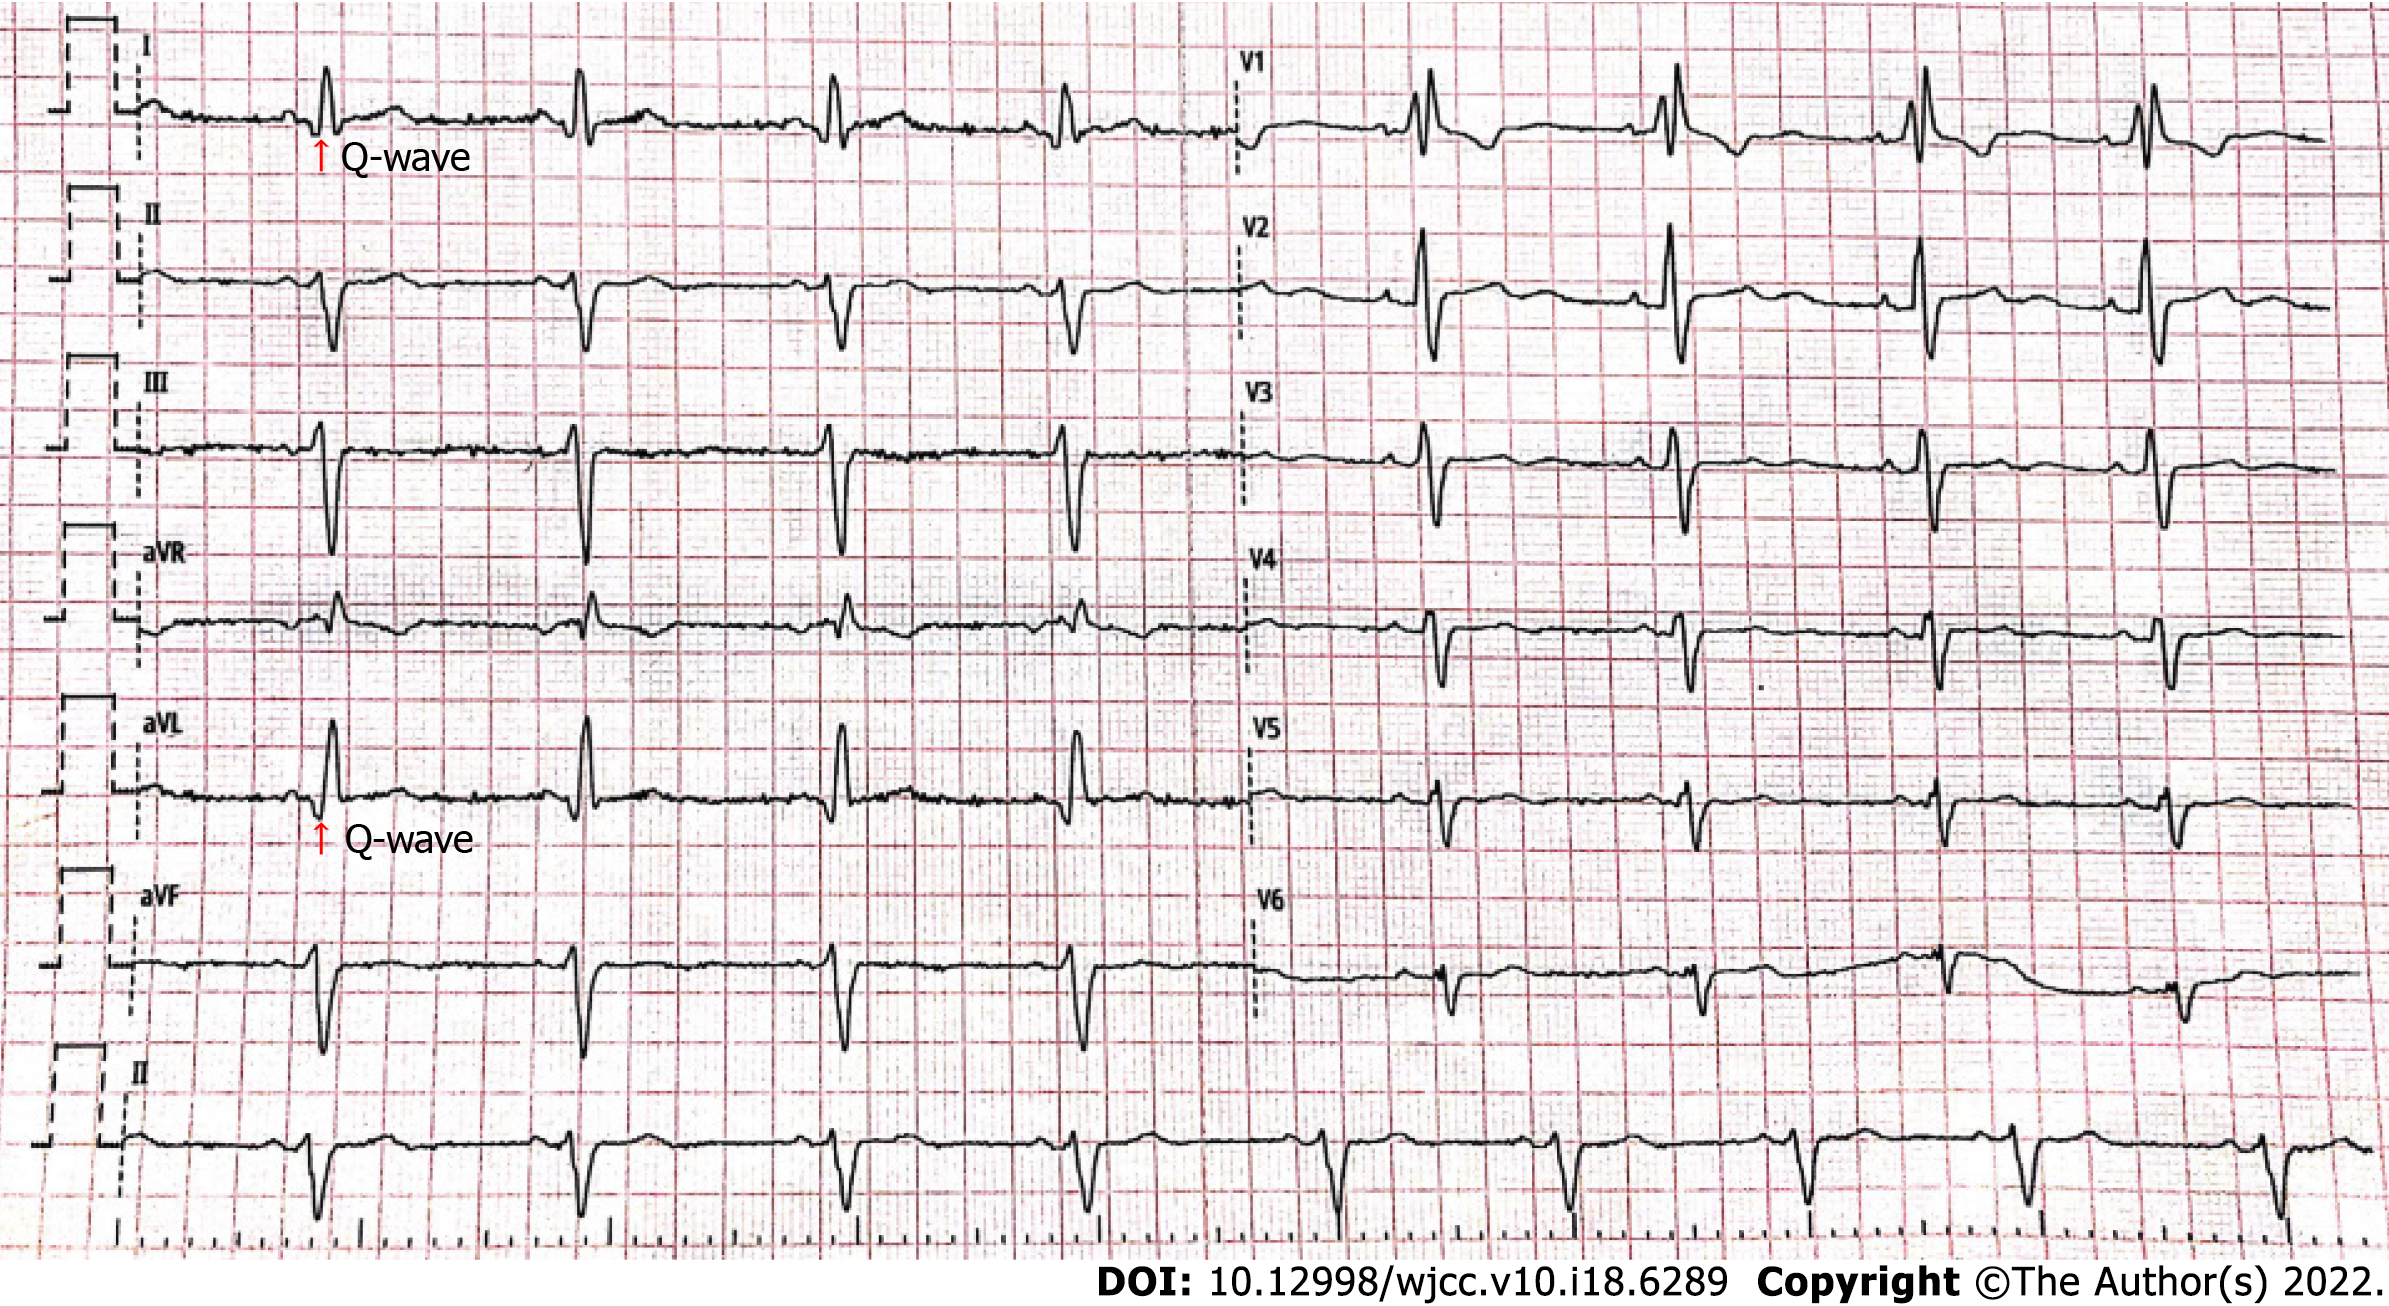
Figure 1 Routine 12-leads electrocardiogram results of the patient under this study.
Electrocardiogram showed left anterior branch block, complete right bundle branch block, high sidewall (I, AVL) abnormal Q wave, and left chest leads low voltage (V4-6) with poor R wave progression.
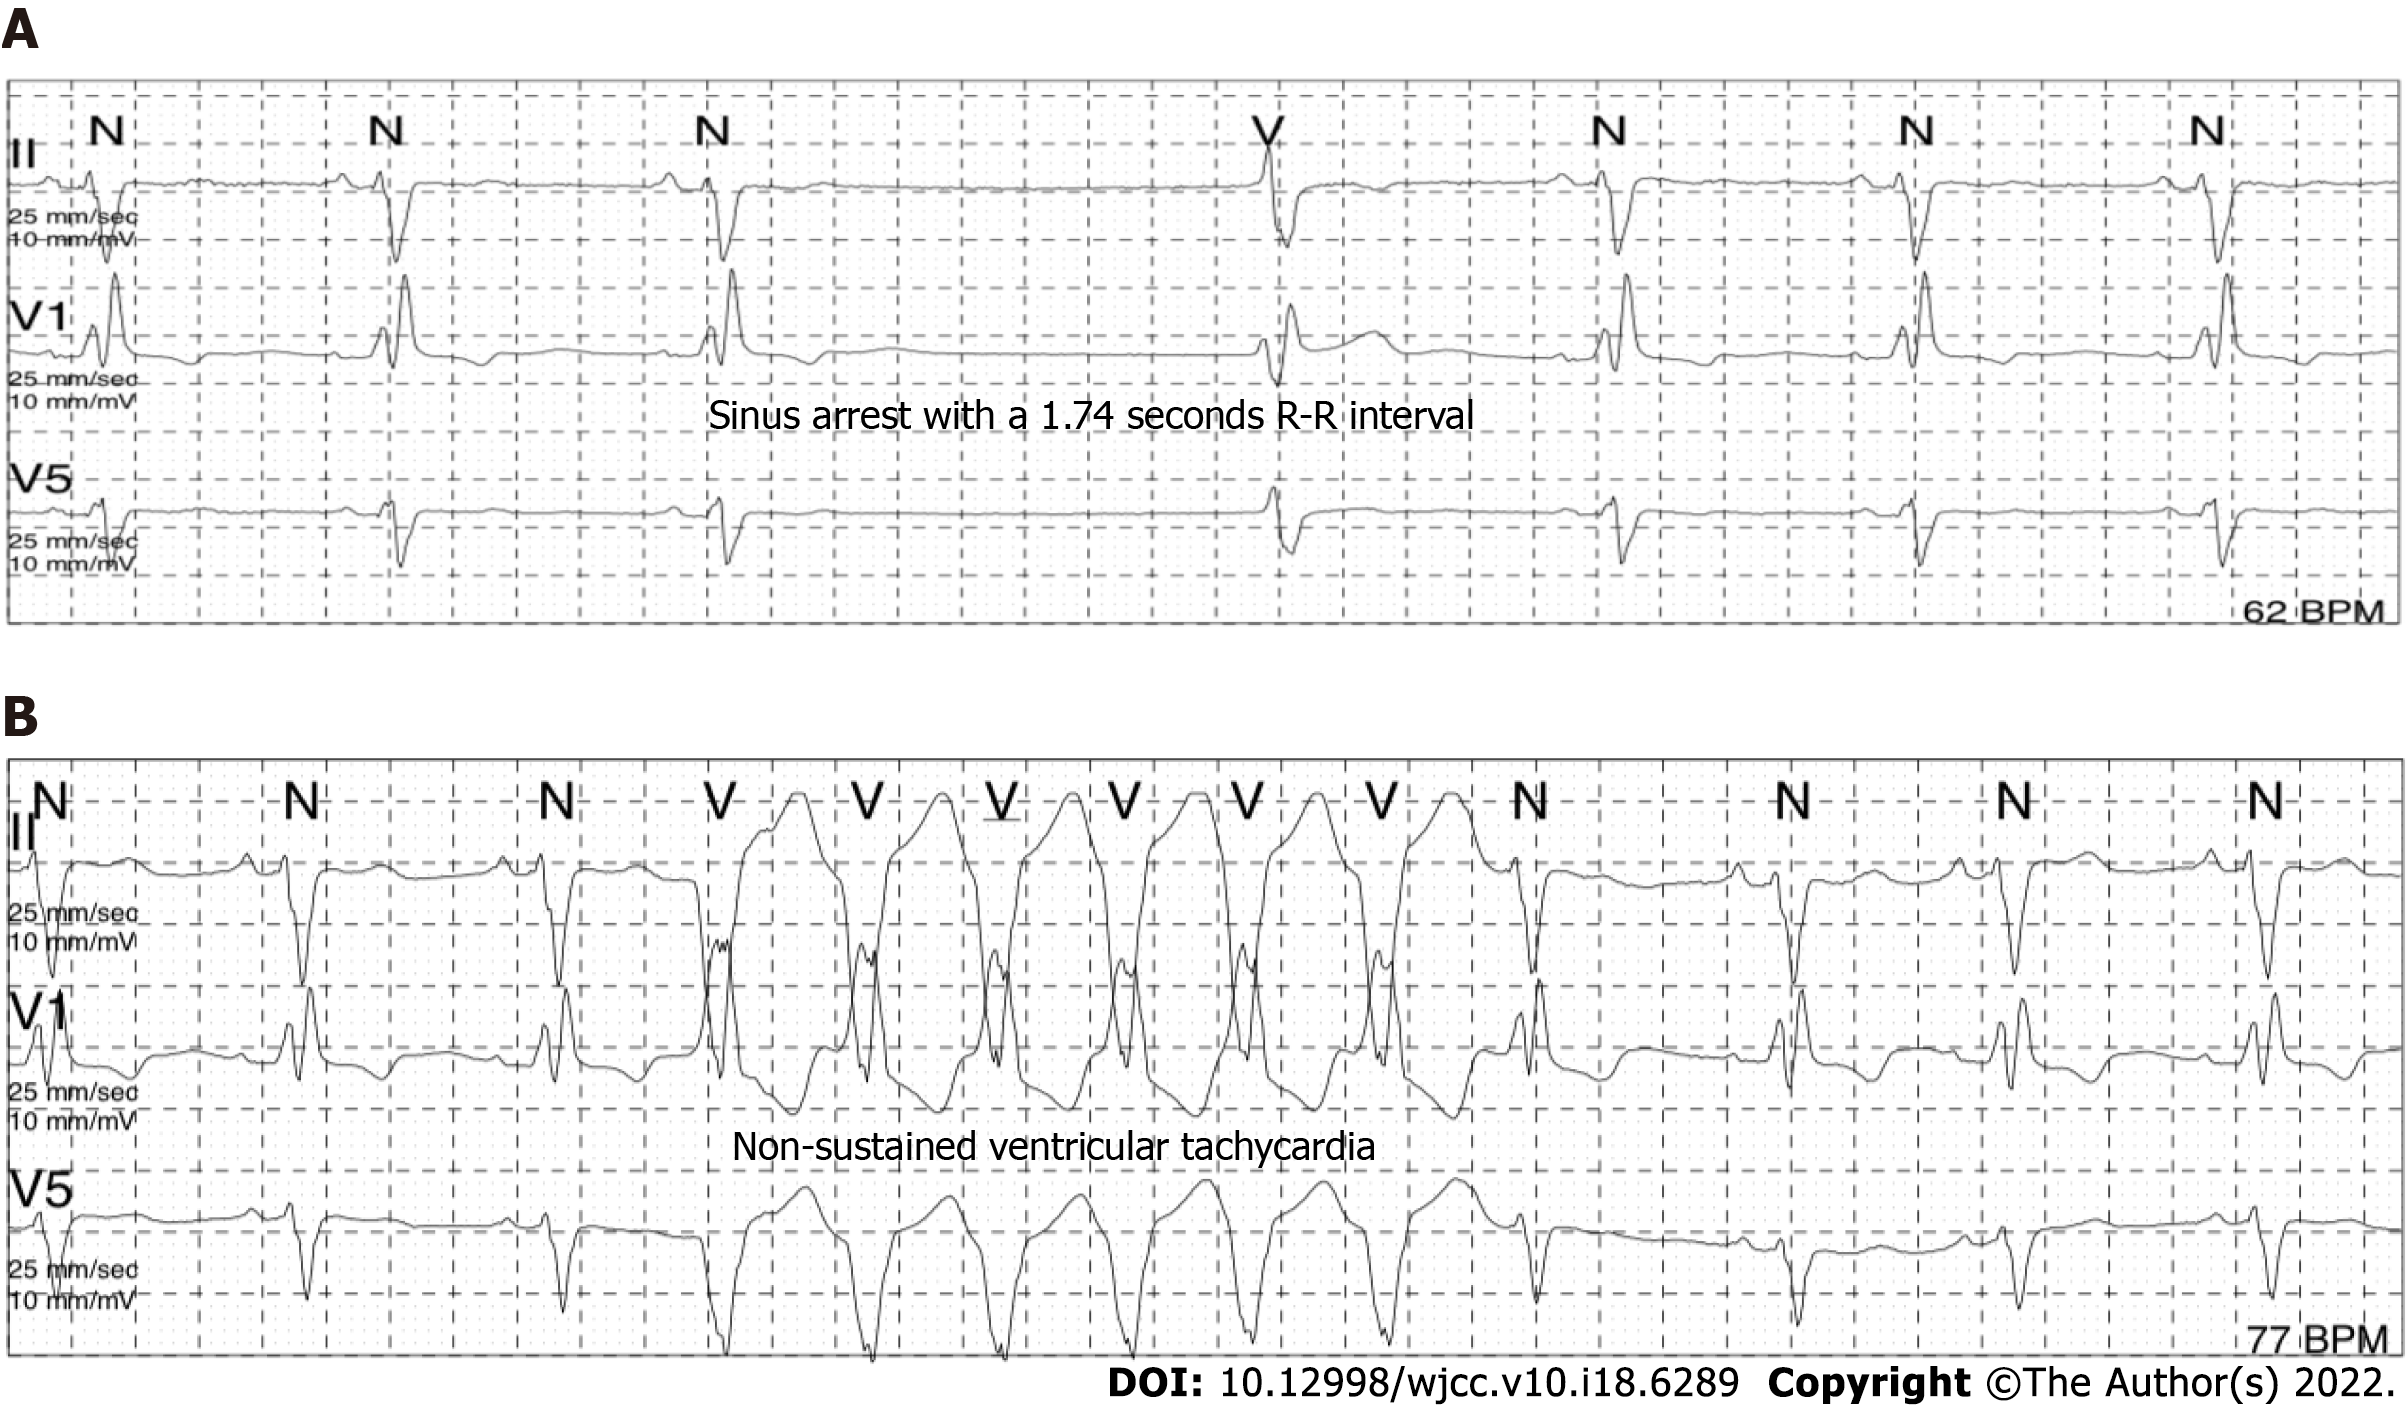
Figure 2 Sinus arrest (A) and ventricular tachycardia (B) recorded in Holter monitoring for this case.
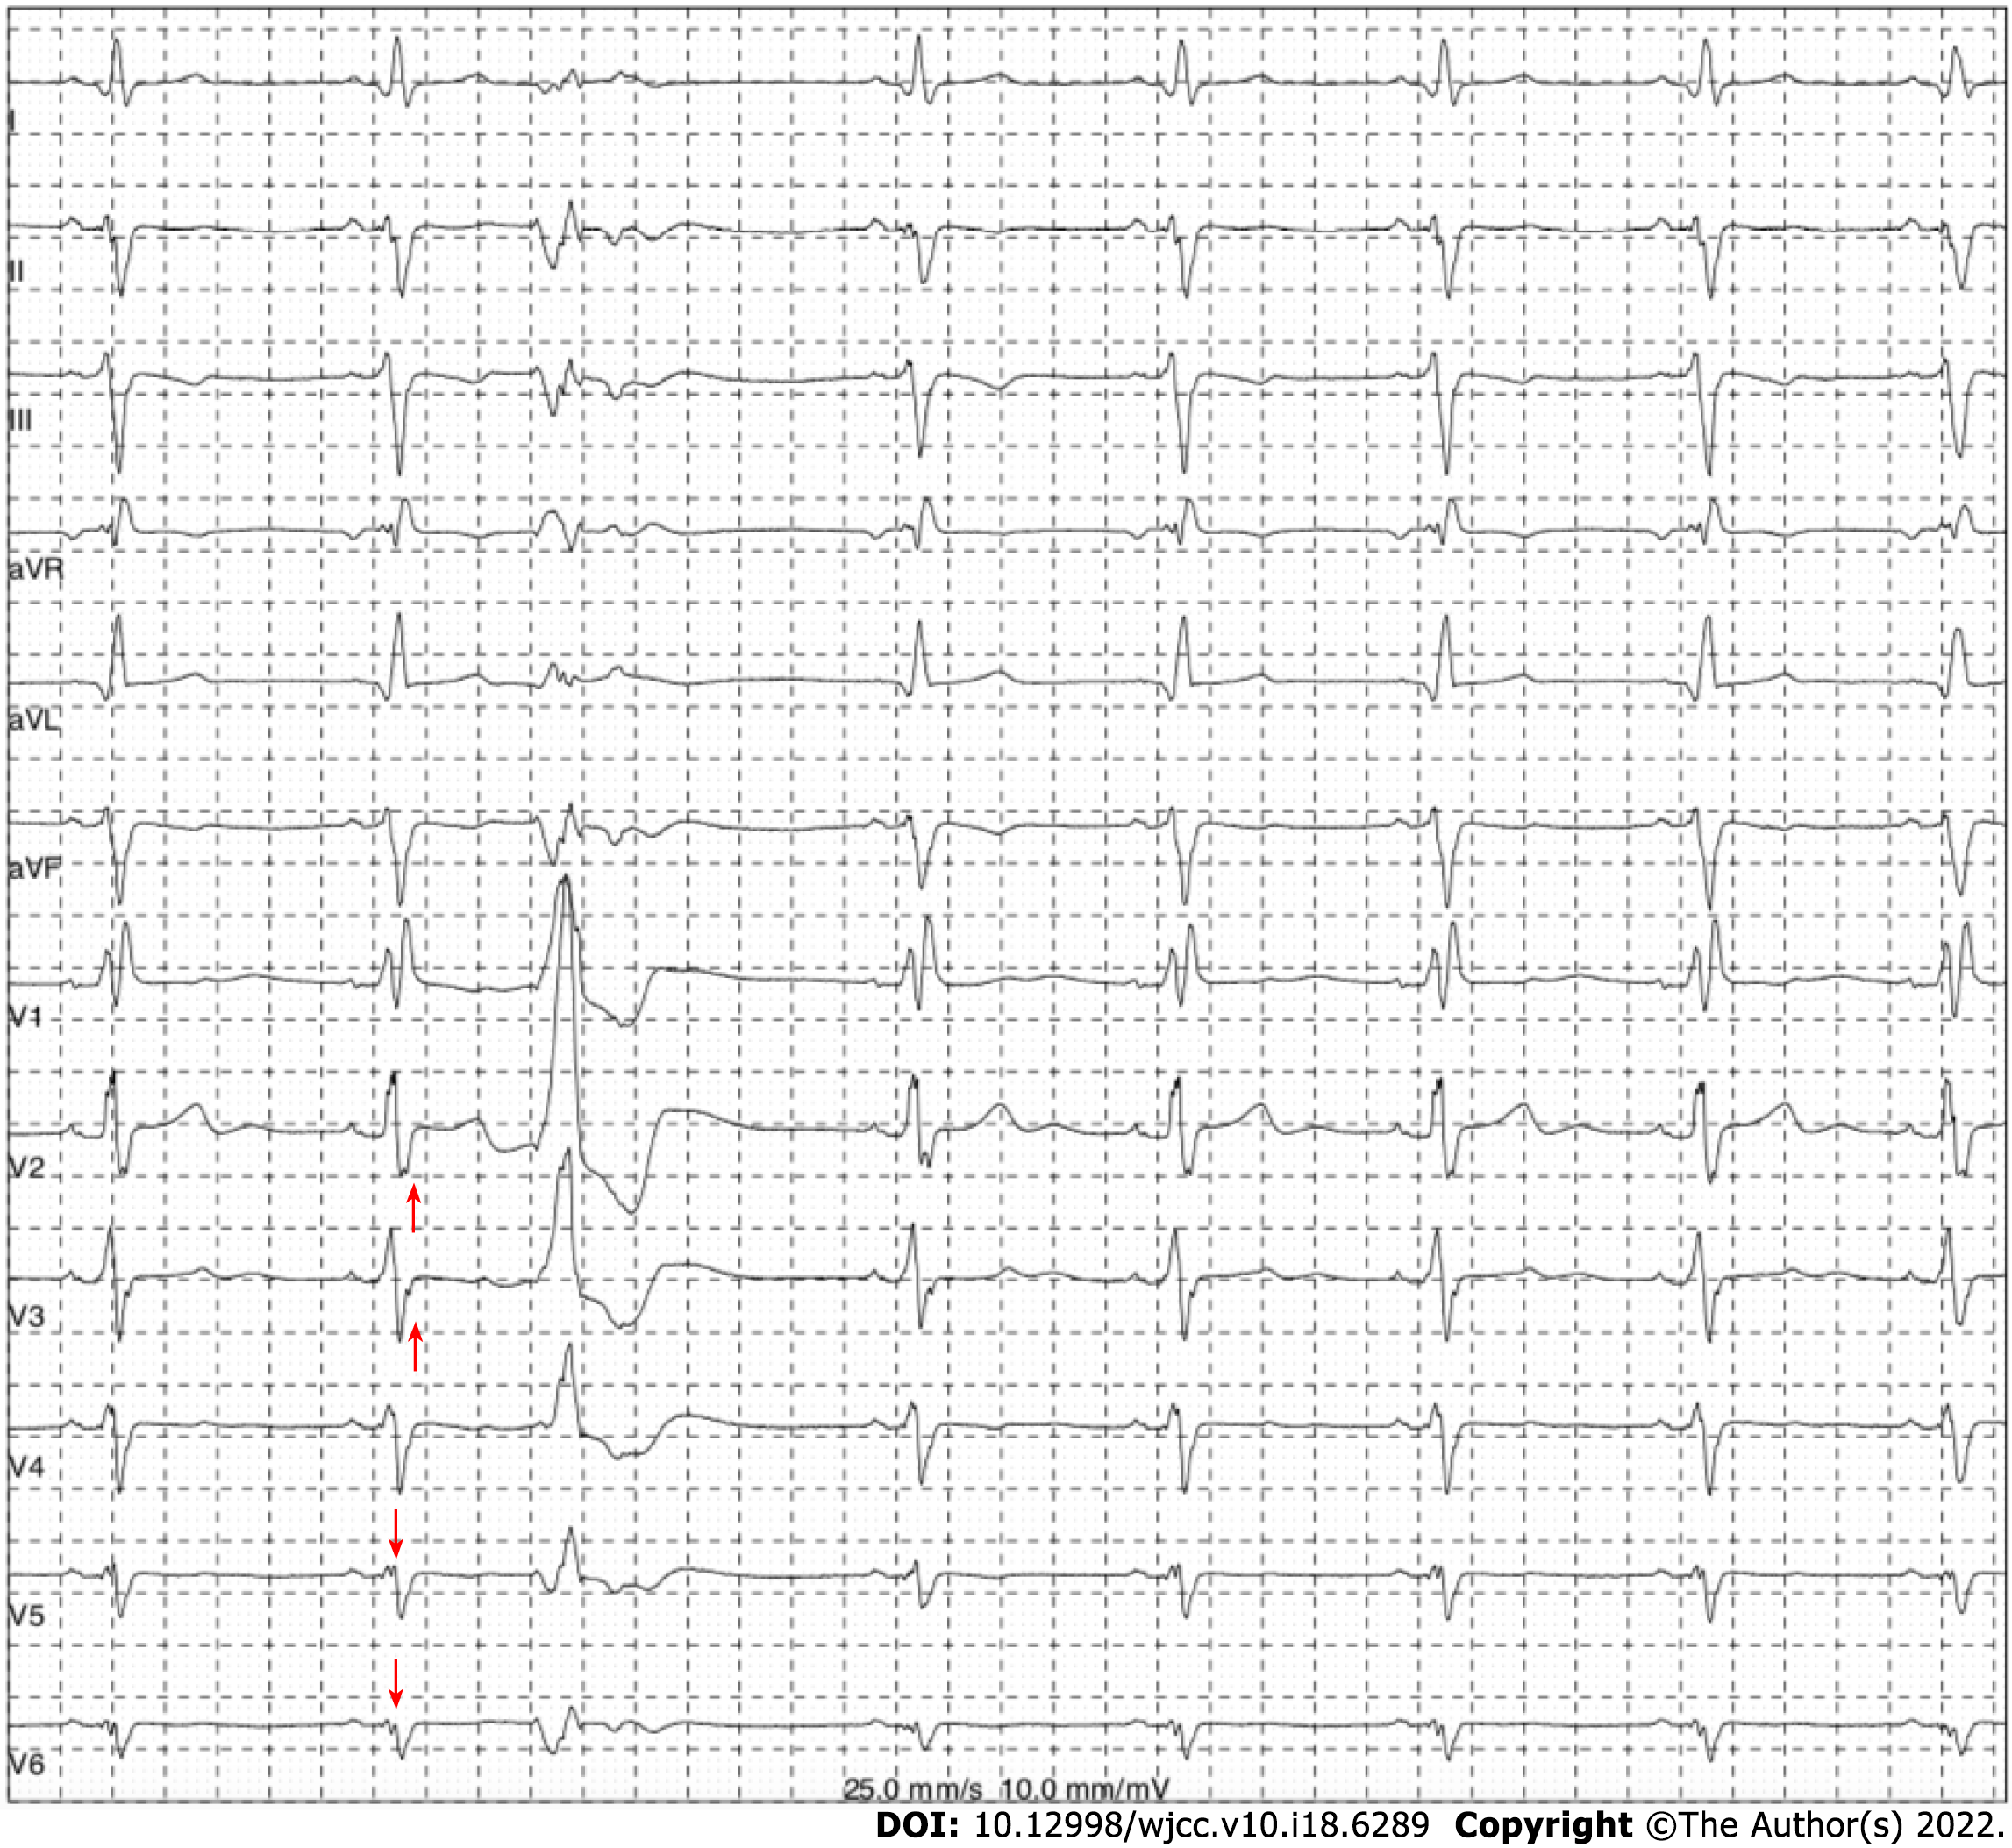
Figure 3 Fragmented QRS and ventricular premature beats recorded in Holter monitoring for this case.
Holter monitoring showed ventricular premature beats with a right bundle branch block pattern and fragmented QRS in leads V3-V6 (marked using red arrows).
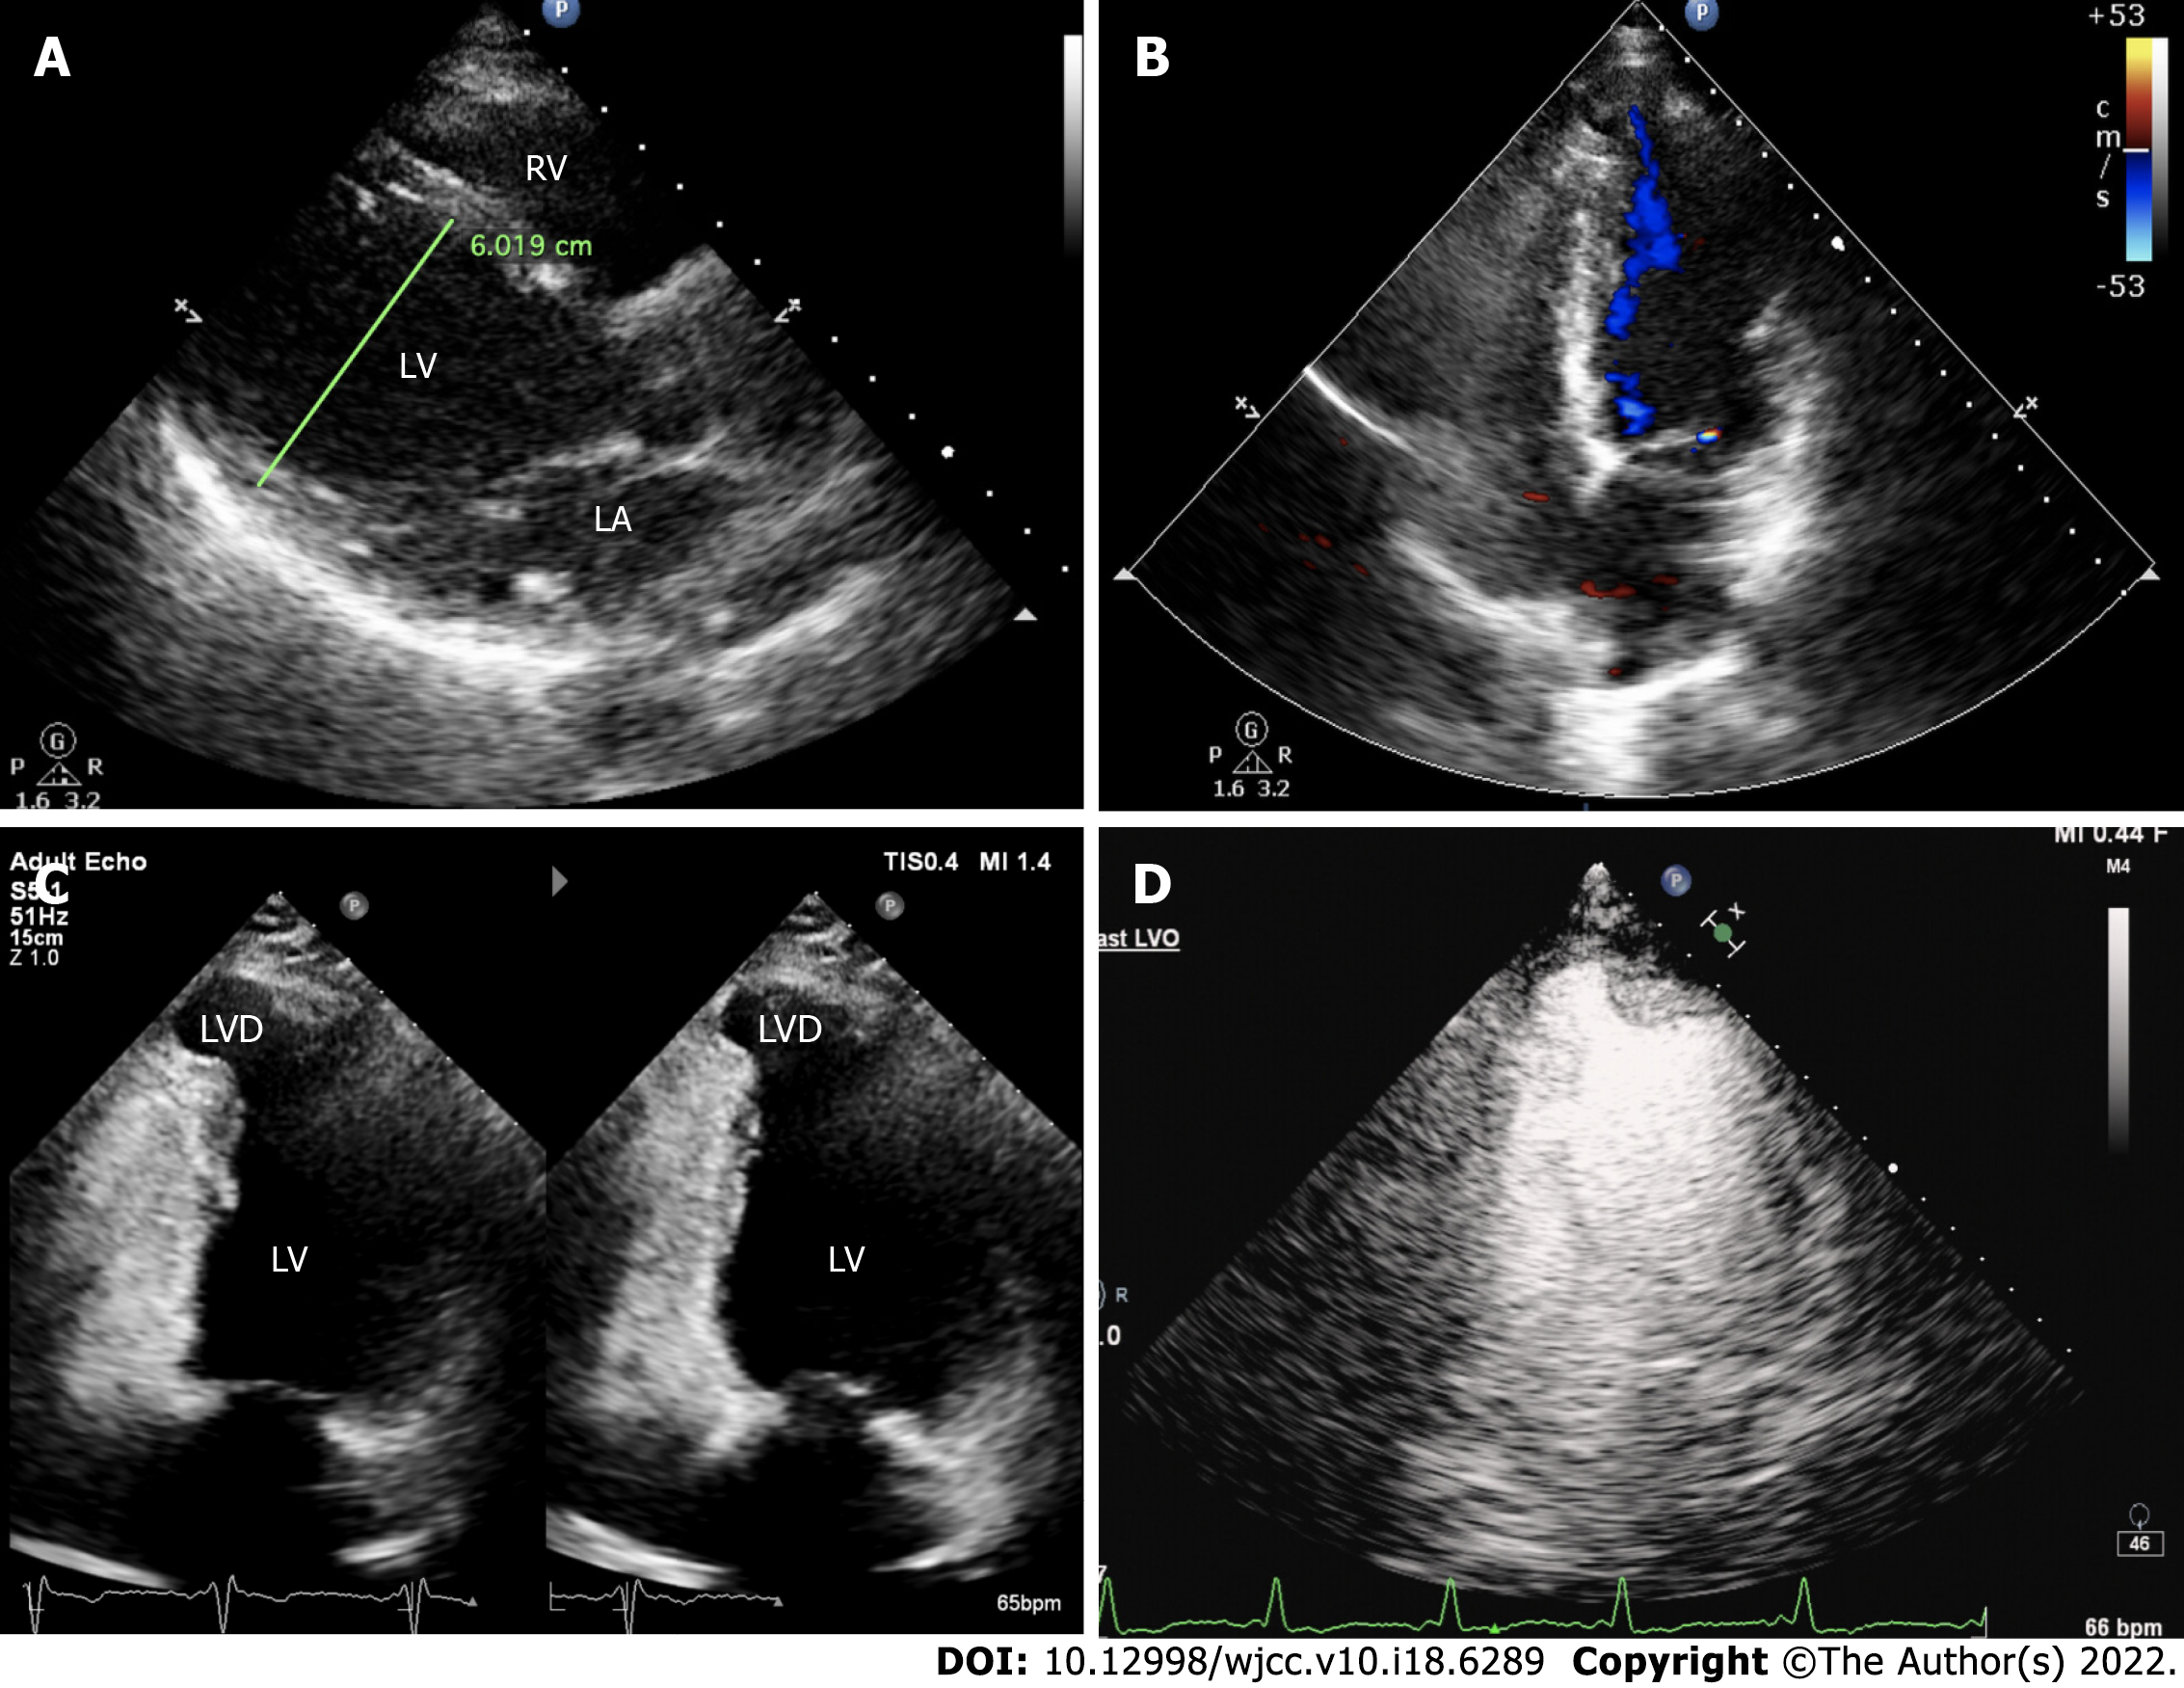
Figure 4 Transthoracic echocardiography results of the patient under this study.
A: Long-axis view of the left ventricle at the end of diastole. The left ventricle was dilated with a diameter of 60 mm; B: Cystic outpouching in the left ventricular apical septum on the apical four-chamber view and intra-cystic blood flow signals were seen during systole; C: Cystic outpouching had an approximate size of 12 mm × 13 mm with a continuous muscle wall, while its activity synchronized with ventricular contraction and diastole; D: Myocardial contrast echocardiograph revealed no obvious filling defect in the cystic structure.
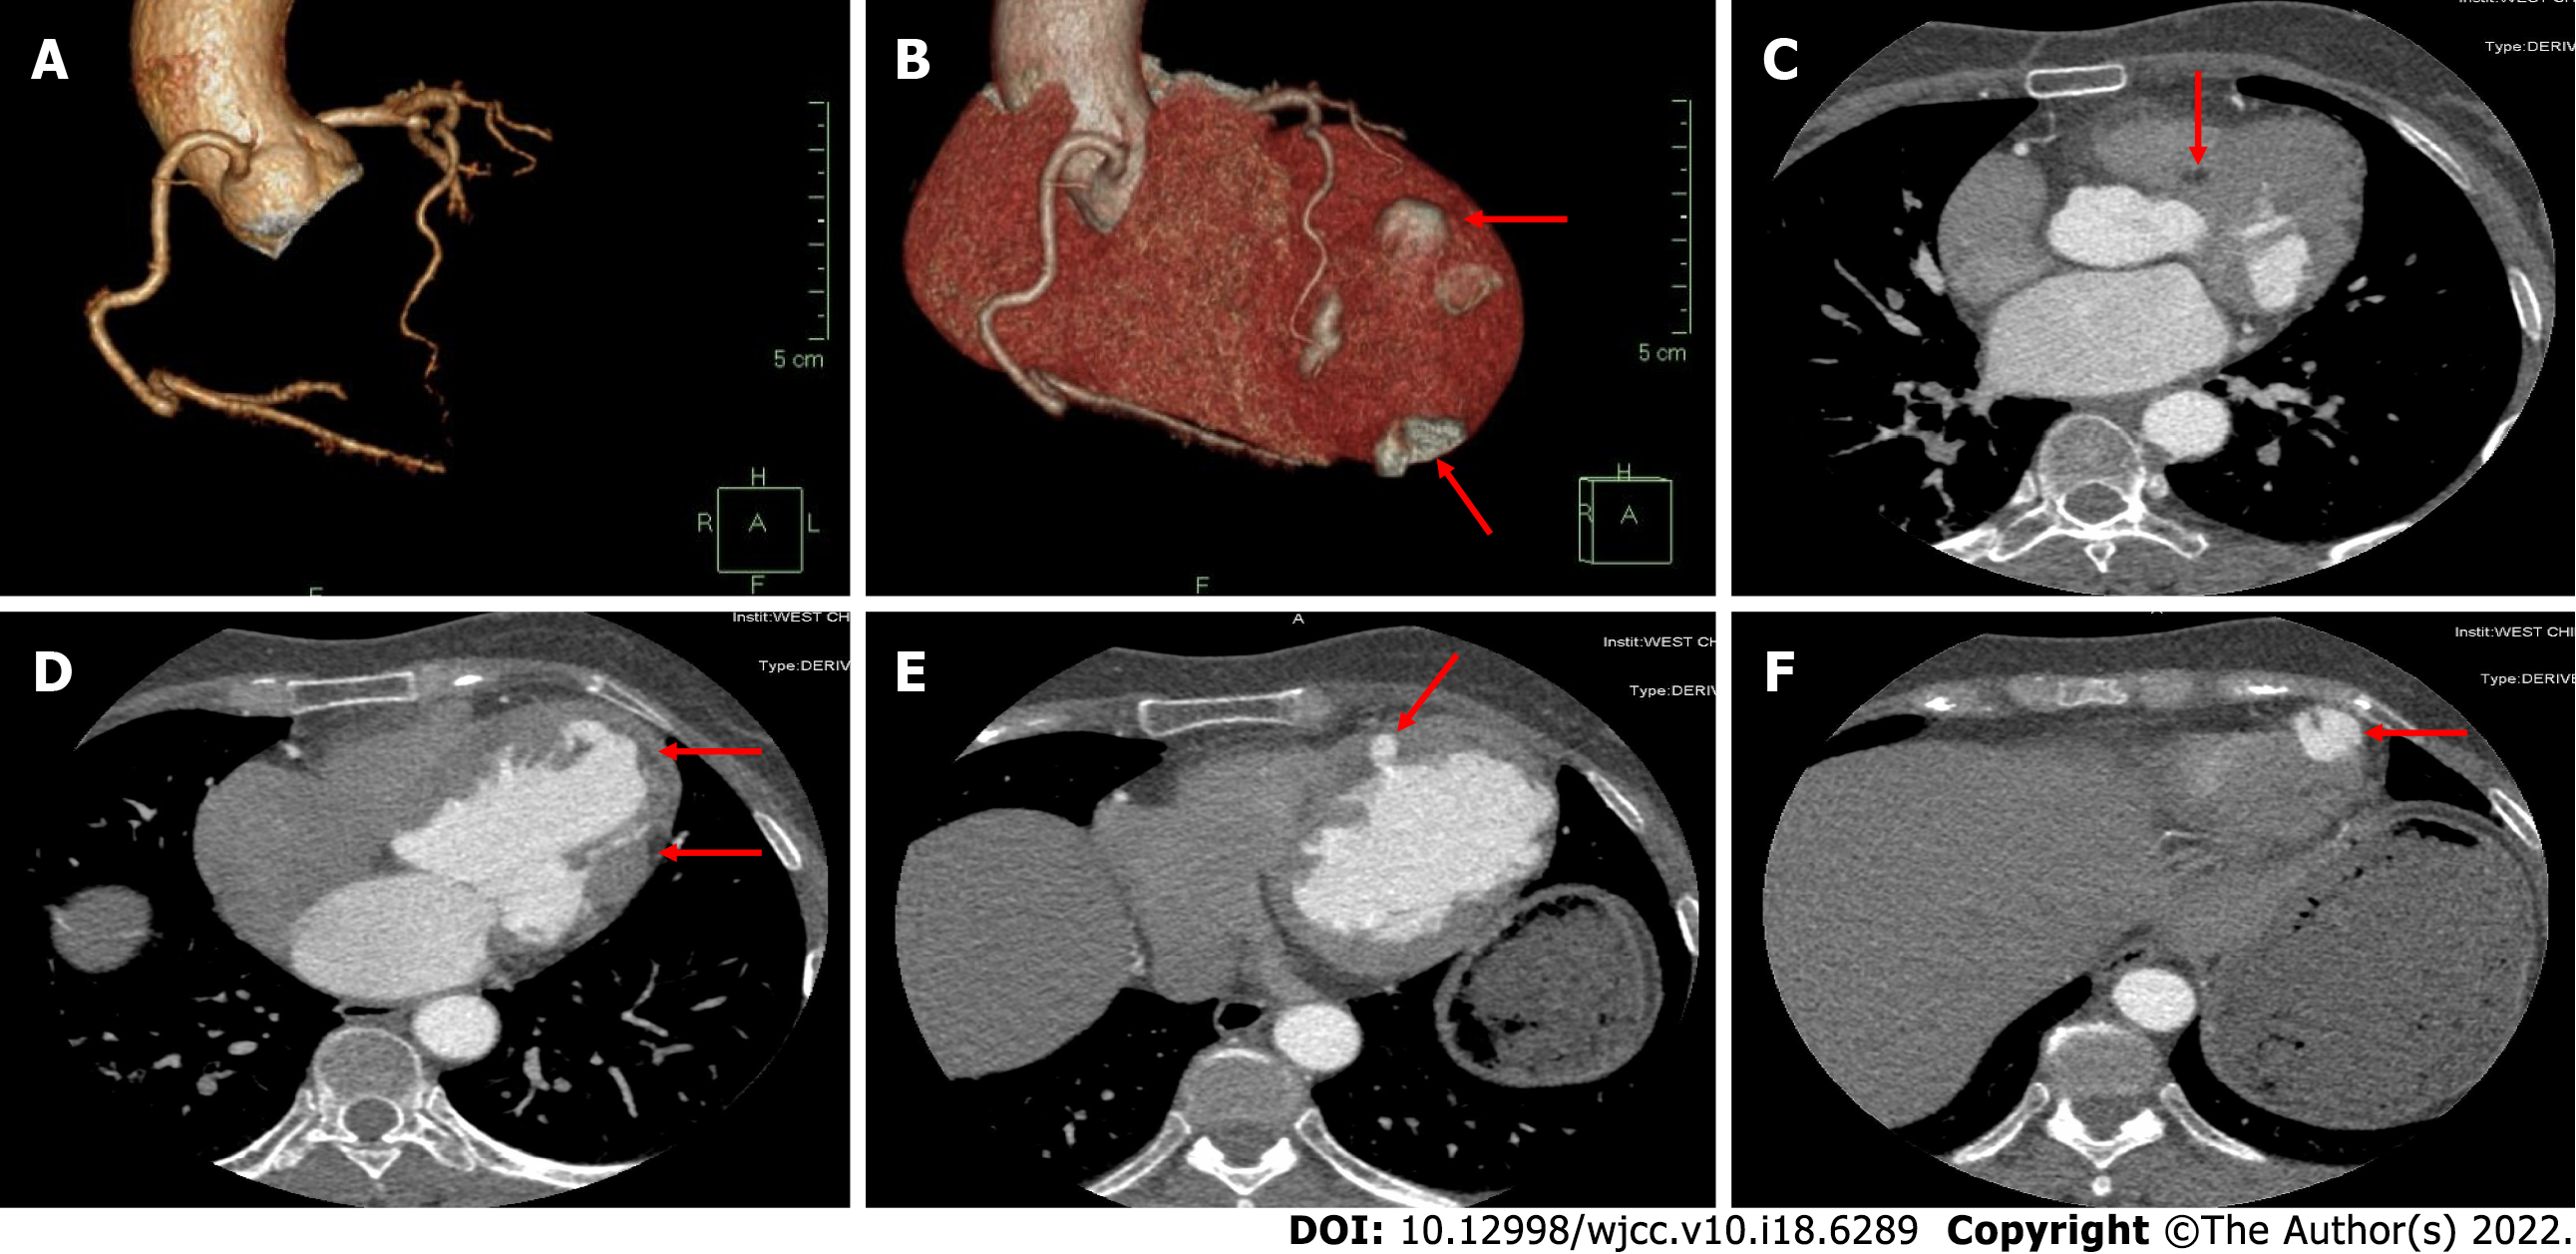
Figure 5 Coronary computerized tomography angiography results of the patient under this study.
A: Three-dimensional reconstruction of coronary arteries and right dominant coronary artery circulation showed no obvious stenosis; B: Three-dimensional reconstruction of the heart showed multiple outpouchings on the left ventricular wall; C: The left ventricular septum myocardium exhibited uneven enhancement. The degree of enhancement is shown by the red arrow and was lower than that of the surrounding tissue, computed tomography value -90 HU; D: Uneven enhancement in the left ventricle free wall myocardium. The degree of enhancement is shown by the red arrow and was lower than that of the surrounding tissue, computed tomography value -114 HU; E: The left ventricular wall exhibited a disordered structure. The uneven thickness of the ventricular wall and local diverticulum is denoted by the red arrow; F: Diverticulum in the apex of the left ventricle is shown by the red arrow.
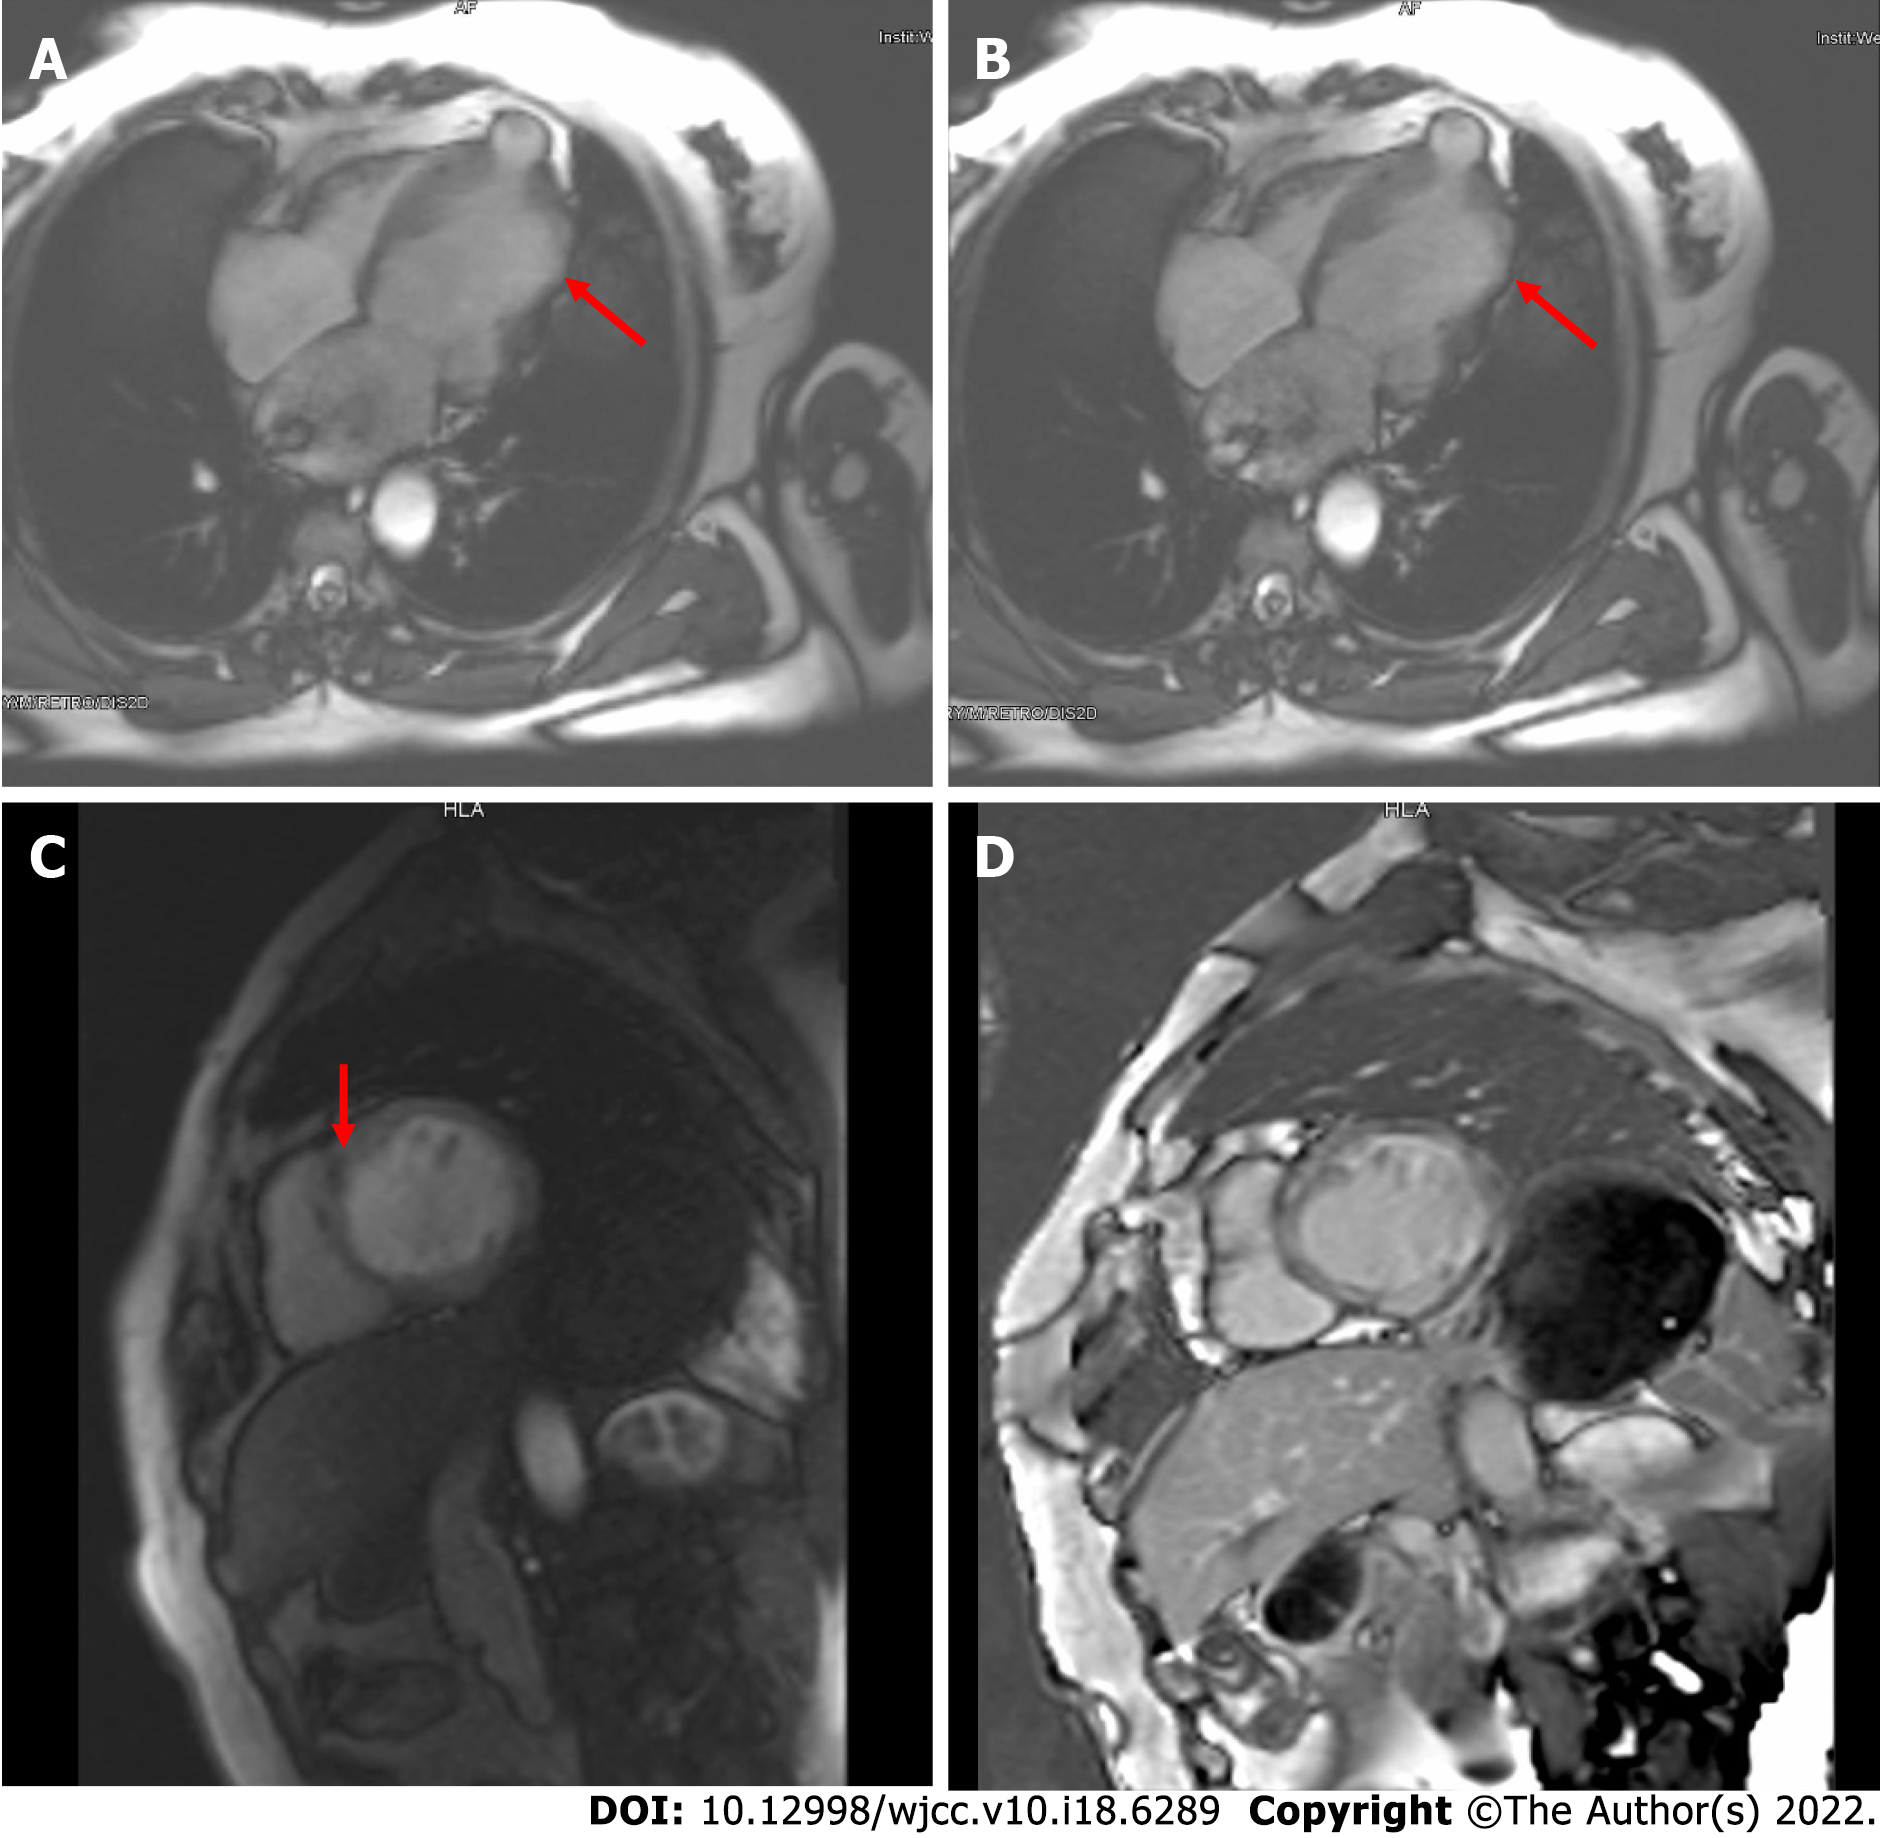
Figure 6 Cardiac magnetic resonance imaging results of the patient under this study.
A and B: Four-chamber cine images at end-diastole (A) and end-systole (B) showed left ventricular dilatation, abnormal activity of the ventricular wall (arrows indicate severely diminished contractility), and outpouching at the left ventricular apex; C: Short-axis first-pass perfusion showed a low signal at the midwall of the septum myocardium; D: Short-axis delayed enhancement imaging demonstrated diffuse stripes of hyperenhancement in the midwall of the left ventricular septum and free wall myocardium.
- Citation: Zhang X, Ye RY, Chen XP. Dilated left ventricle with multiple outpouchings — a severe congenital ventricular diverticulum or left-dominant arrhythmogenic cardiomyopathy: A case report. World J Clin Cases 2022; 10(18): 6289-6297
- URL: https://www.wjgnet.com/2307-8960/full/v10/i18/6289.htm
- DOI: https://dx.doi.org/10.12998/wjcc.v10.i18.6289


