Copyright
©The Author(s) 2022.
World J Clin Cases. Jun 26, 2022; 10(18): 5984-6000
Published online Jun 26, 2022. doi: 10.12998/wjcc.v10.i18.5984
Published online Jun 26, 2022. doi: 10.12998/wjcc.v10.i18.5984
Figure 1 Identification of differentially expressed genes and Weighted Gene Co-expression Network Analysis.
A: The differentially expressed genes analyzed in The Cancer Genome Atlas dataset. Top 30 upregulated and downregulated genes are shown; B and C: Soft-threshold power analysis revealed the scale-free fit index and the mean connectivity of network topology; D: Hierarchical cluster analysis of the coexpression module based on the dissimilarity measurement; E: Sample clustering based on expression data used to detect the outliers; F: Dendrogram of consensus module eigen genes. Groups of eigen genes below the red line merged owing to their similarity; G: The topological overlap matrix heatmap showing the overlap between the co-expression genes.
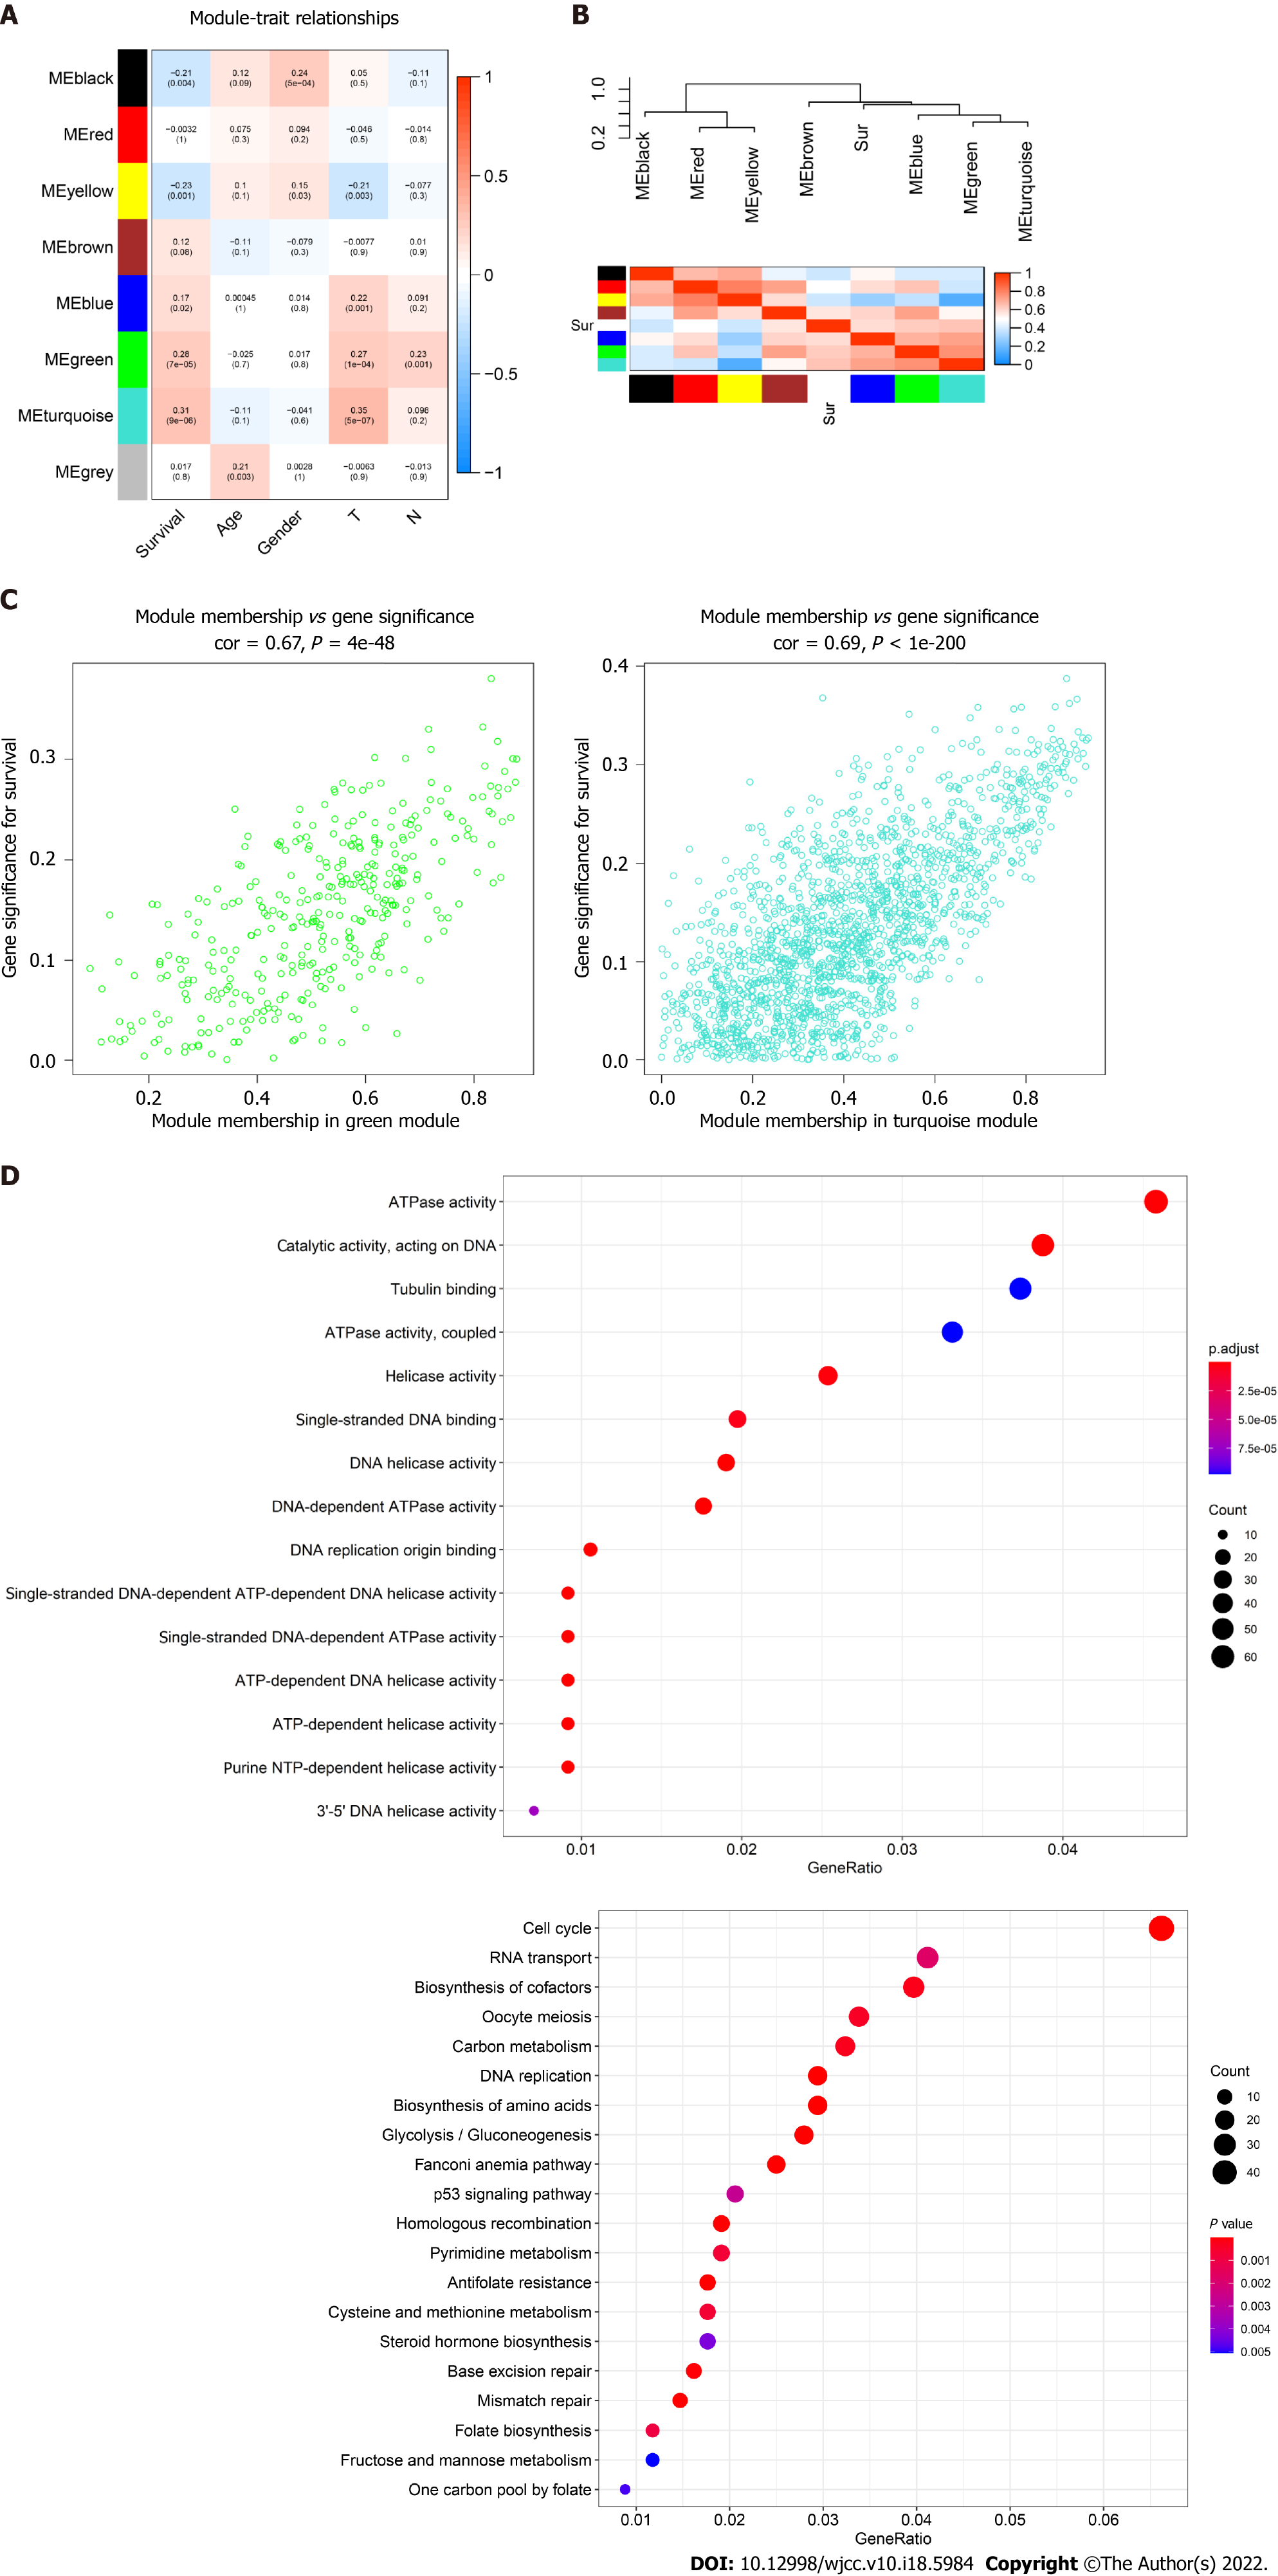
Figure 2 Identification of highly correlated gene modules by Weighted Gene Co-expression Network Analysis.
A: Correlation between eight module genes and the clinical features. Turquoise module indicating a high correlation with the patient’s overall survival (P < 0.001, r = 0.31); B: Heatmap plot showing the adjacent modules and survival traits; C: The gene signature and module membership of turquoise and green modules; D: Significantly enriched Gene Ontology items and the Kyoto Encyclopedia of Genes and Genomes pathways in turquoise module with top 20 count number of genes shown.
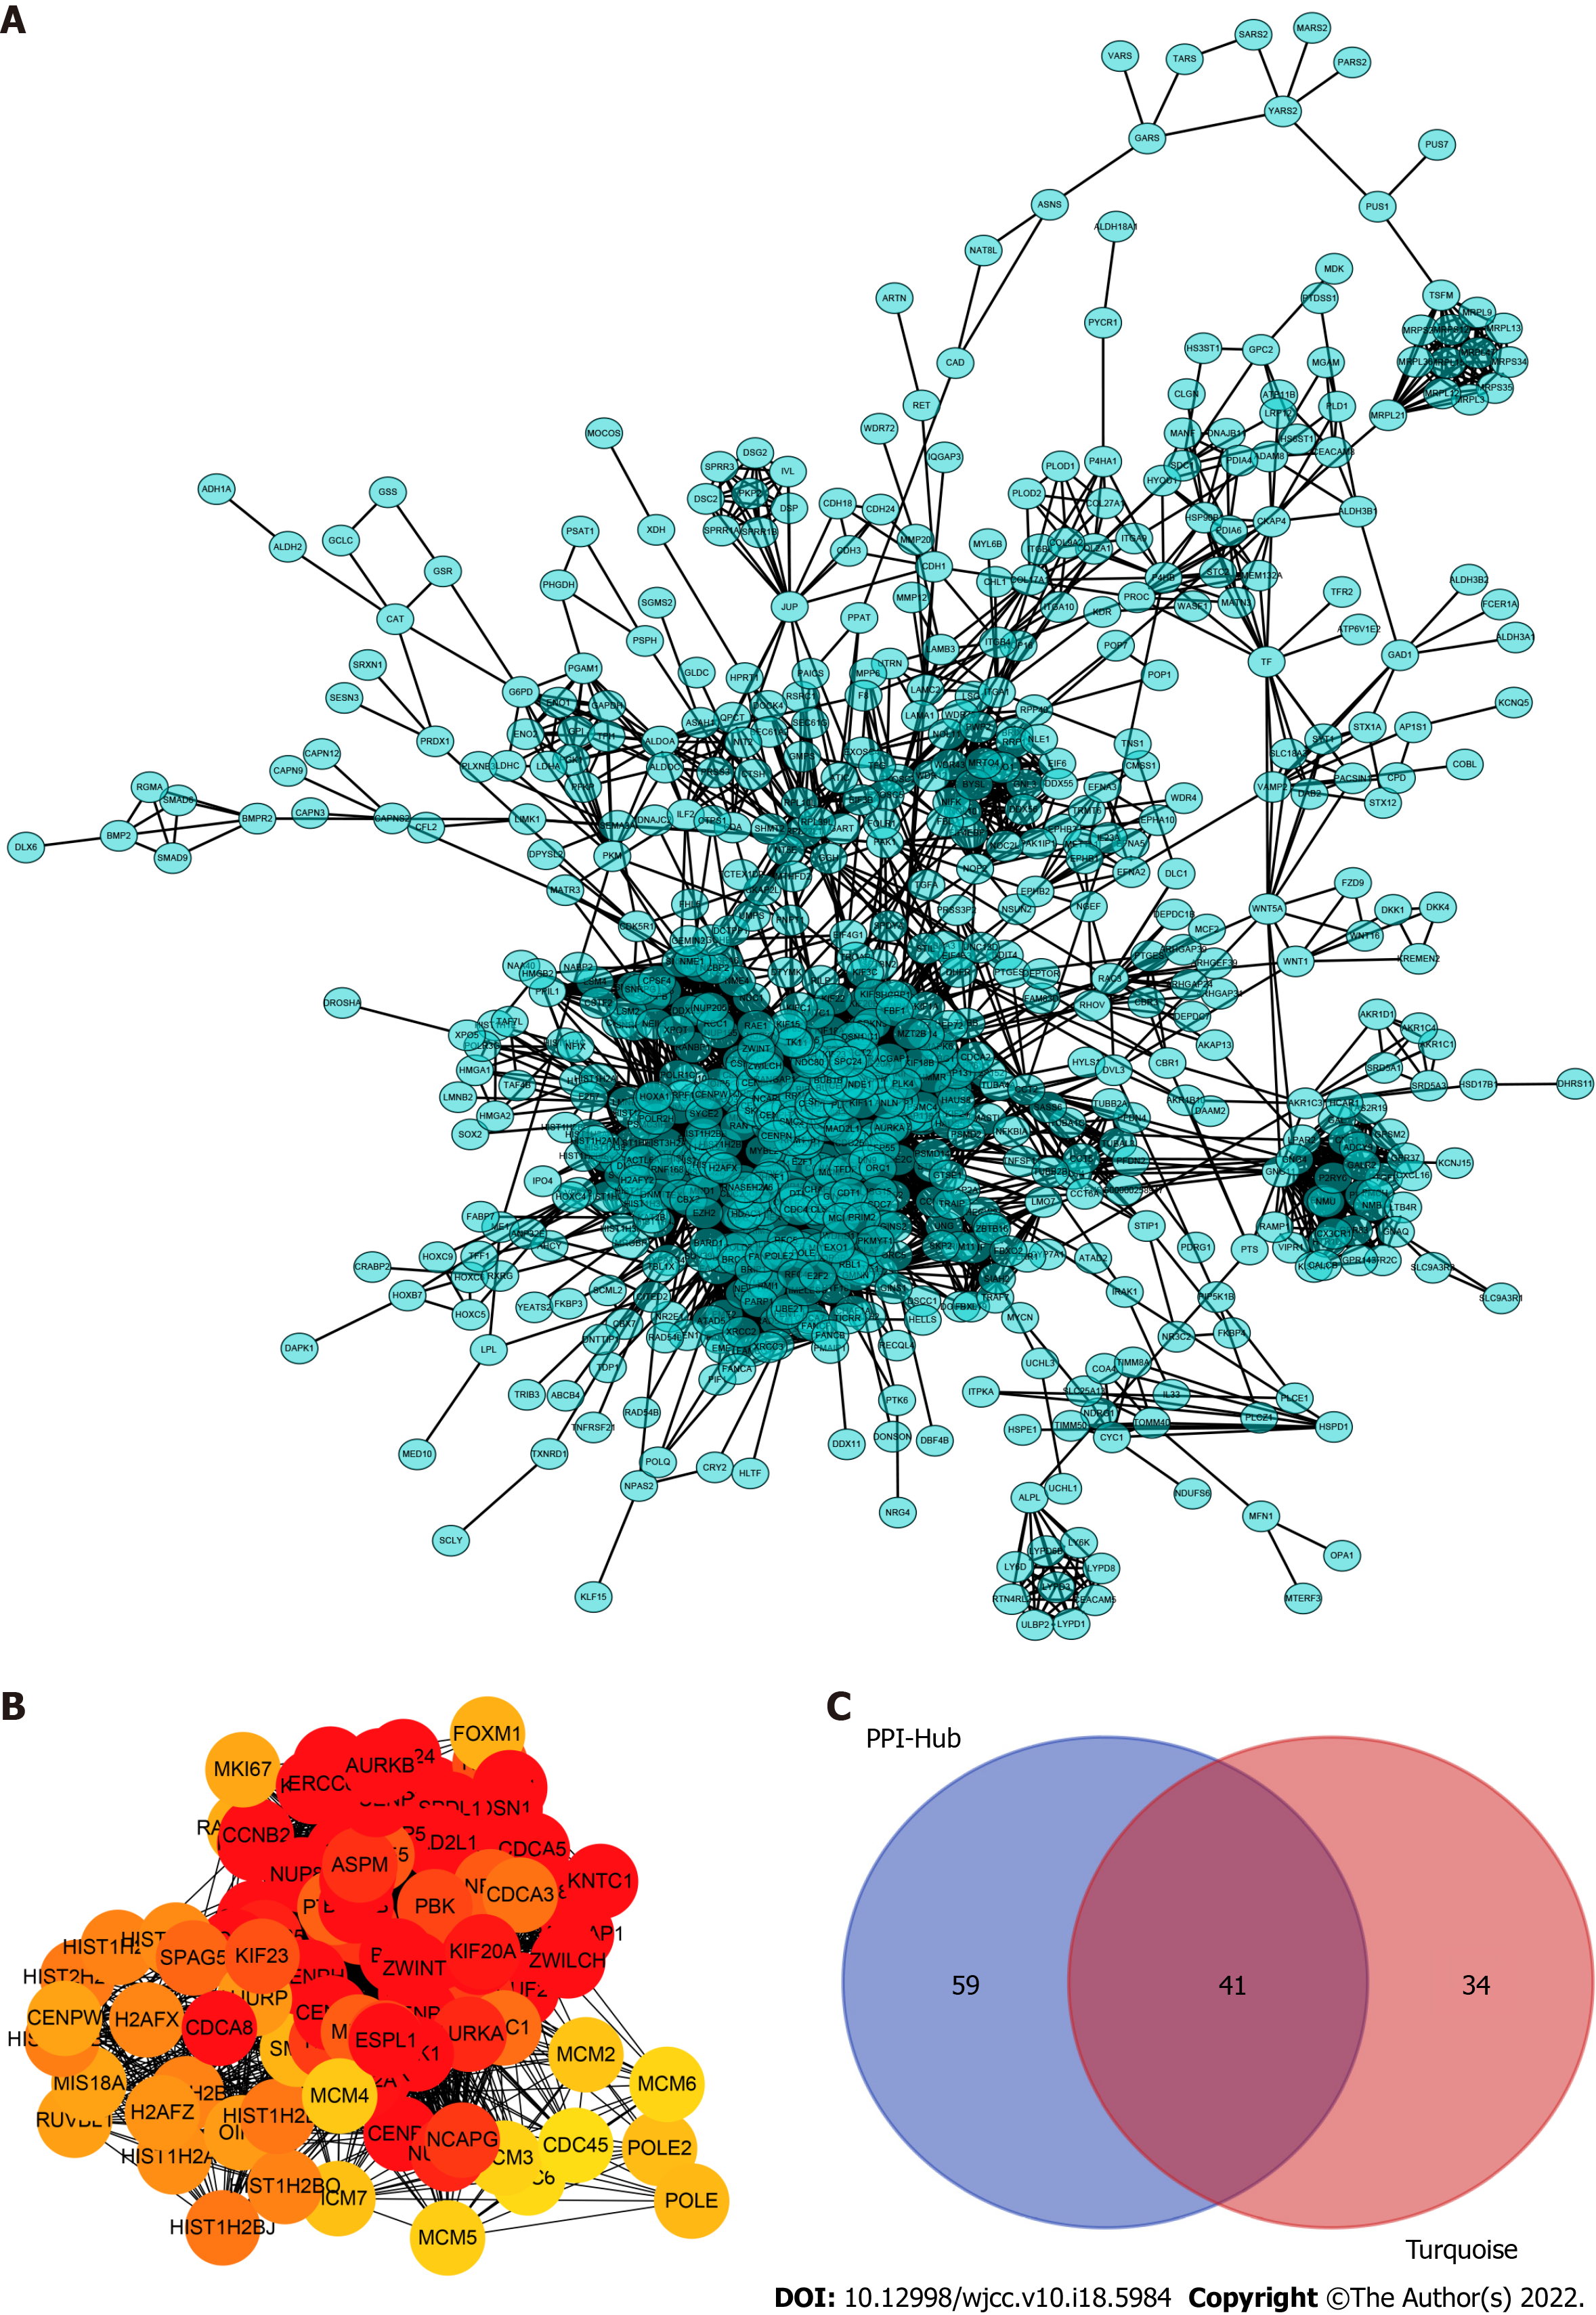
Figure 3 Construction of the protein–protein interaction networks of turquoise module genes and the selected hub genes.
A: Network of all turquoise module genes excluding the low connectivity genes; B: The cytohubba algorithm used to identify the top 100 hub genes located in the core area of the turquoise module; C: Venn diagram showing an overlap between the protein–protein interaction hub and gene signature/module membership-key genes in the turquoise module. A total of 41 real hub genes finally selected for further analyses.
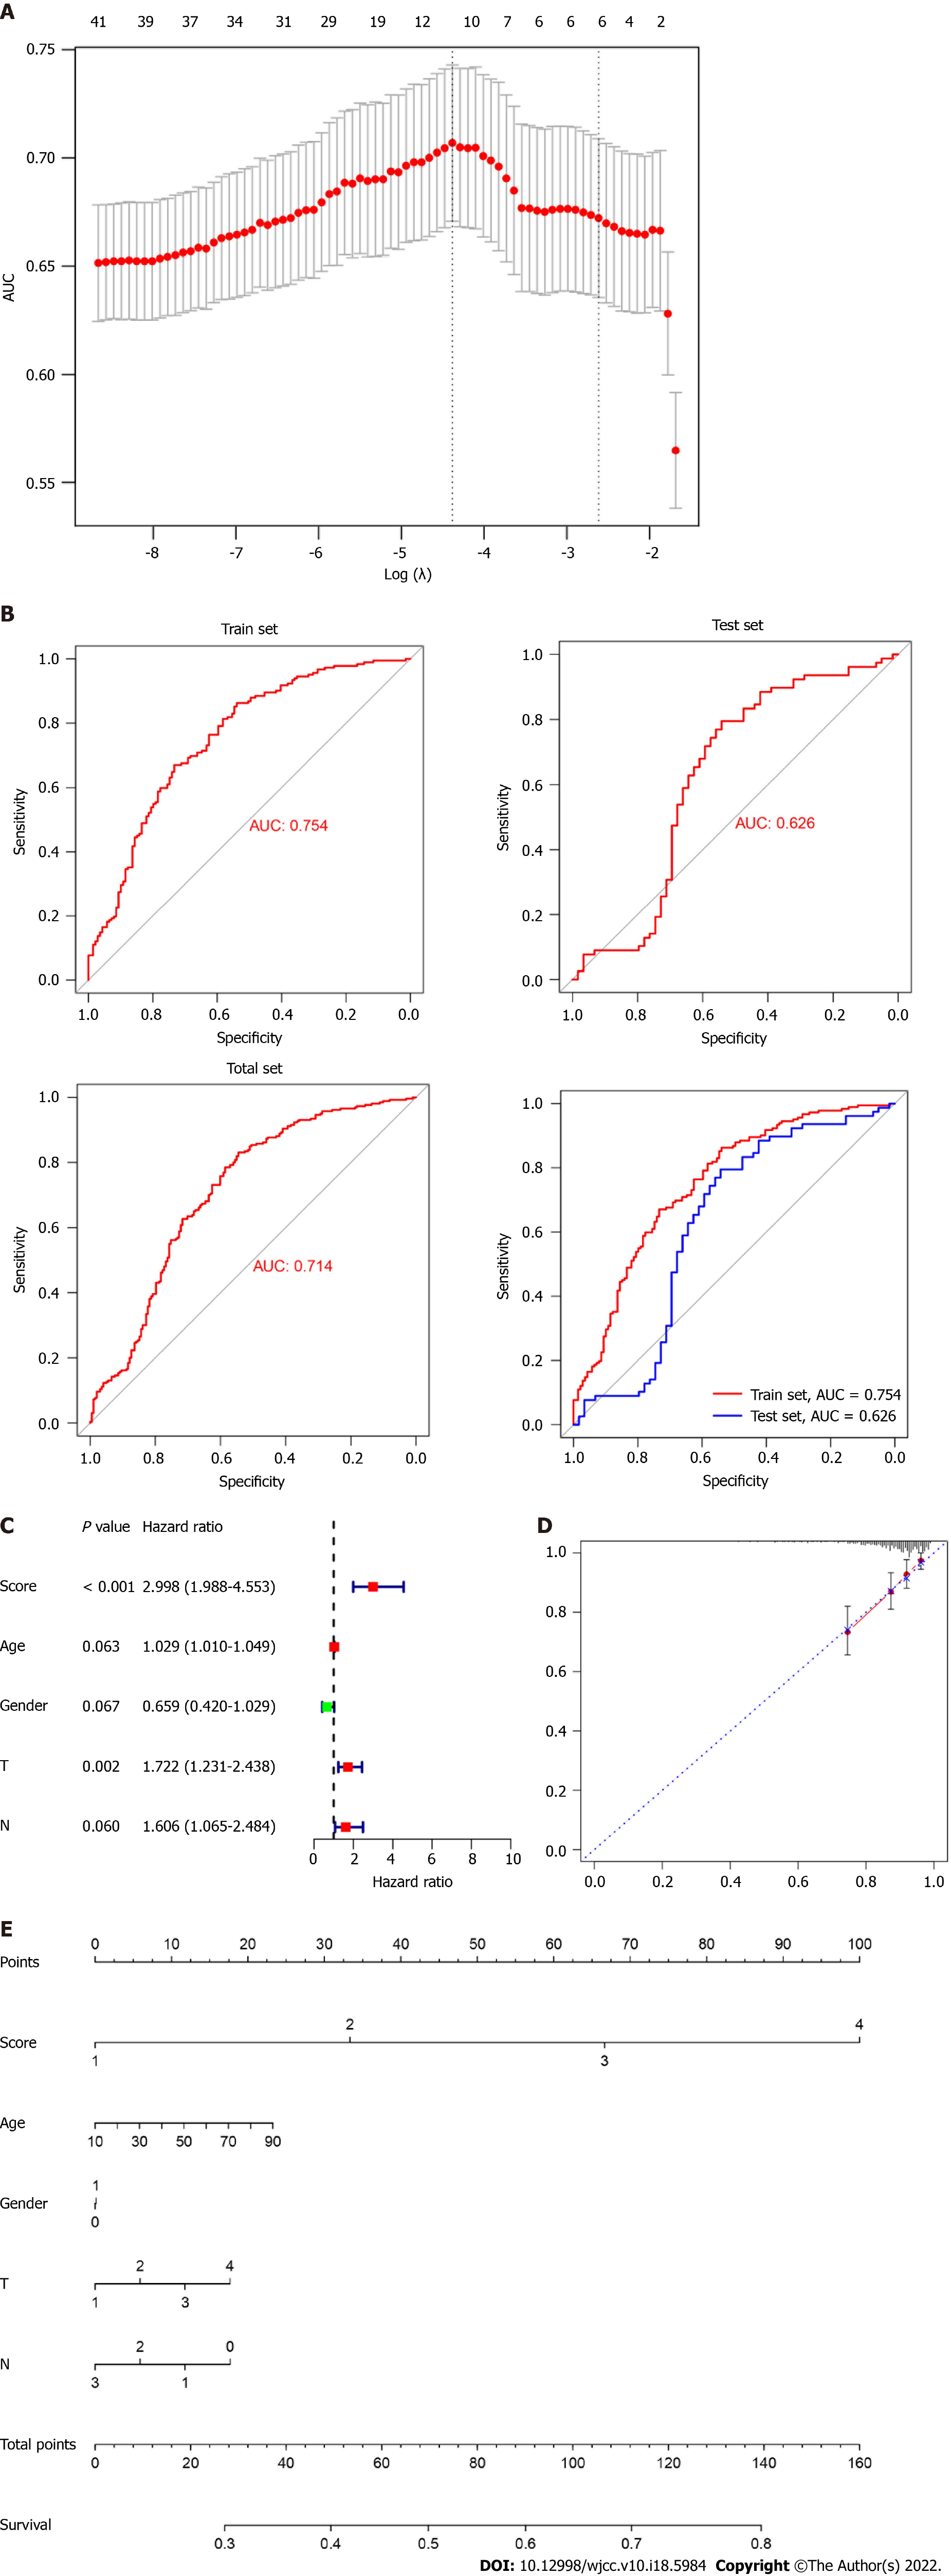
Figure 4 Construction of a prognostic predictive model using real hub genes.
A: Area under the curve measurement performed to select the optimal candidate genes for the scoring system construction; B: Receiver operating characteristic curve showing the prediction efficiency of the scoring system in the training, test, and all dataset; C: Risk-score served as an independent risk factor in predicting patients’ survival; D and E: Development of nomograms and calibration curves for prognosis in the total dataset.
Figure 5 Expression and survival curve of 11 genes in The Cancer Genome Atlas dataset and the validation of the 11 genes’ expression by immunohistochemistry and quantitative real-time polymerase chain reaction analyses.
A: Expression of 11 genes in The Cancer Genome Atlas (TCGA) dataset; B: Correlation of 11 genes and the survival rate in the TCGA dataset; C: Expression profile of 11 genes in tumor tissues obtained from the Protein Atlas database; D: Quantitative real-time polymerase chain reaction analysis indicating the expression of 11 genes in lung cancer cell lines when compared with that in normal lung bronchial cells. aP < 0.05, bP < 0.01.
- Citation: Zhong C, Liang Y, Wang Q, Tan HW, Liang Y. Construction and validation of a novel prediction system for detection of overall survival in lung cancer patients. World J Clin Cases 2022; 10(18): 5984-6000
- URL: https://www.wjgnet.com/2307-8960/full/v10/i18/5984.htm
- DOI: https://dx.doi.org/10.12998/wjcc.v10.i18.5984


