Copyright
©The Author(s) 2022.
World J Clin Cases. Jun 6, 2022; 10(16): 5394-5399
Published online Jun 6, 2022. doi: 10.12998/wjcc.v10.i16.5394
Published online Jun 6, 2022. doi: 10.12998/wjcc.v10.i16.5394
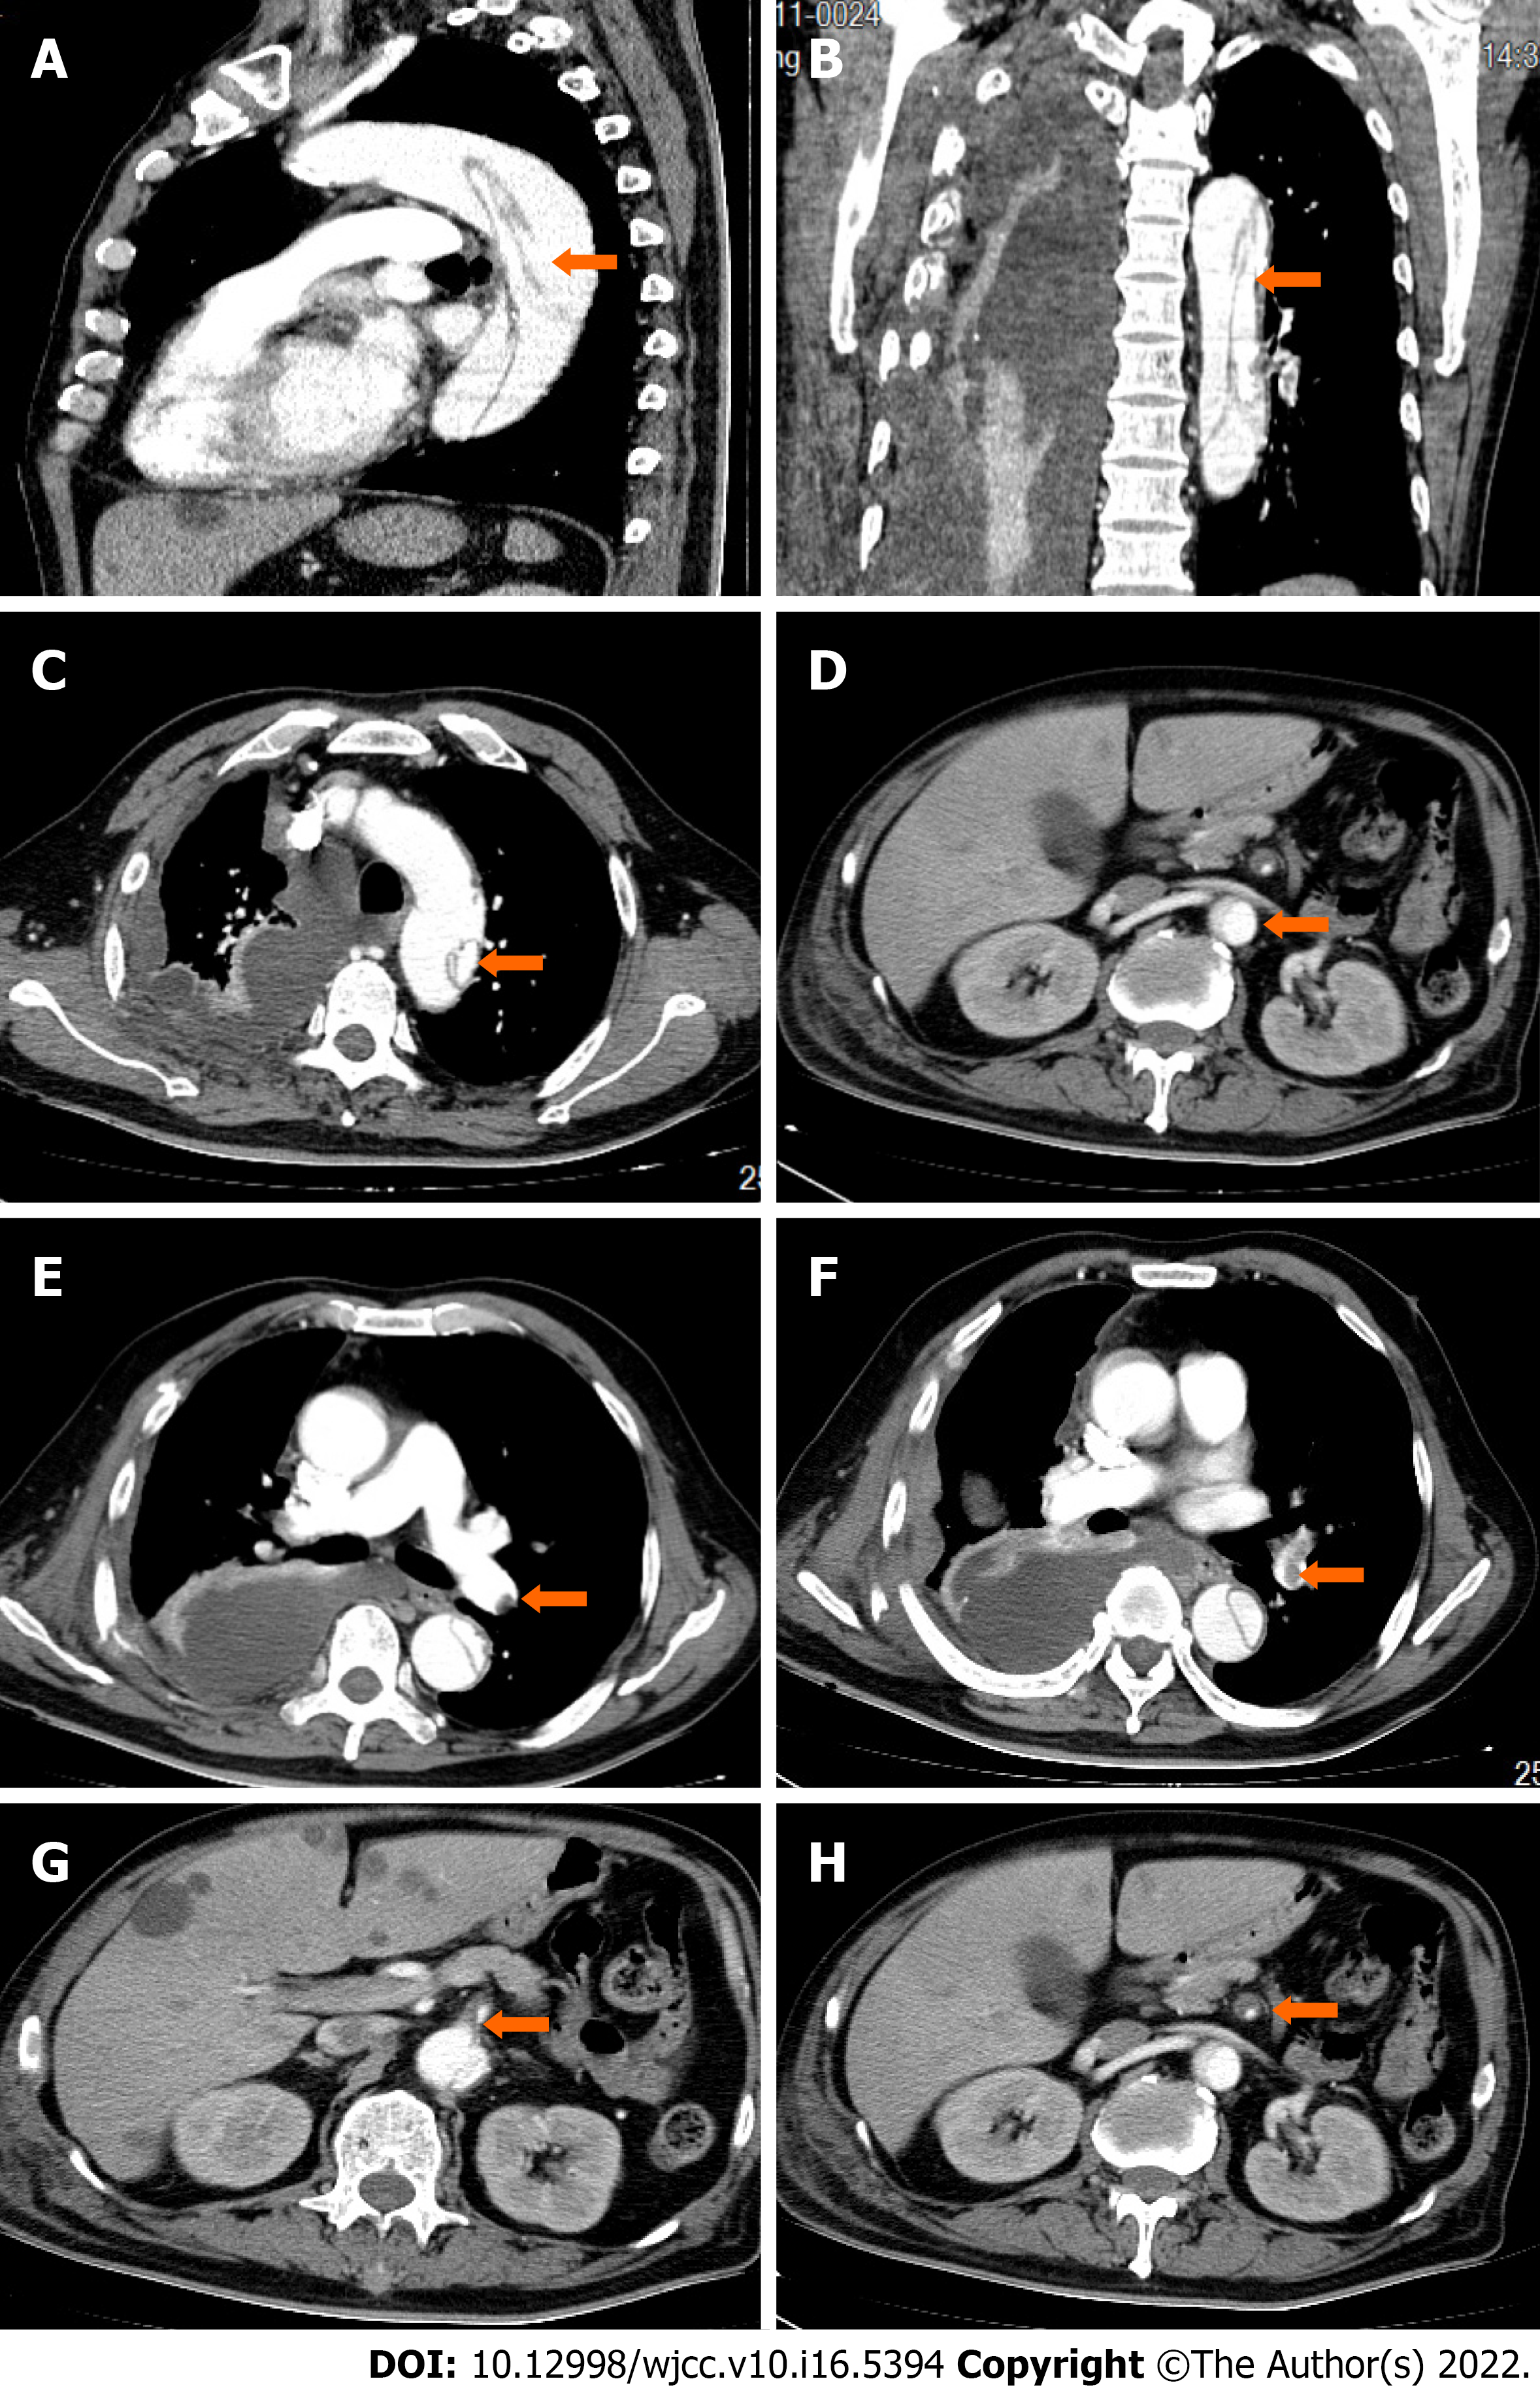
Figure 1 Computed tomography presentation of aortic coarctation and thrombosis.
A: AD sagittal plane; B: AD coronal surface; C: AD aortic arch cross-section; D: AD renal artery level; E: Proximal left lower lobe thrombosis; F: Distal left lower lobe thrombosis; G: Proximal superior mesenteric artery thrombosis; H: Distal superior mesenteric artery thrombosis. AD: Aortic dissection. Orange arrows point to lesions.
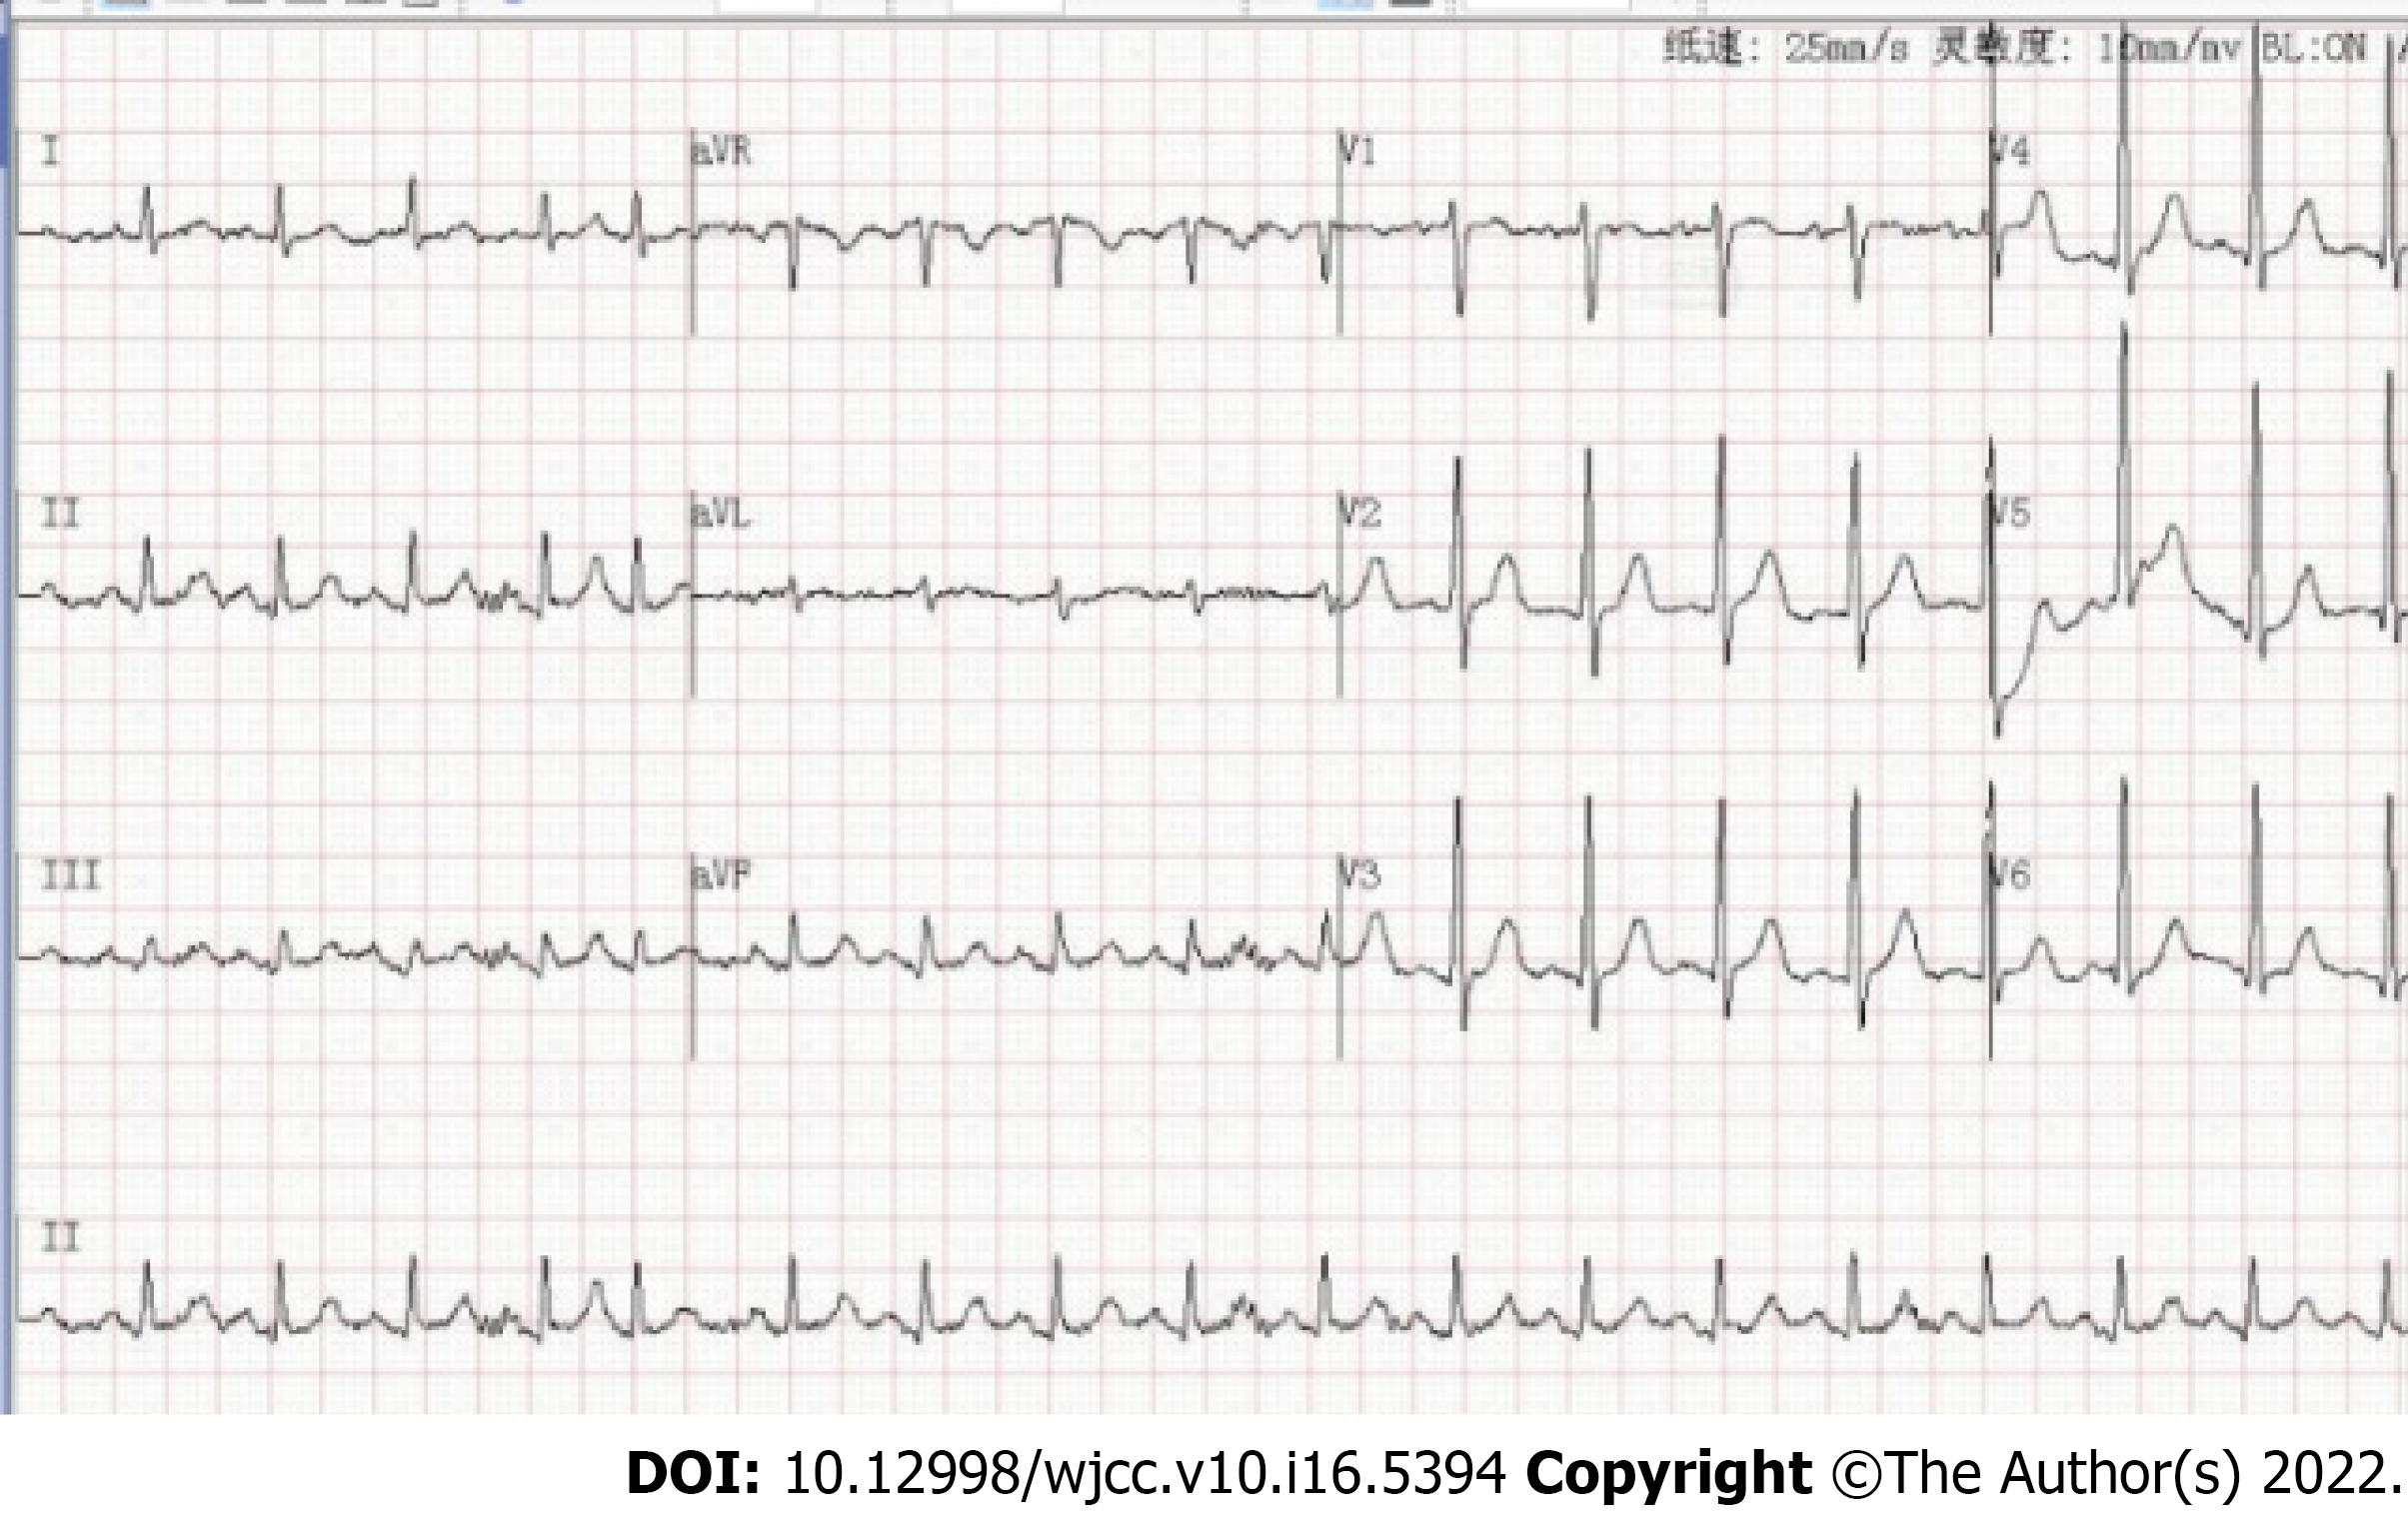
Figure 2 Electrocardiogram in the detection of aortic coarctation and pulmonary embolism.
- Citation: Chen XG, Shi SY, Ye YY, Wang H, Yao WF, Hu L. Successful treatment of aortic dissection with pulmonary embolism: A case report. World J Clin Cases 2022; 10(16): 5394-5399
- URL: https://www.wjgnet.com/2307-8960/full/v10/i16/5394.htm
- DOI: https://dx.doi.org/10.12998/wjcc.v10.i16.5394


