Copyright
©The Author(s) 2022.
World J Clin Cases. Jun 6, 2022; 10(16): 5196-5207
Published online Jun 6, 2022. doi: 10.12998/wjcc.v10.i16.5196
Published online Jun 6, 2022. doi: 10.12998/wjcc.v10.i16.5196
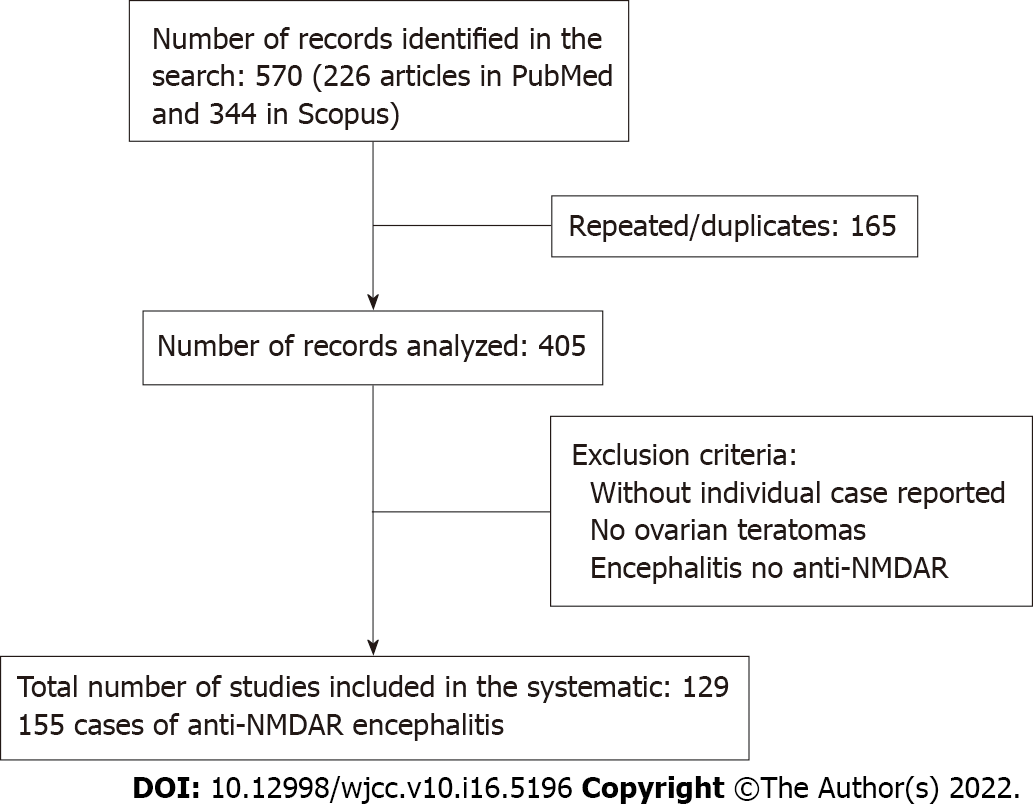
Figure 1 Consort flow diagram showing search strategies, and articles searched and excluded along with reasons for exclusion.
NMDAR: N-methyl-D-aspartate receptor.
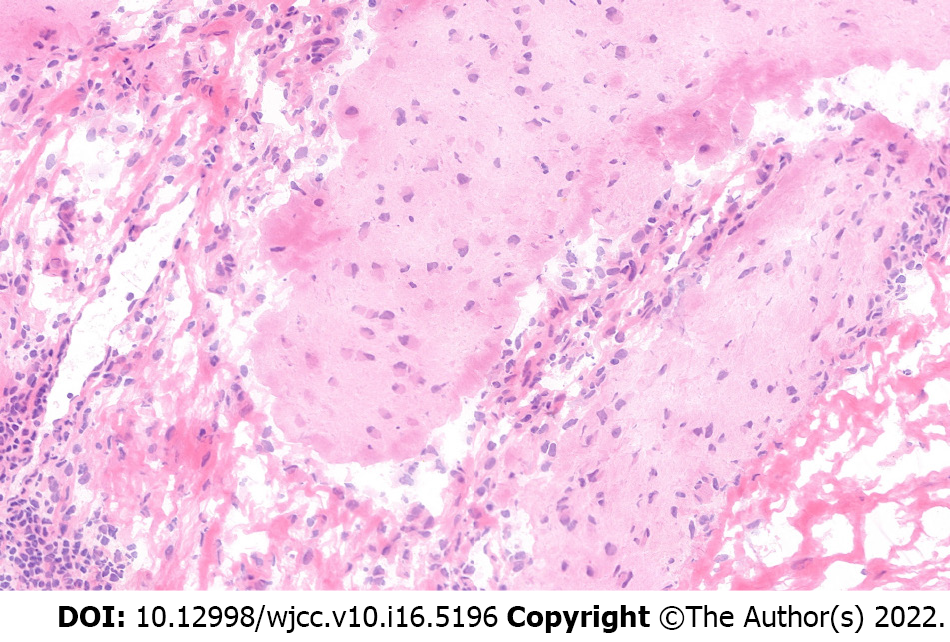
Figure 2 Representative brain tissue pathology from one of the six patients.
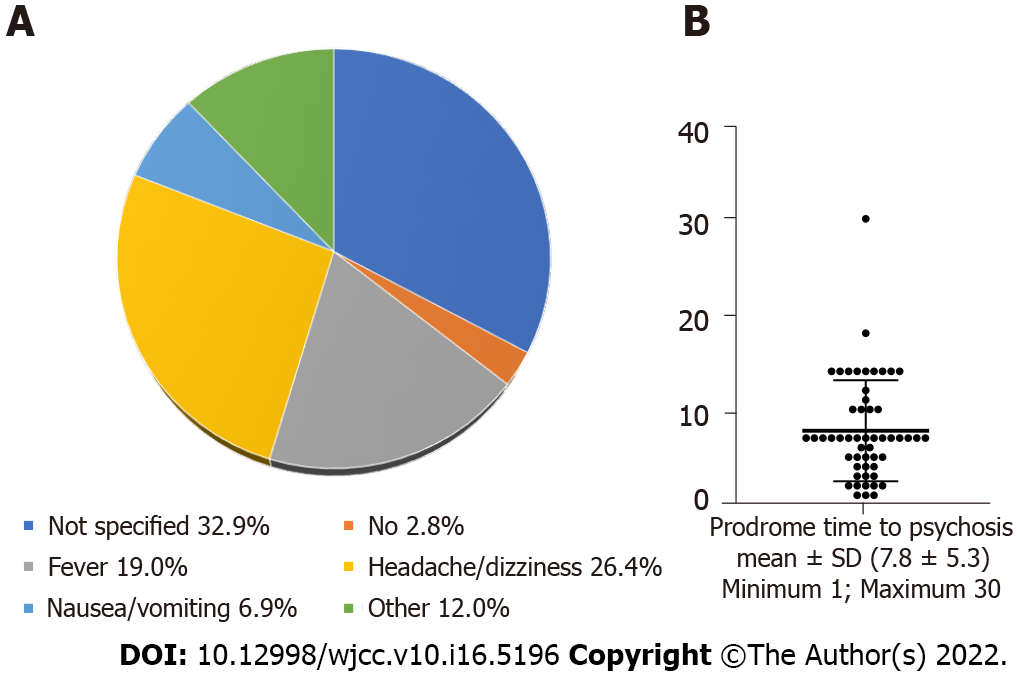
Figure 3 Prodrome symptoms.
A: Pie chart showing distribution of prodrome symptoms; B: Scatter plot and bar graph depicting mean time from prodrome to psychosis.
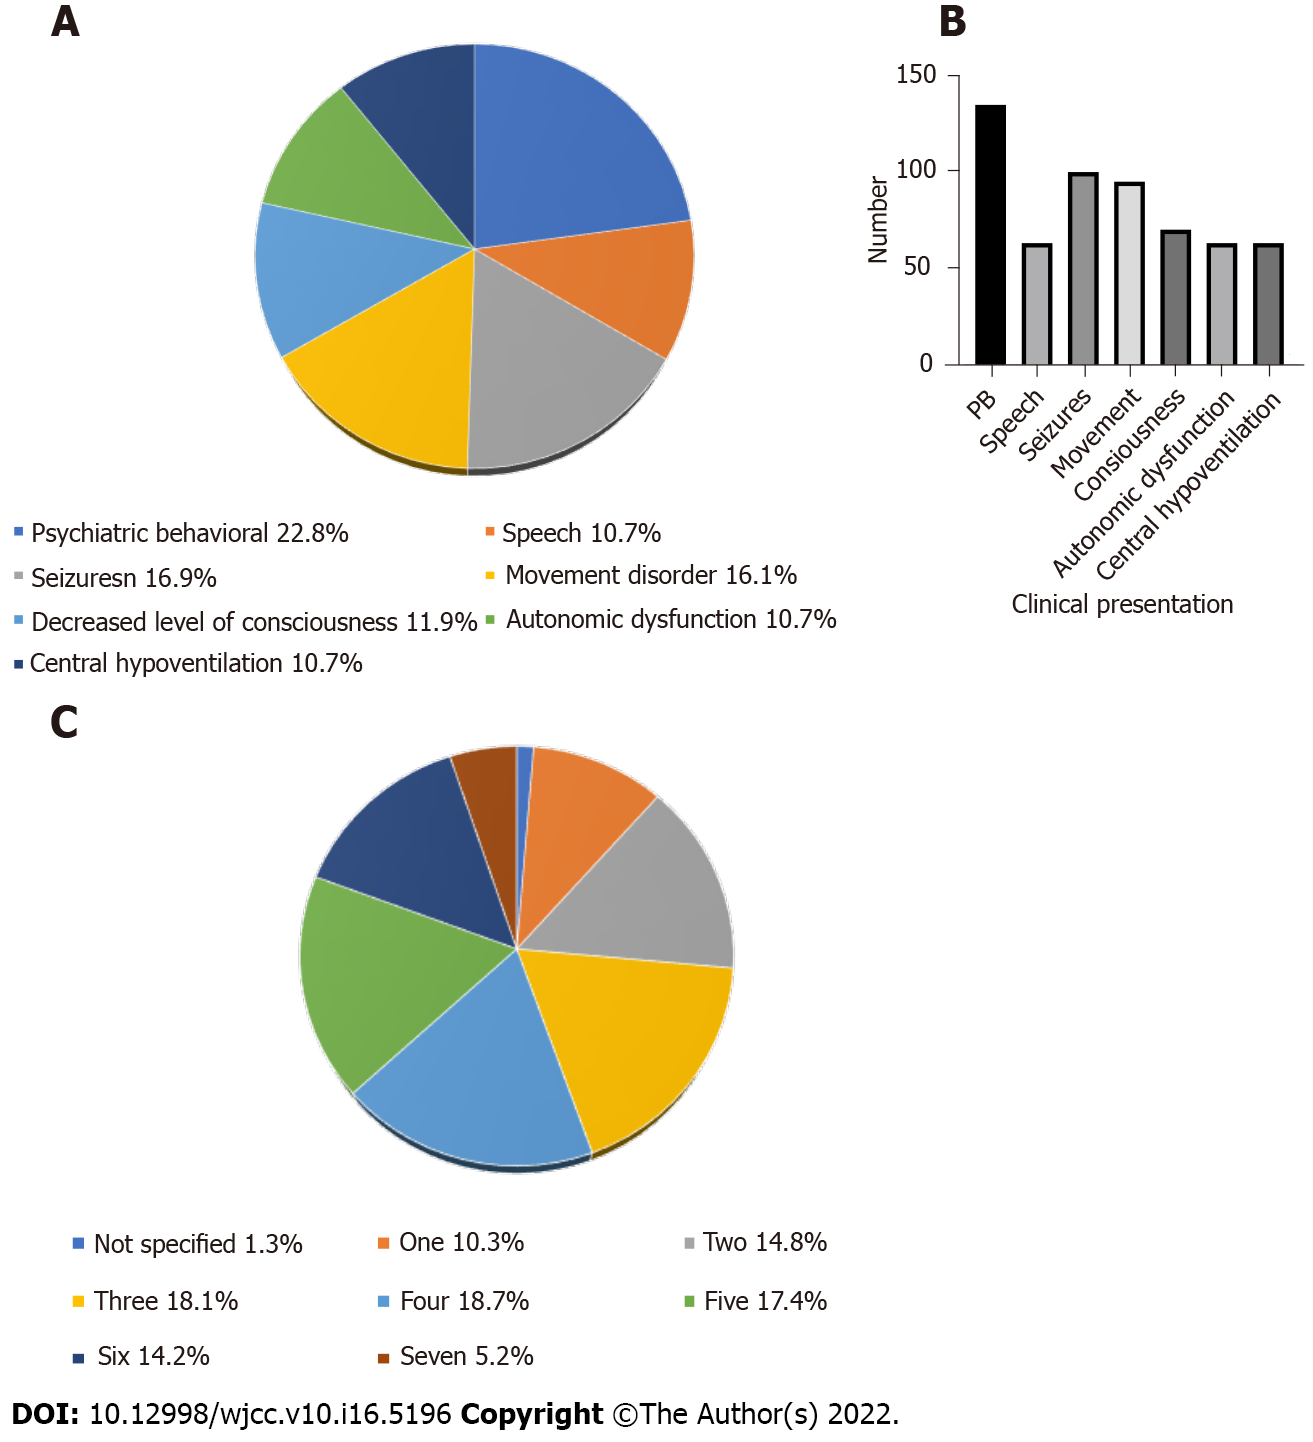
Figure 4 Major symptoms.
A: Pie chart sowing distribution of clinical symptoms: B: Bar graph showing abundance of various psychosomatic behavioral symptoms; C: Pie chart depicting number of symptoms reported.
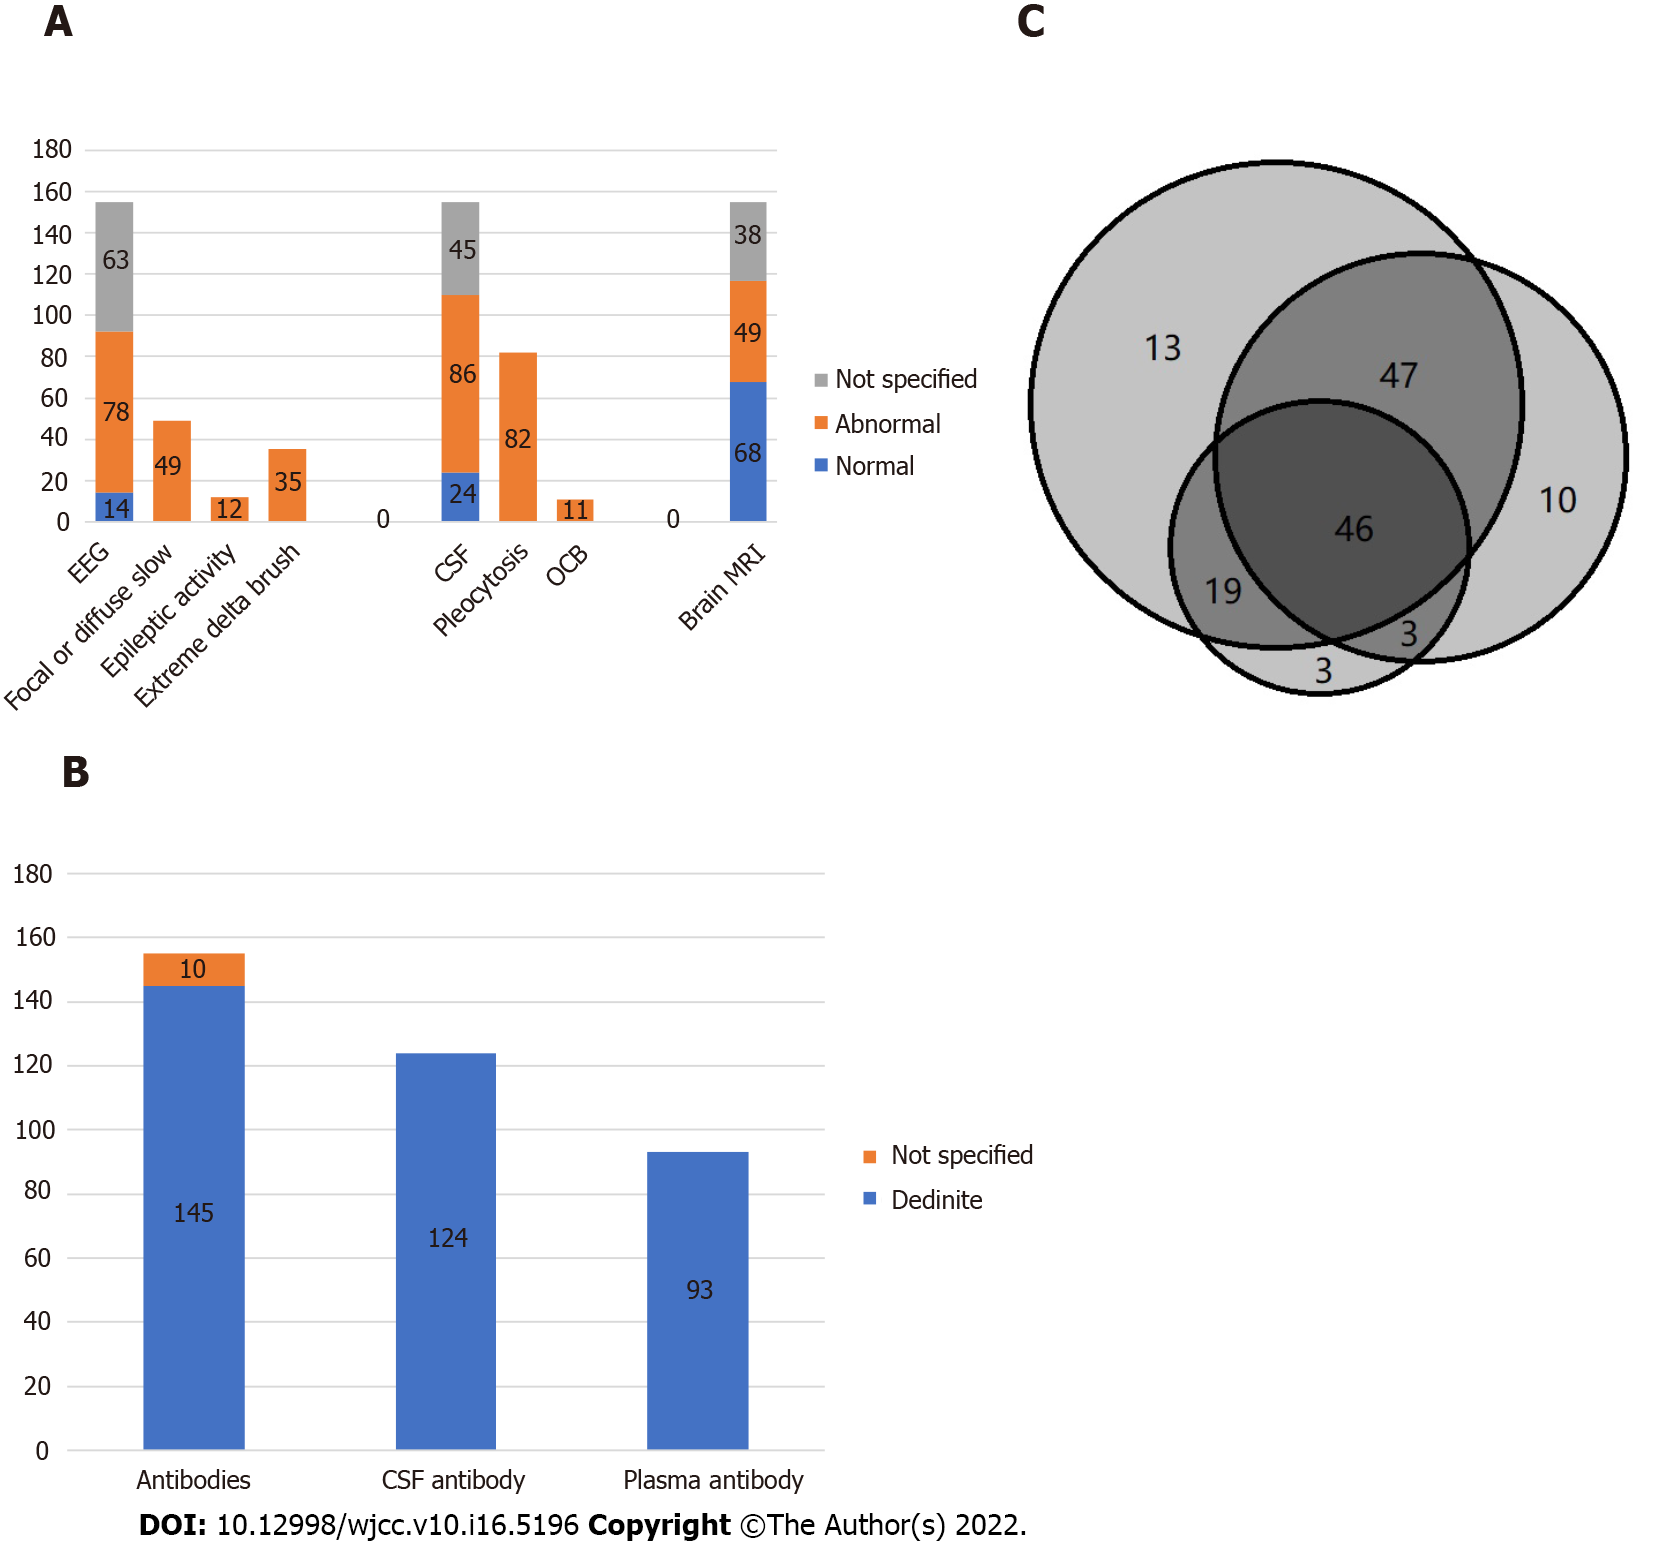
Figure 5 Examinations and treatment.
A: Bar graph showing results from patient examinations; B: Bar graph showing results from antibody testing; C: Venn diagram showing treatment combinations. EEG: Electroencephalography; CSF: Colony-stimulating factor; OCB: Oligoclonal bands.
- Citation: Li SJ, Yu MH, Cheng J, Bai WX, Di W. Ovarian teratoma related anti-N-methyl-D-aspartate receptor encephalitis: A case series and review of the literature. World J Clin Cases 2022; 10(16): 5196-5207
- URL: https://www.wjgnet.com/2307-8960/full/v10/i16/5196.htm
- DOI: https://dx.doi.org/10.12998/wjcc.v10.i16.5196


