Copyright
©The Author(s) 2022.
World J Clin Cases. Jun 6, 2022; 10(16): 5165-5184
Published online Jun 6, 2022. doi: 10.12998/wjcc.v10.i16.5165
Published online Jun 6, 2022. doi: 10.12998/wjcc.v10.i16.5165
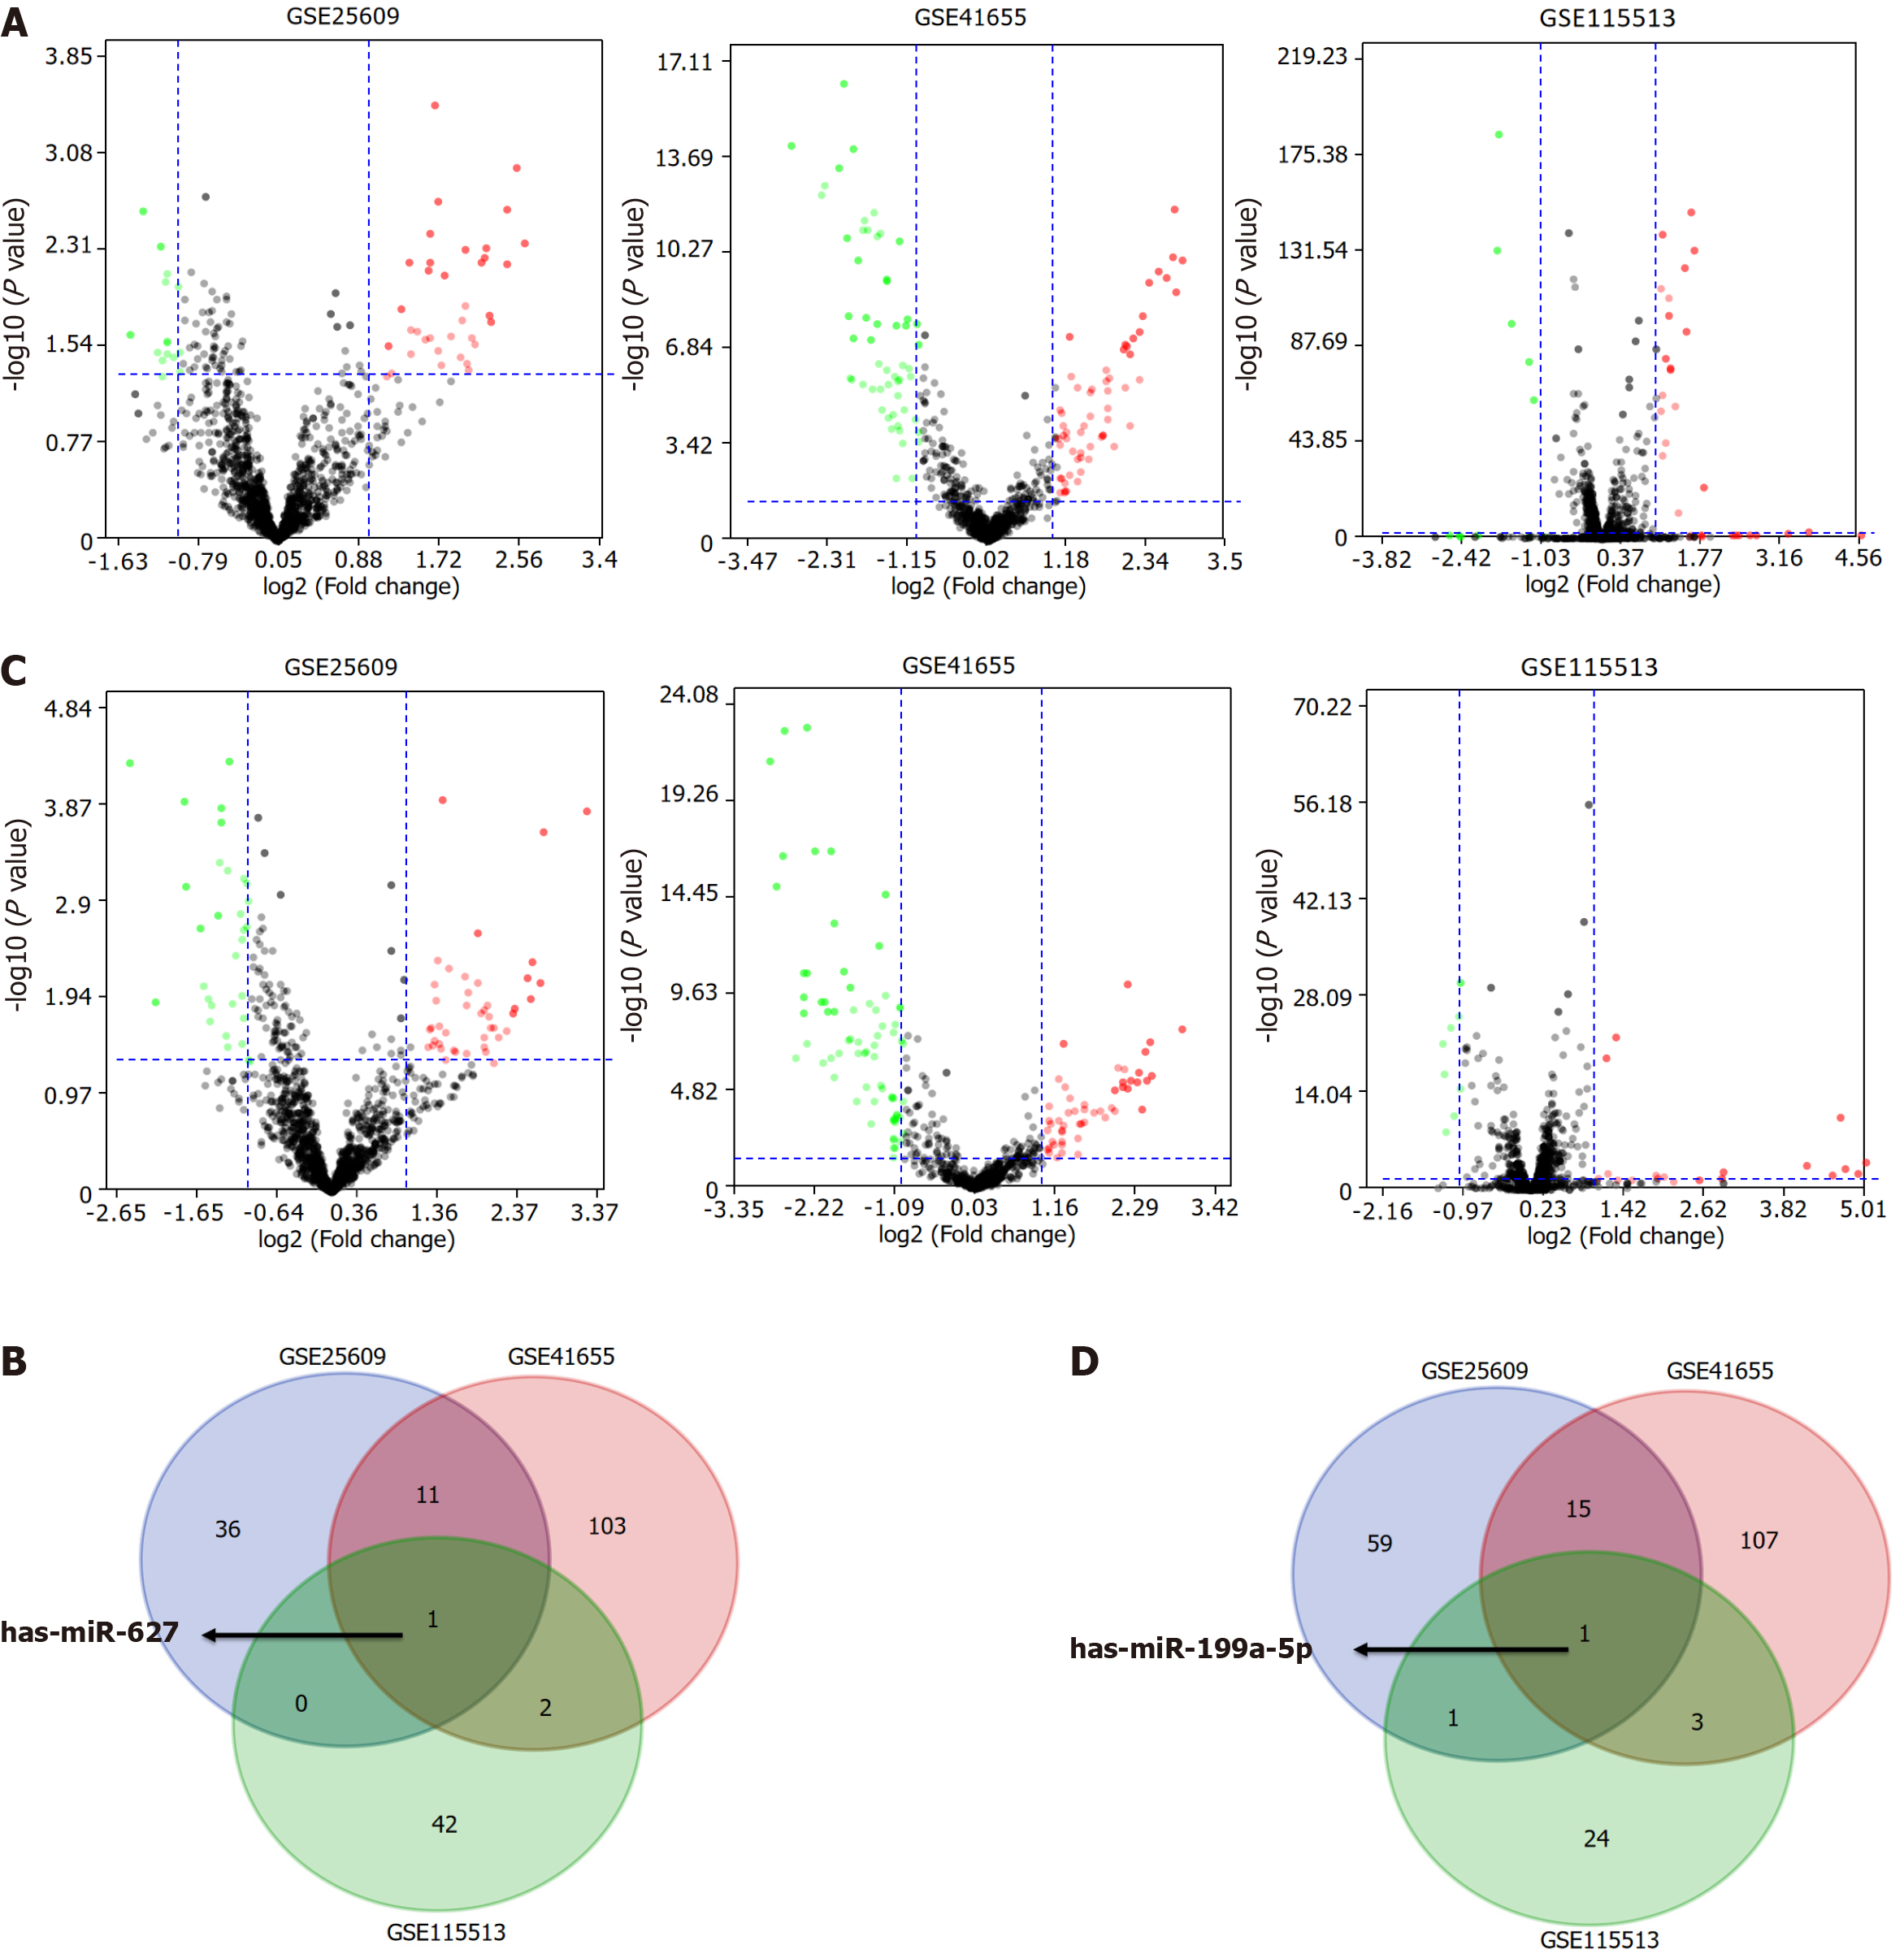
Figure 1 Identification of consensus differentially expressed genes among the GSE25069, GSE41655, and GSE115513 datasets.
A: Volcano plot of differentially expressed genes (DEGs) between colorectal cancer (CRC) and control groups in the three datasets; B: The Venn diagram showed that hsa-miR-627 was differentially expressed in the three datasets between CRC and control groups; C: Volcano plot of DEGs between adenoma and control groups in the three datasets; D: The Venn diagram showed that hsa-miR-199a-5p was differentially expressed in the three datasets between adenoma and control groups.
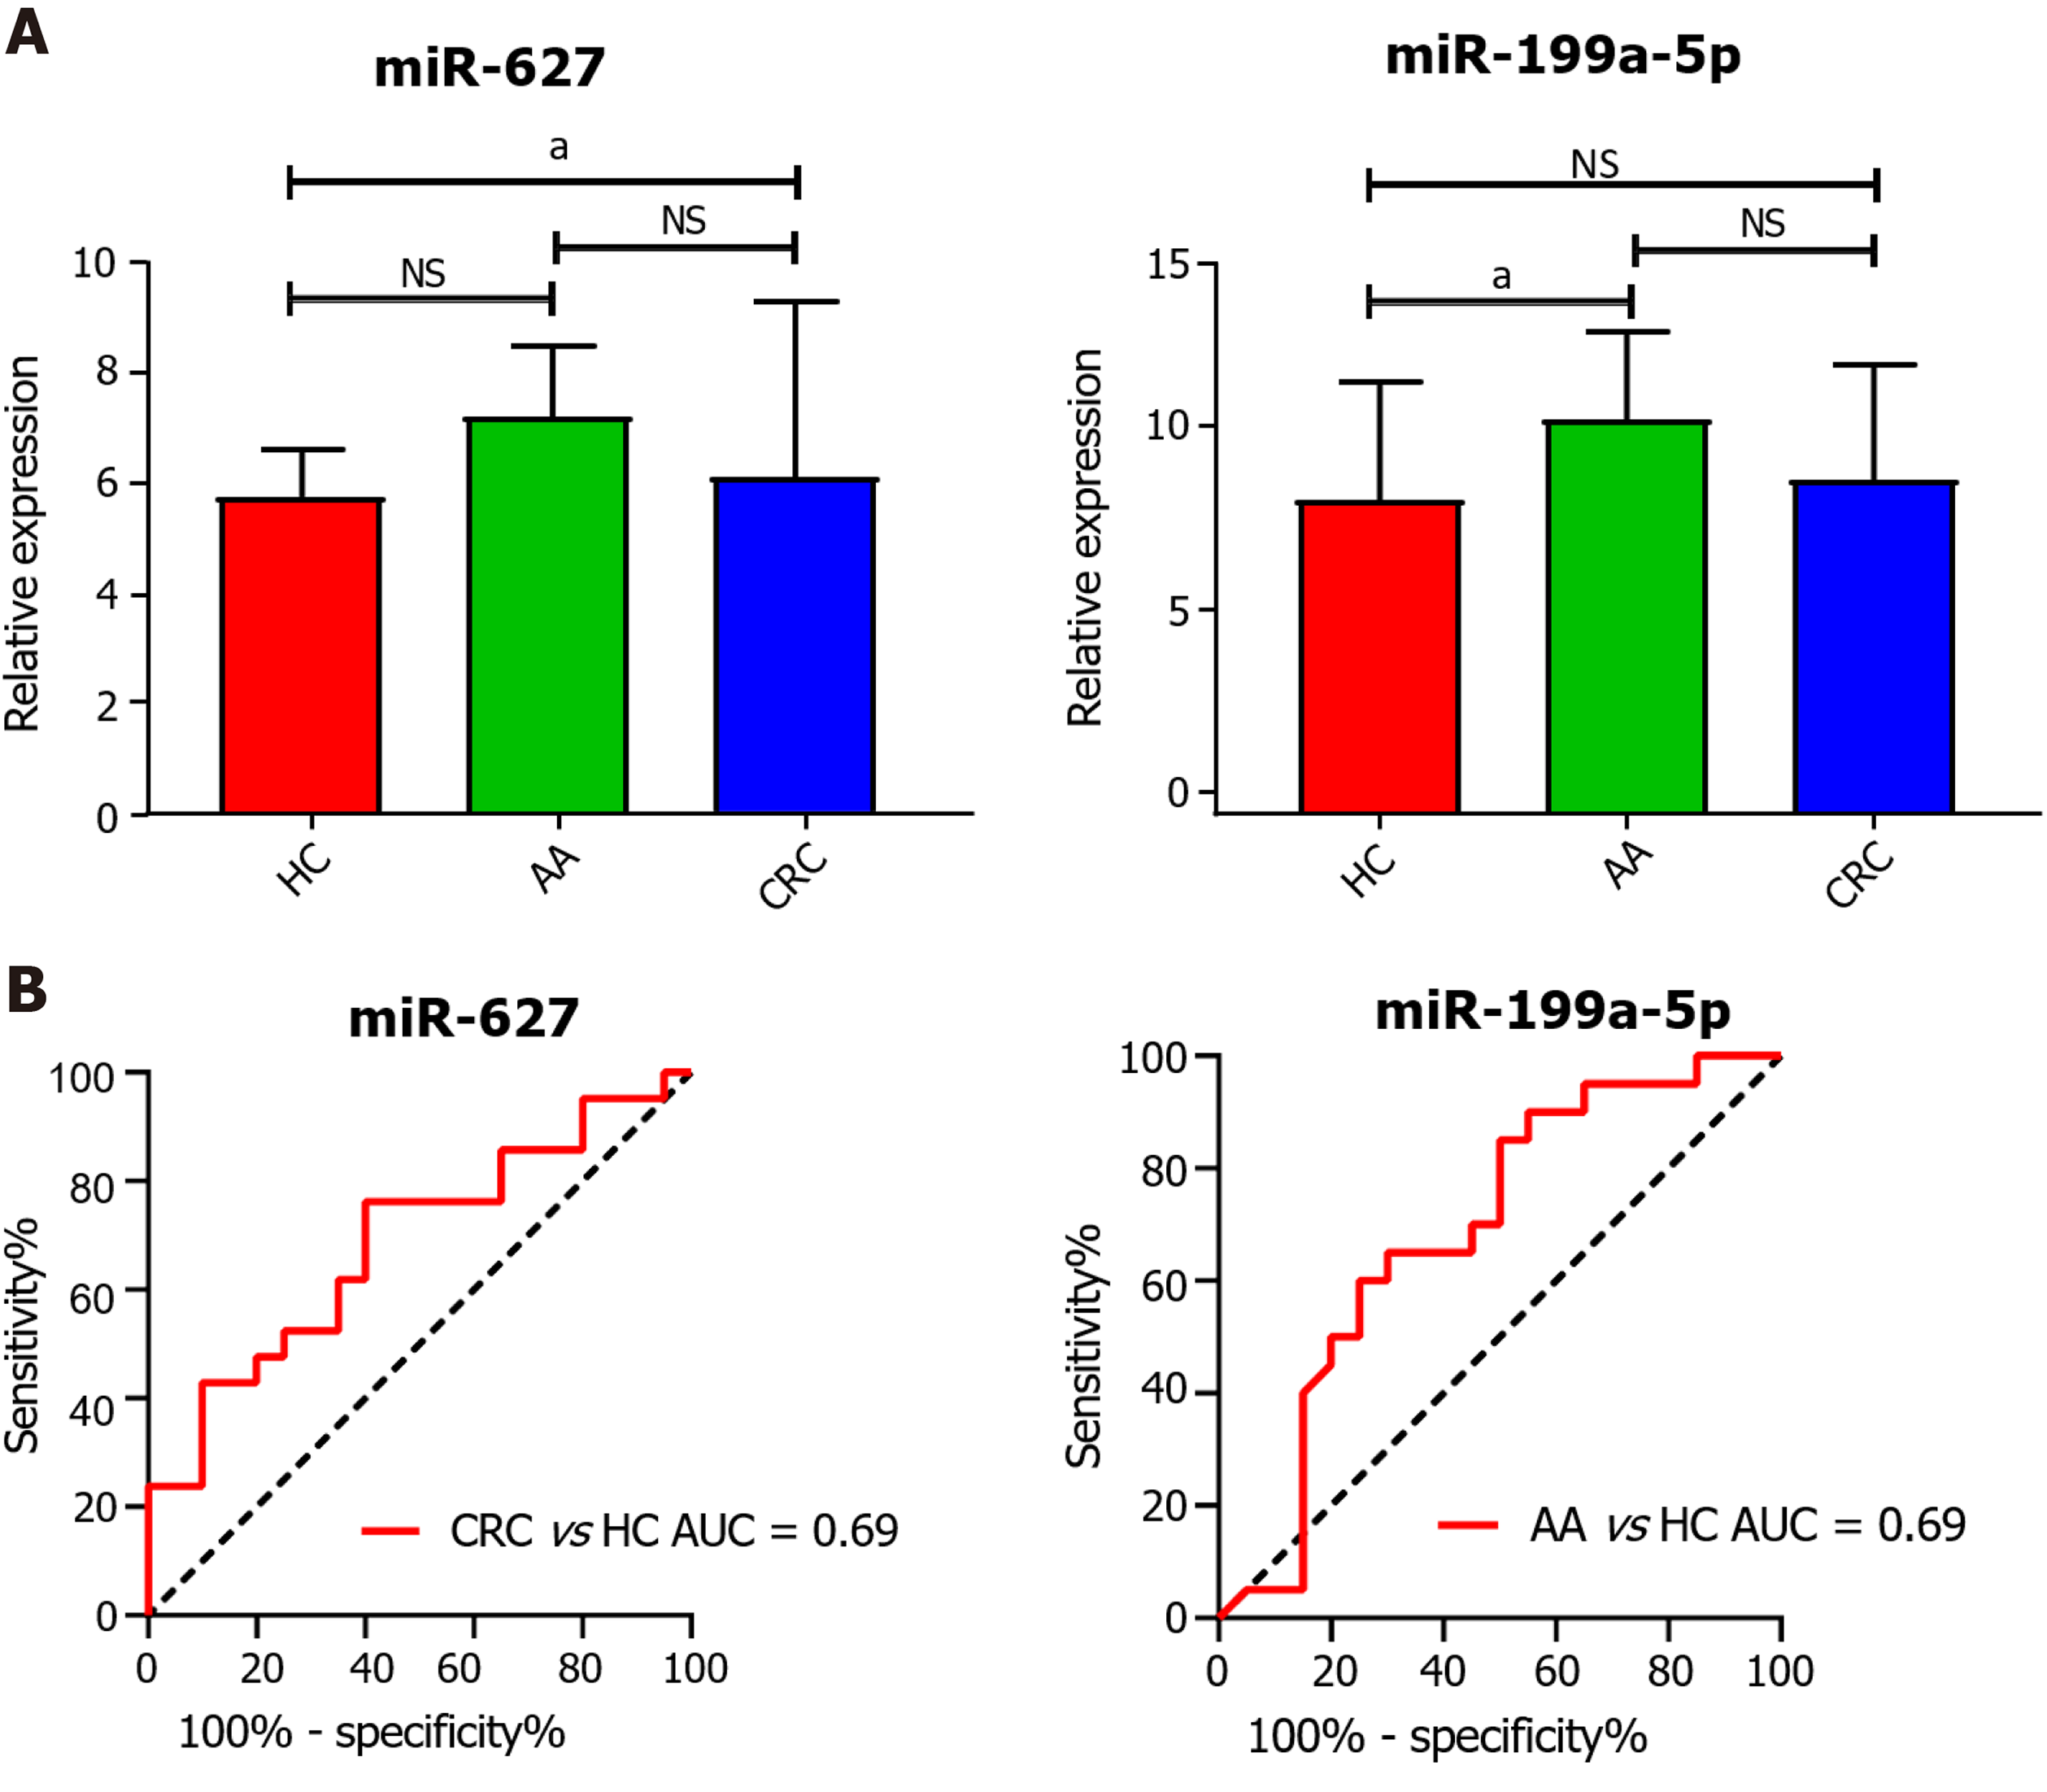
Figure 2 Evaluation of the diagnostic utility of circulating cell-free miR-627 and miR-199a-5p in the GSE25069 dataset.
A: Plasma expression of miR-627 and miR-199a-5p in healthy controls (HCs), advanced colorectal adenoma (AA) and colorectal cancer (CRC) patients; B: Receiver operating characteristic analysis of miR-627 and miR-199a-5p to distinguish patients with CRC and AA from HCs. Circulating levels of miR-627 discriminate CRC patients from controls with an area under the curve (AUC) = 0.69. MiR-199a-5p discriminated the AA group from control group with an AUC = 0.69. aP < 0.05. NS: Not significant; HC: Healthy control; AA: Advanced colorectal adenoma; CRC: Colorectal cancer; AUC: Area under the curve.
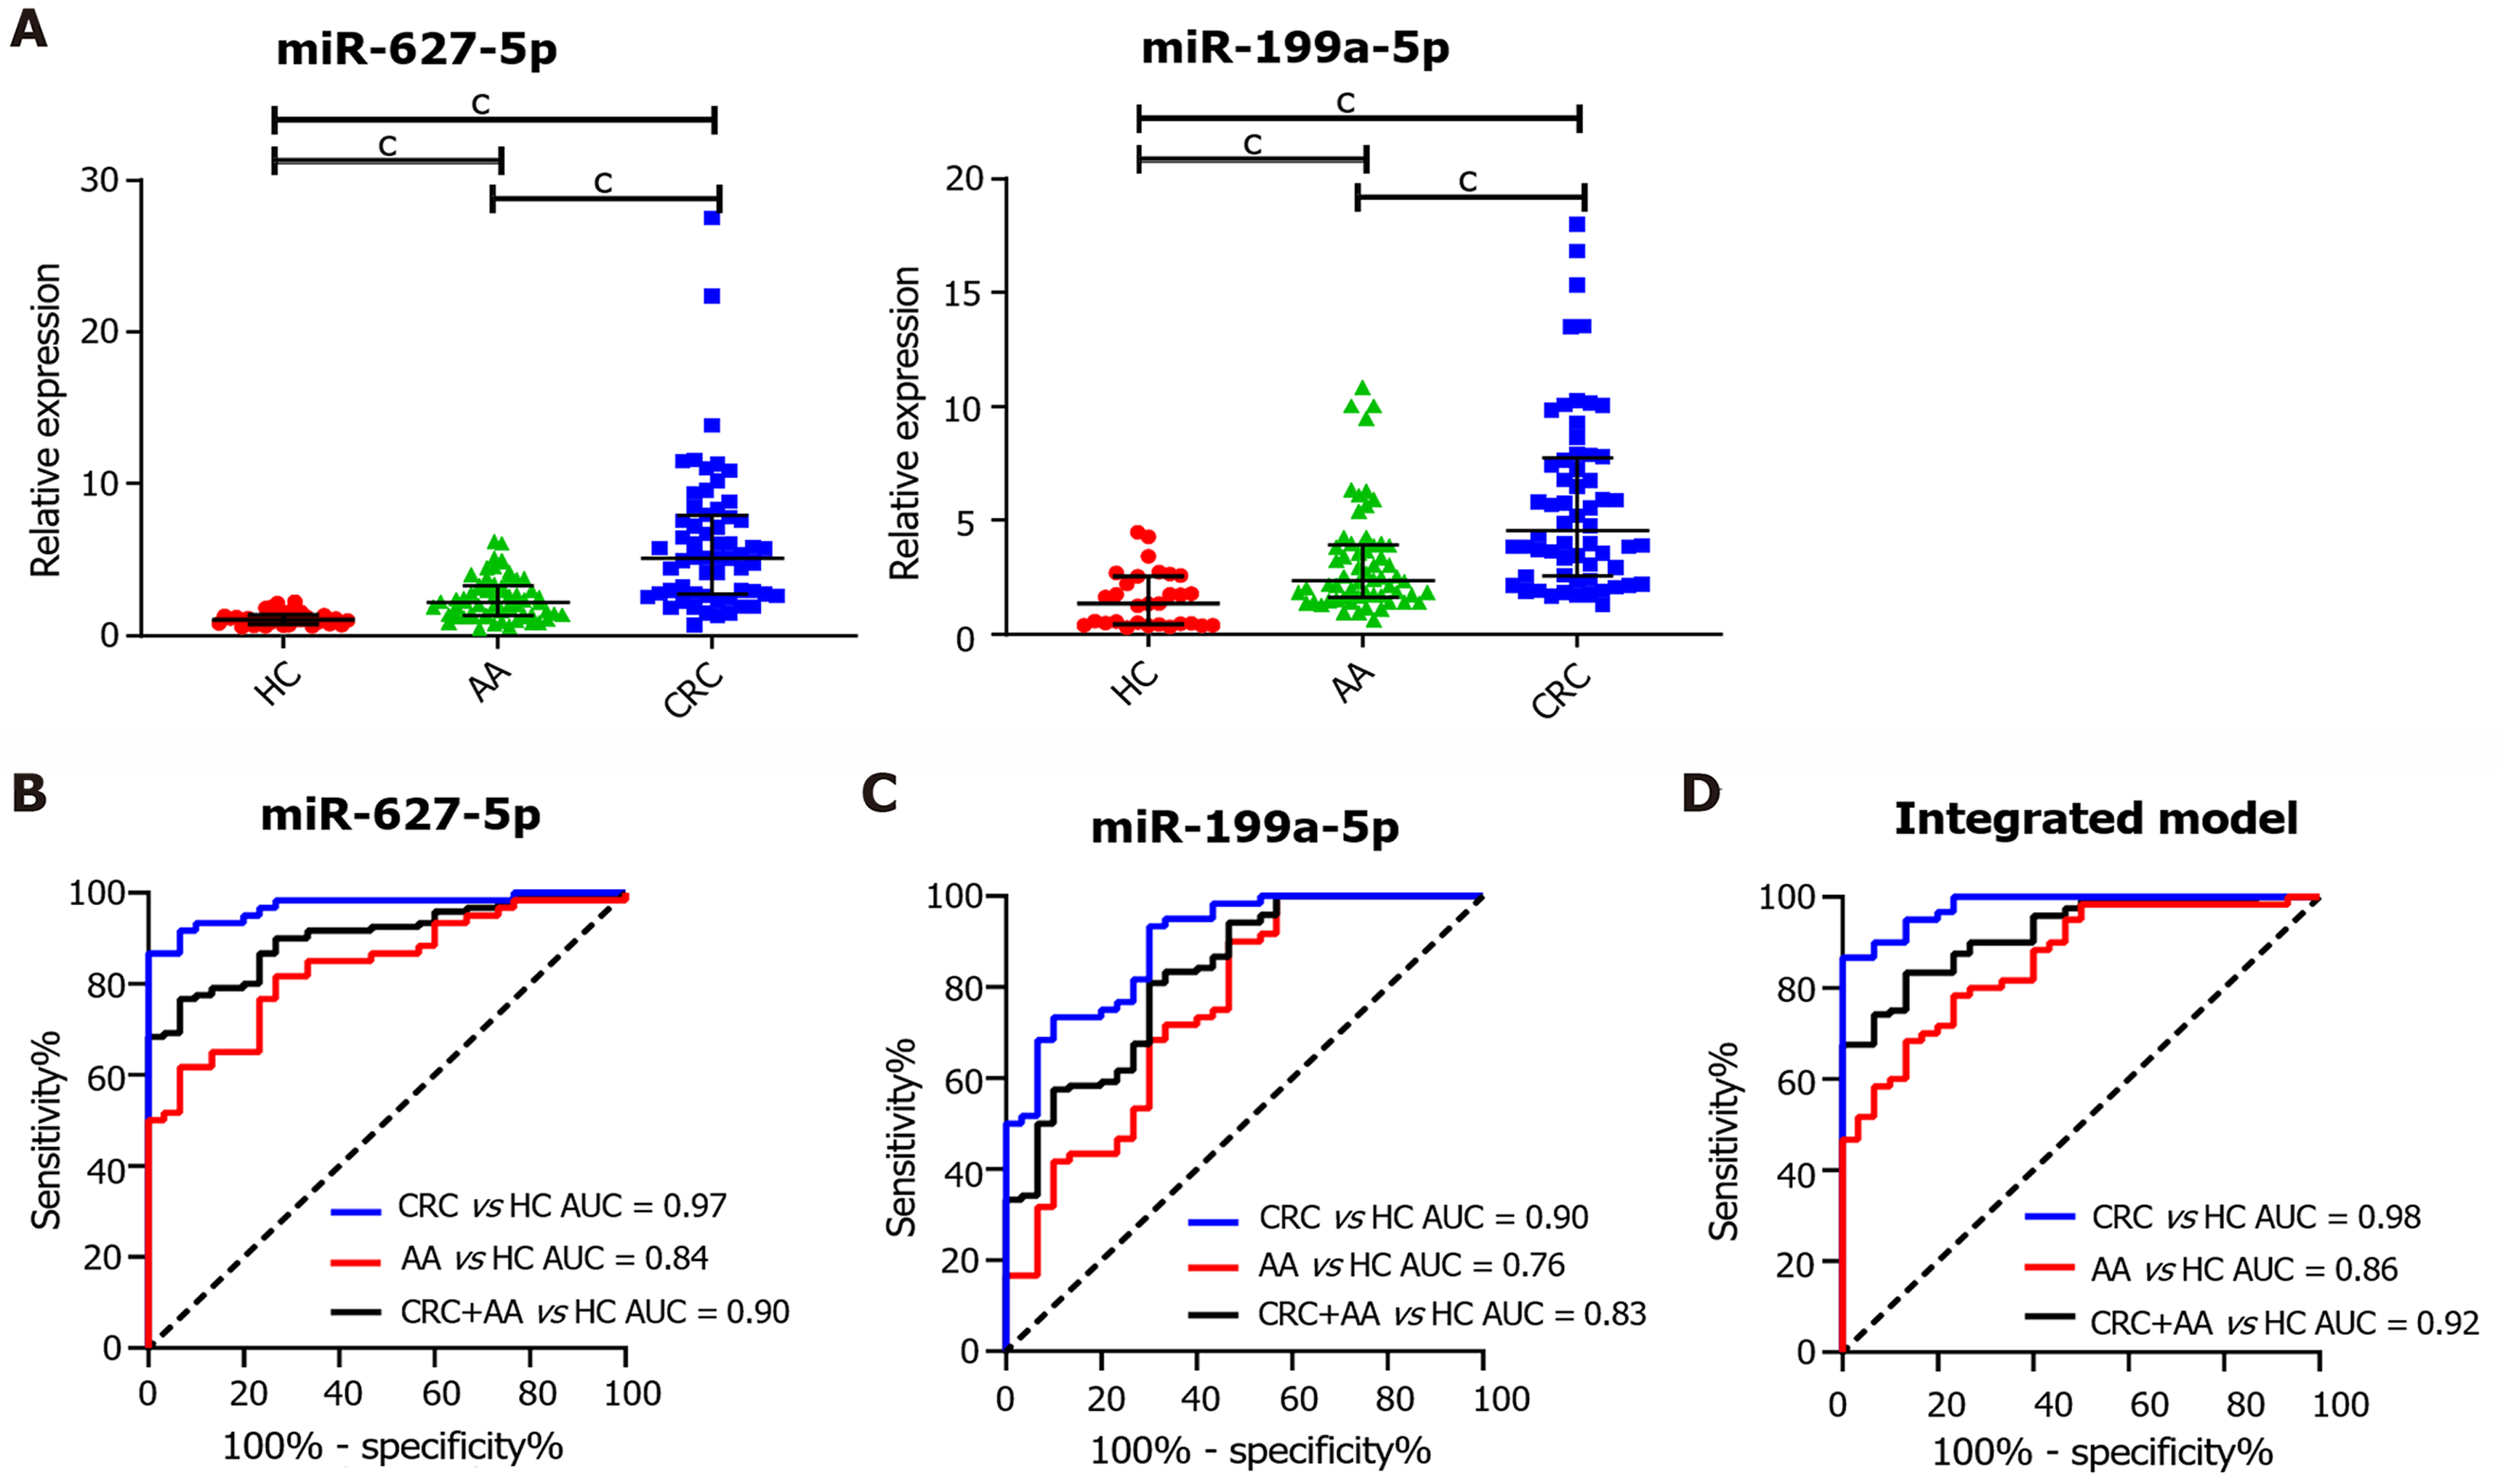
Figure 3 Evaluation of the diagnostic utility of serum miR-627-5p and miR-199a-5p in an independent cohort comprising 30 healthy controls, 60 advanced colorectal adenoma patients and 60 colorectal cancer patients.
A: Identification of the serum expression levels of miR-627-5p and miR-199a-5p in healthy controls (HCs), advanced colorectal adenoma (AA) and colorectal cancer (CRC) patients by quantitative real-time polymerase chain reaction; B: Receiver operating characteristic (ROC) analysis of miR-627-5p to distinguish colorectal neoplasms from HCs. The areas under the curve (AUC) in discriminating CRC from HCs (blue line), AA from HCs (red line) and CRC+AA from HCs (black line) were 0.97, 0.84, and 0.90, respectively; C: ROC analysis of miR-199a-5p to distinguish colorectal neoplasms from HCs. The AUC in discriminating CRC from HCs (blue line), AA from HCs (red line) and CRC+AA from HCs (black line) were 0.90, 0.76, and 0.83, respectively; D: ROC analysis of the integrated biomarker panel (miR-627-5p level plus miR-199a-5p) to distinguish colorectal neoplasms from HCs. The AUC in discriminating CRC from HCs (blue line), AA from HCs (red line) and CRC+AA from HCs (black line) were 0.98, 0.86, and 0.92, respectively. cP < 0.001. HC: Healthy control; AA: Advanced colorectal adenoma; CRC: Colorectal cancer; AUC: Area under the curve.
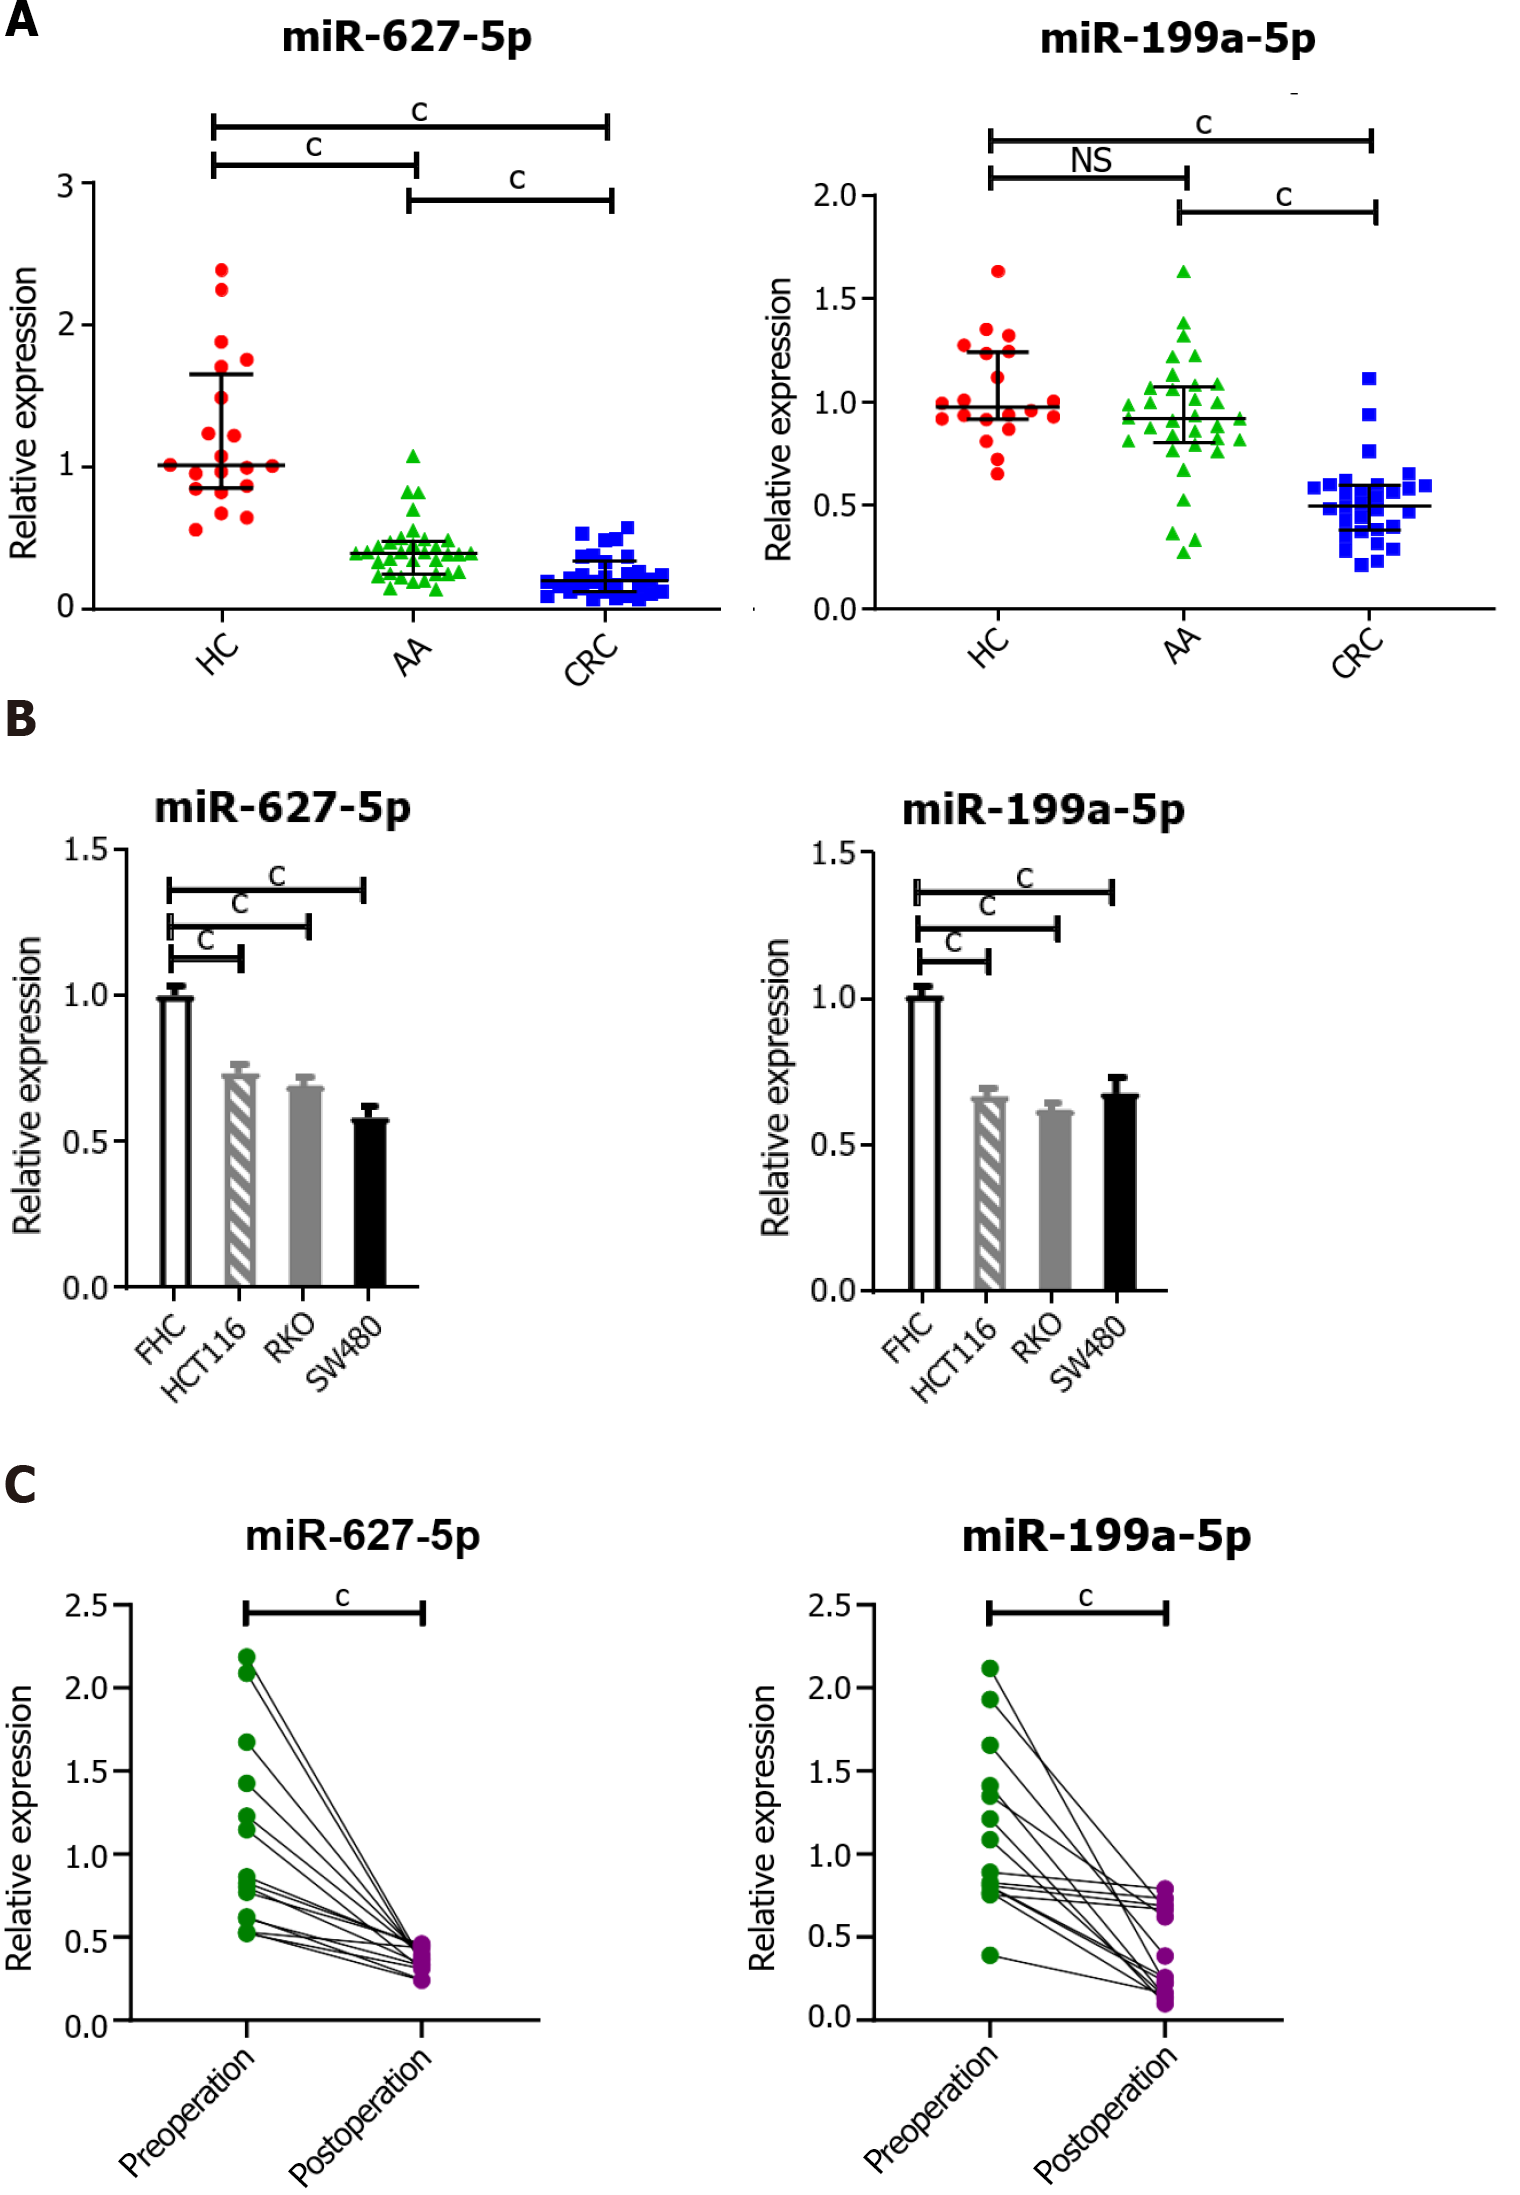
Figure 4 Elevated serum miR-627-5p and miR-199a-5p were tumor-derived.
A: Comparison of tissue miR-627-5p and miR-199a-5p levels in colorectal cancer (CRC) patients, advanced colorectal adenoma (AA) patients and healthy controls (HCs). miR-627-5p was found to be sequentially decreased from normal colorectal tissues, and precancerous lesions to cancer tissues. MiR-199a-5p was markedly reduced in CRC tissues, but not significantly decreased in AA tissues; B: Comparison of miR-627-5p and miR-199a-5p levels in CRC cell lines (HCT116, RKO, and SW480) and the normal human colorectal mucosal epithelial cell line. The levels of miR-627-5p and miR-199a-5p were increased in CRC cells compared with those in FHC cells; C: Comparison of serum miR-672-5p and miR-199a-5p levels in preoperative and postoperative CRC patients. The expression levels of circulating miR-627-5p and miR-199a-5p in CRC patients were significantly lower after surgery than before surgery. cP < 0.001. NS: Not significant; HC: Healthy control; AA: Advanced colorectal adenoma; CRC: Colorectal cancer; AUC: Area under the curve.
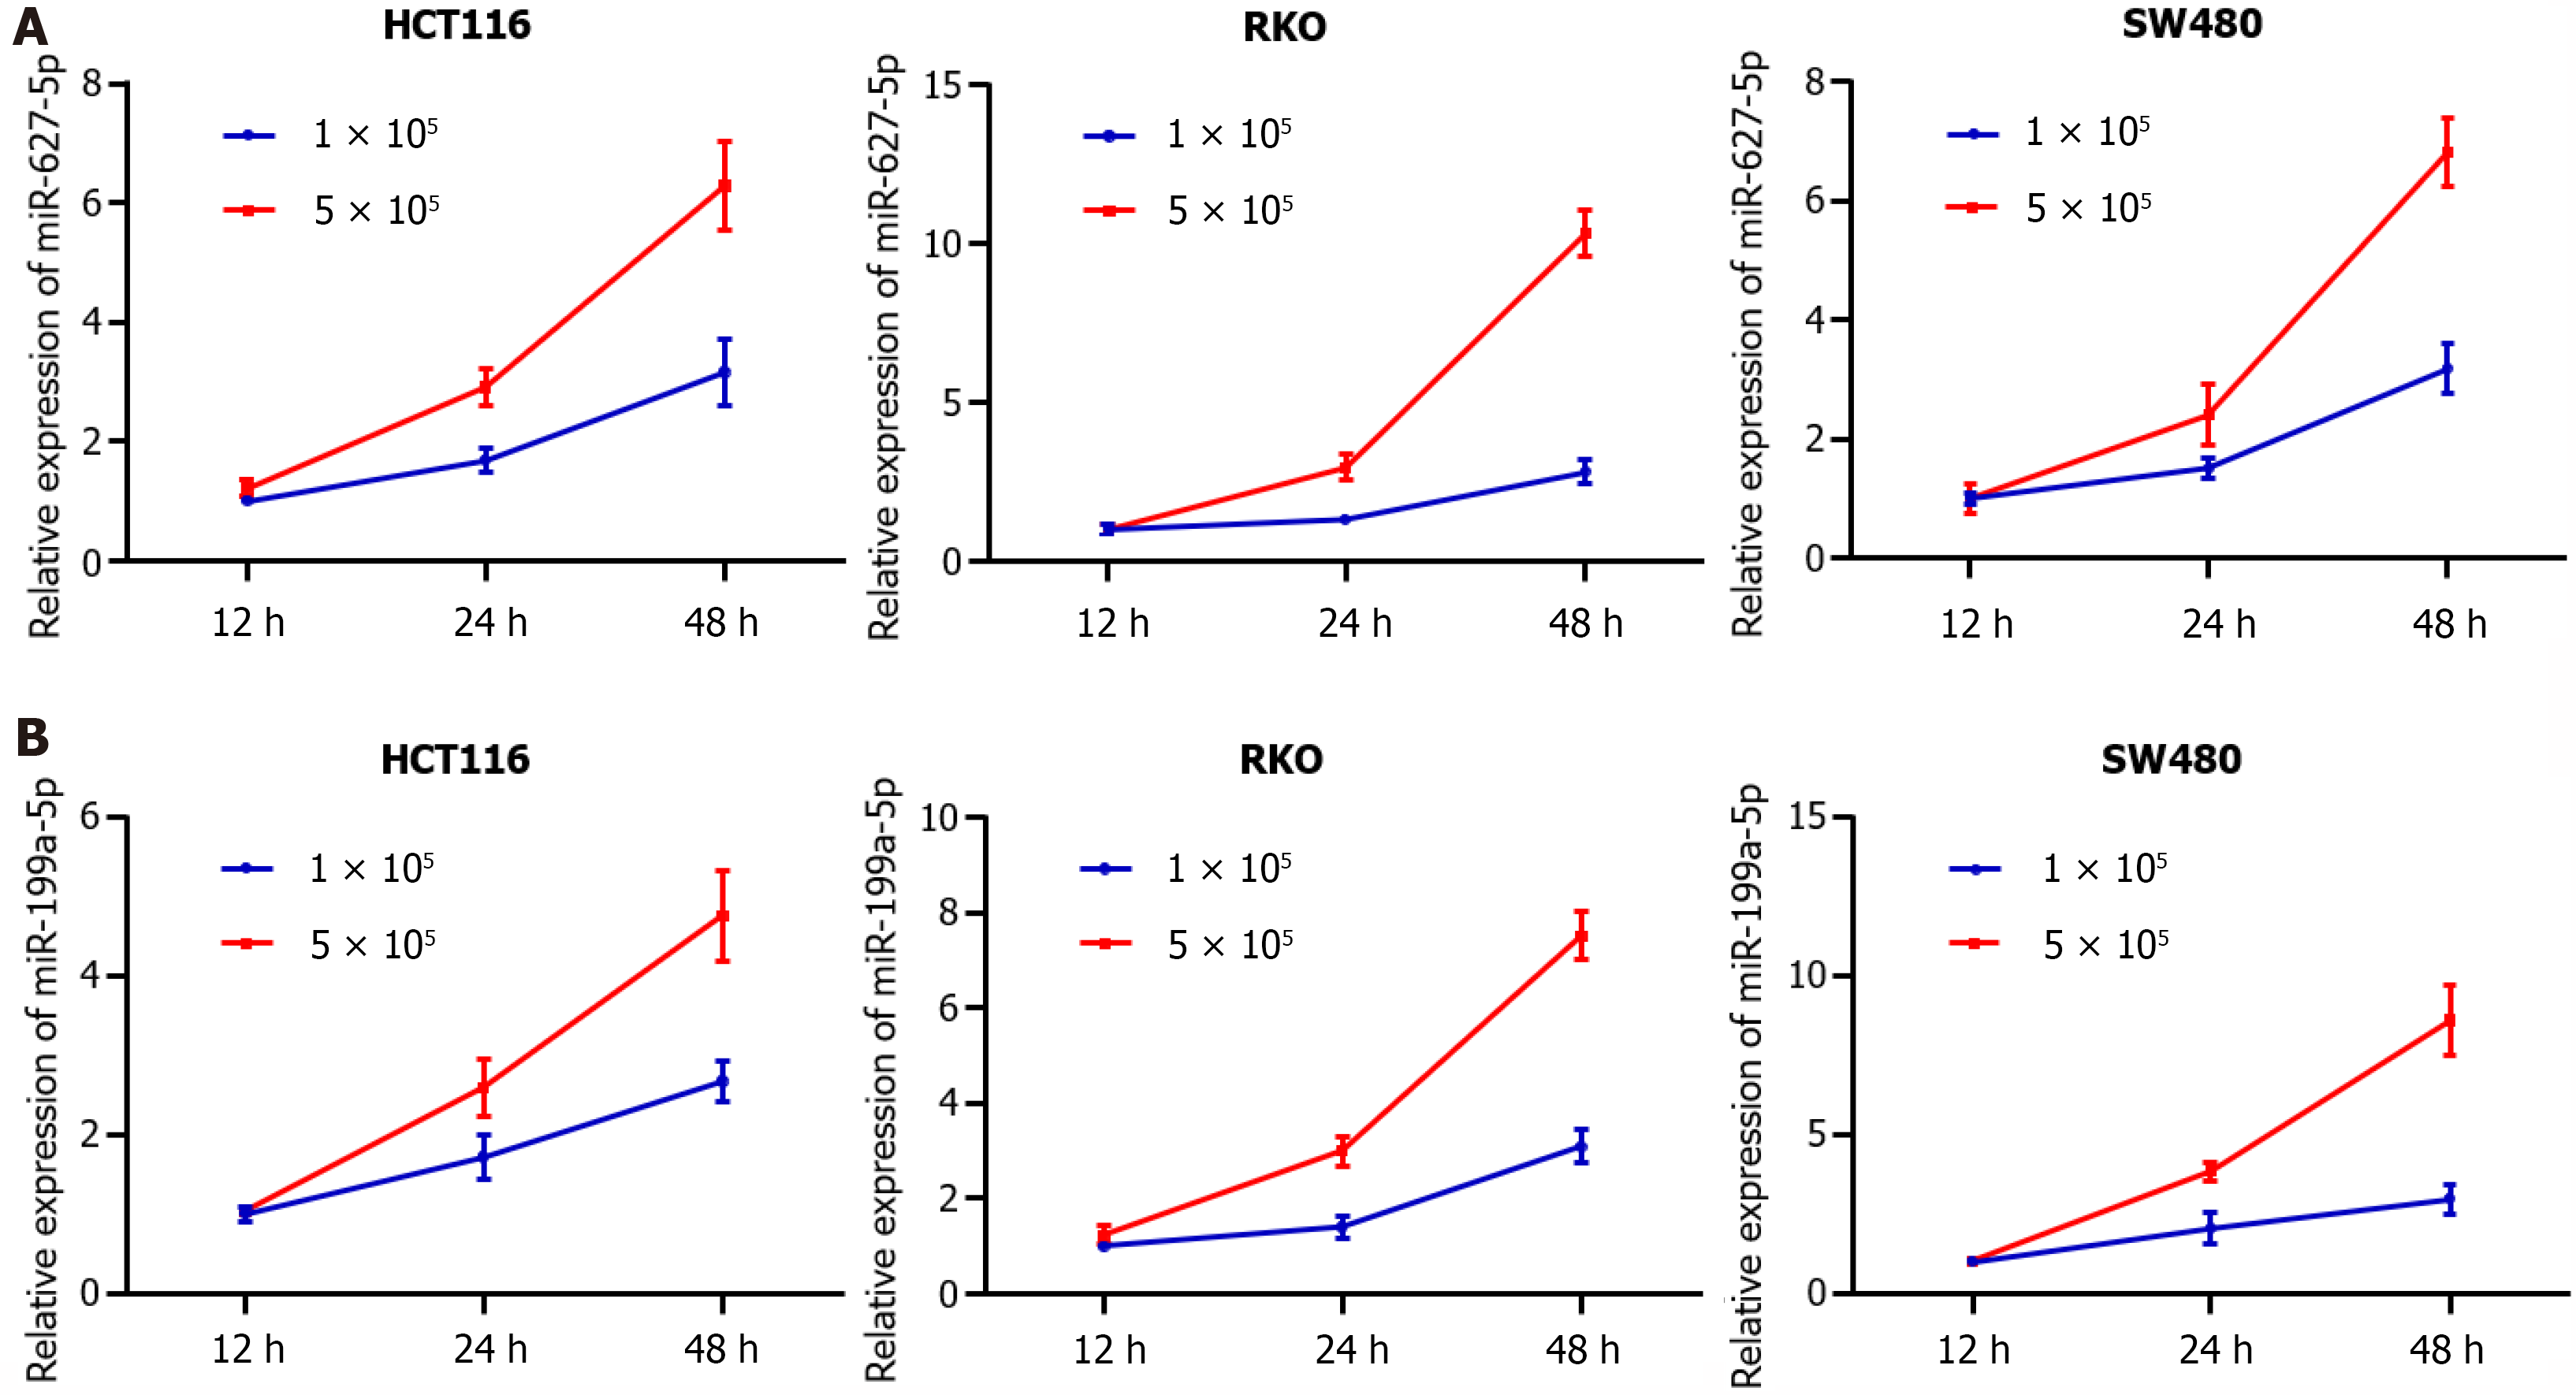
Figure 5 Analysis of miR-672-5p and miR-199a-5p levels in cultured media of colorectal cancer cell lines (HCT116, RKO, and SW480) with different time points and different cell numbers.
A: The level of miR-627-5p was increased with culture time and increased cell numbers in the culture media of colorectal cancer (CRC) cell lines; B: The level of miR-199a-5p was increased with culture time and increased cell numbers in the culture media of CRC cell lines.
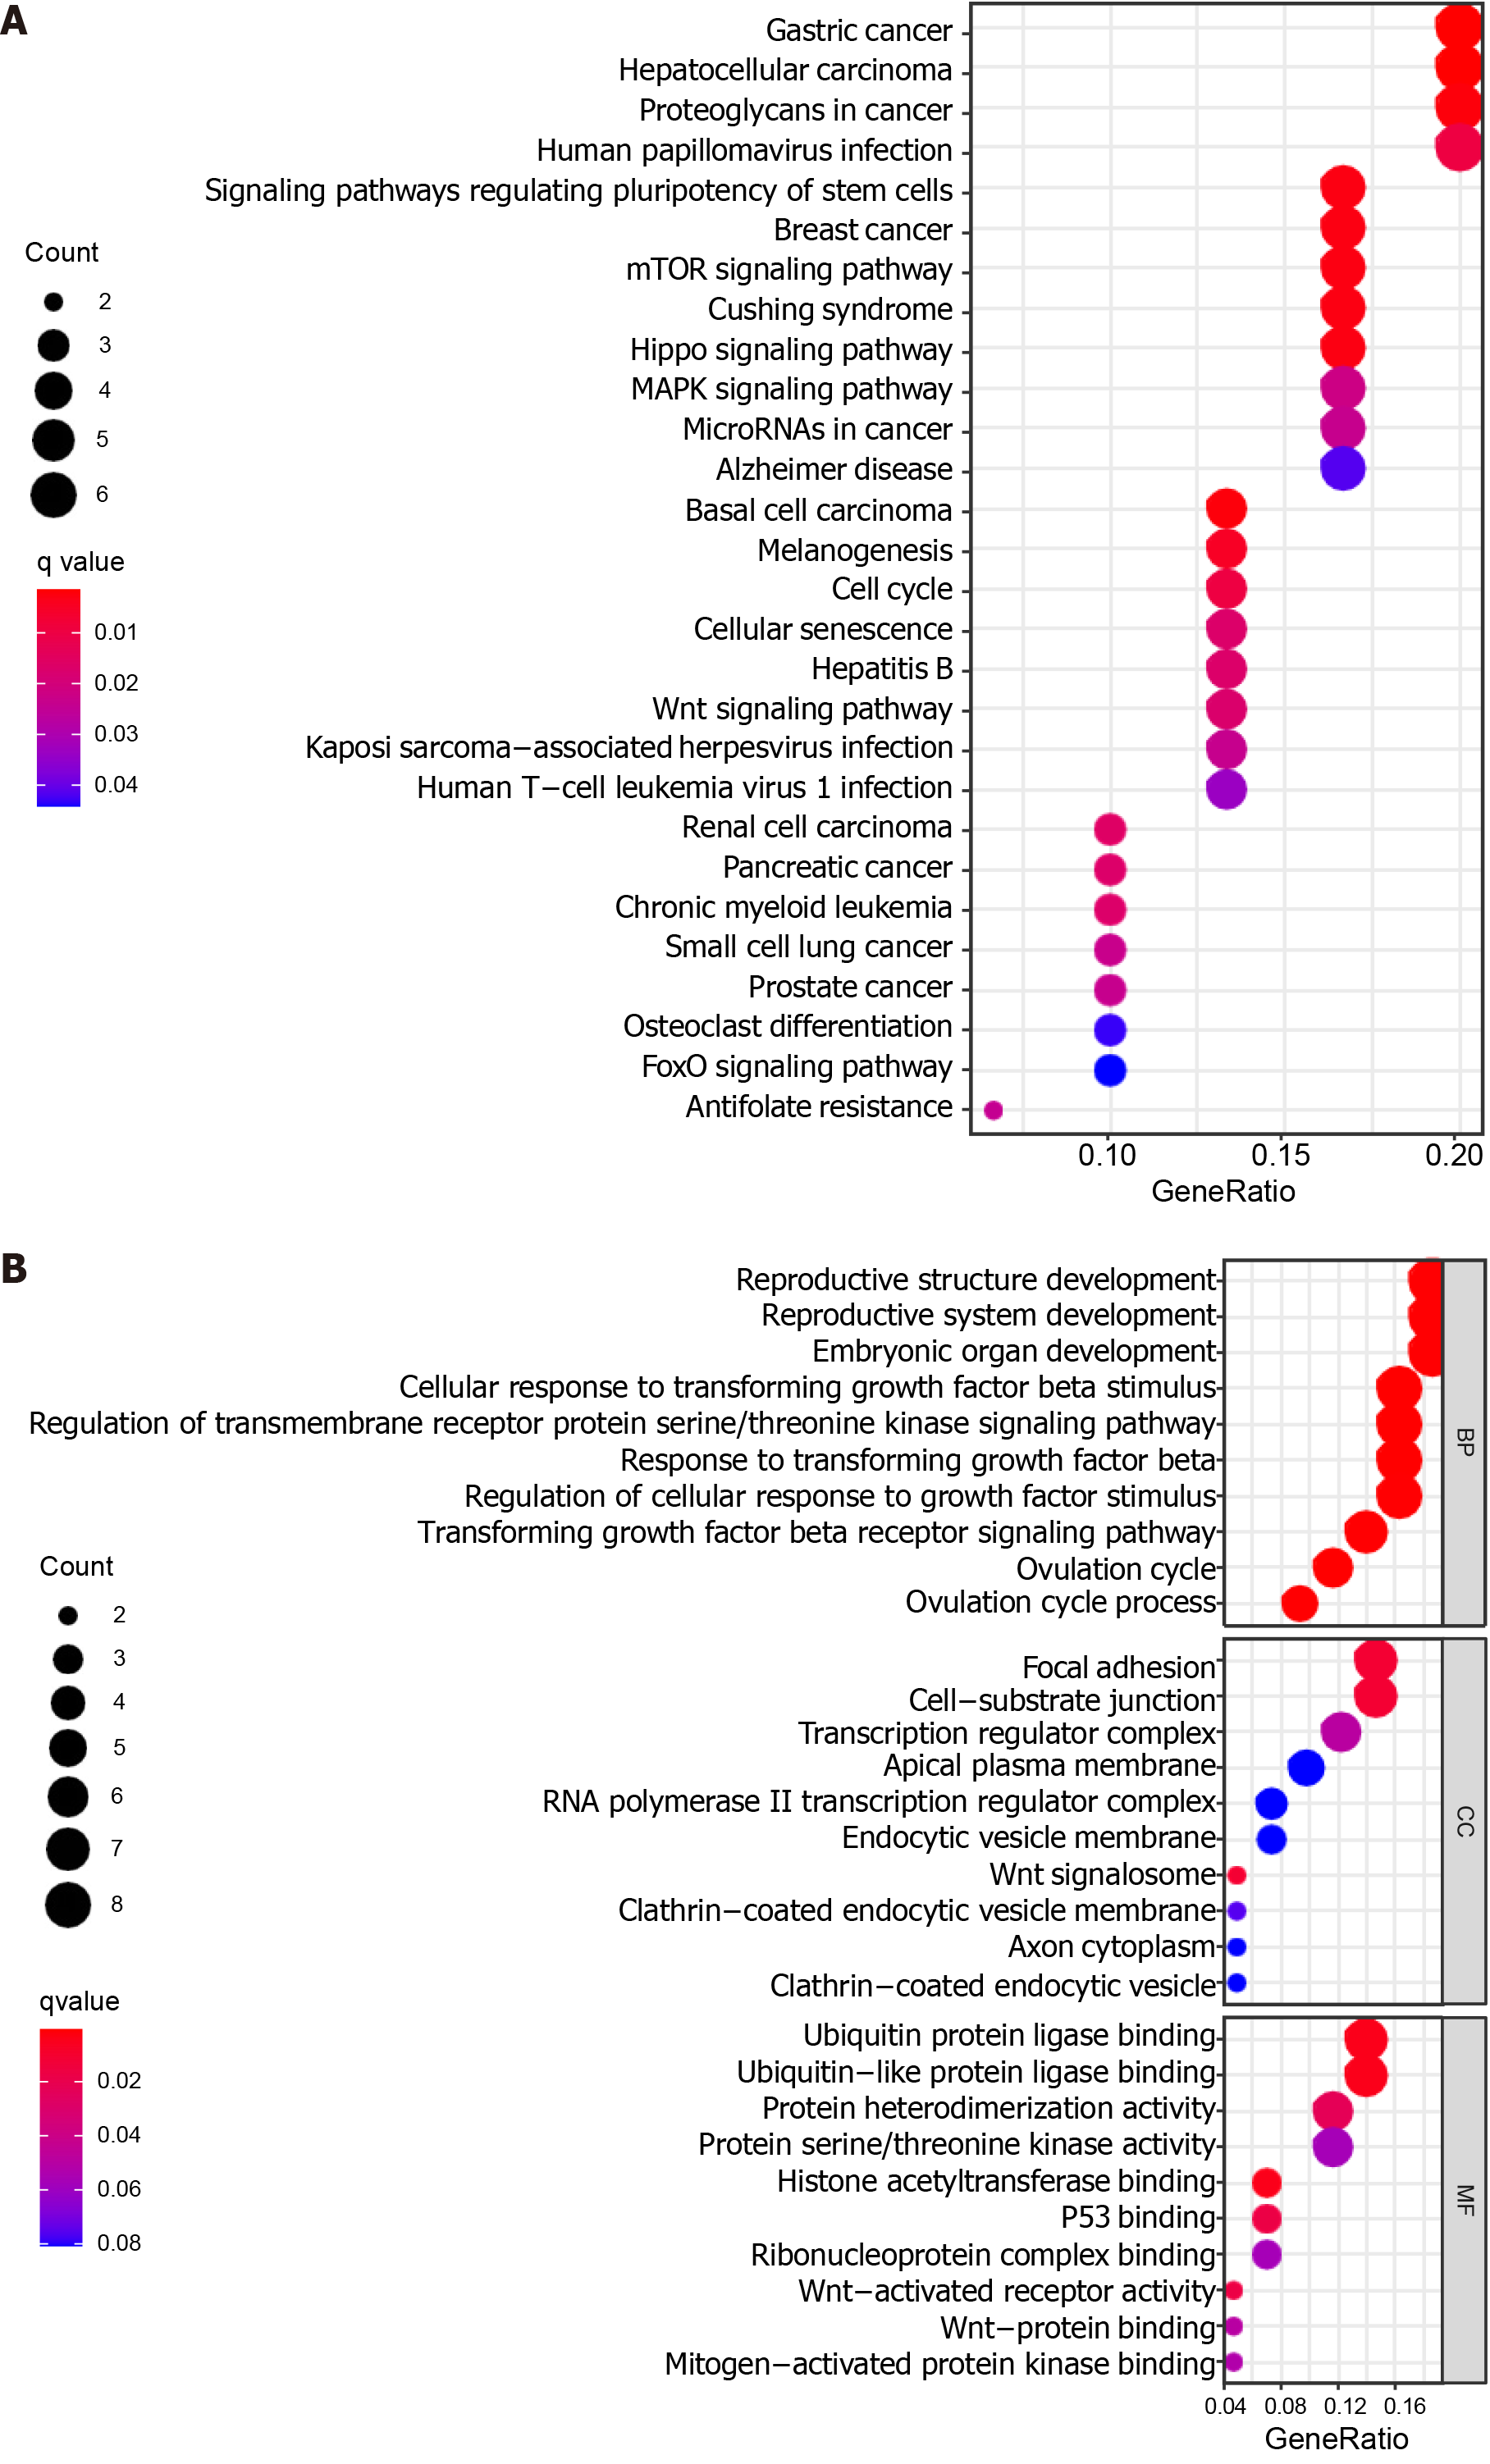
Figure 6 Functional enrichment analysis of the target genes predicted for miR-627-5p and miR-199a-5p.
A: Kyoto encyclopedia of genes and genomes pathways in enrichment analysis of the target genes; B: Gene ontology enrichment analysis results of the target genes. Bubble color refers to the enrichment q-value, and the size of the bubble represents the gene number. BP: Biological process; CC: Cellular component; MF: Molecular function.
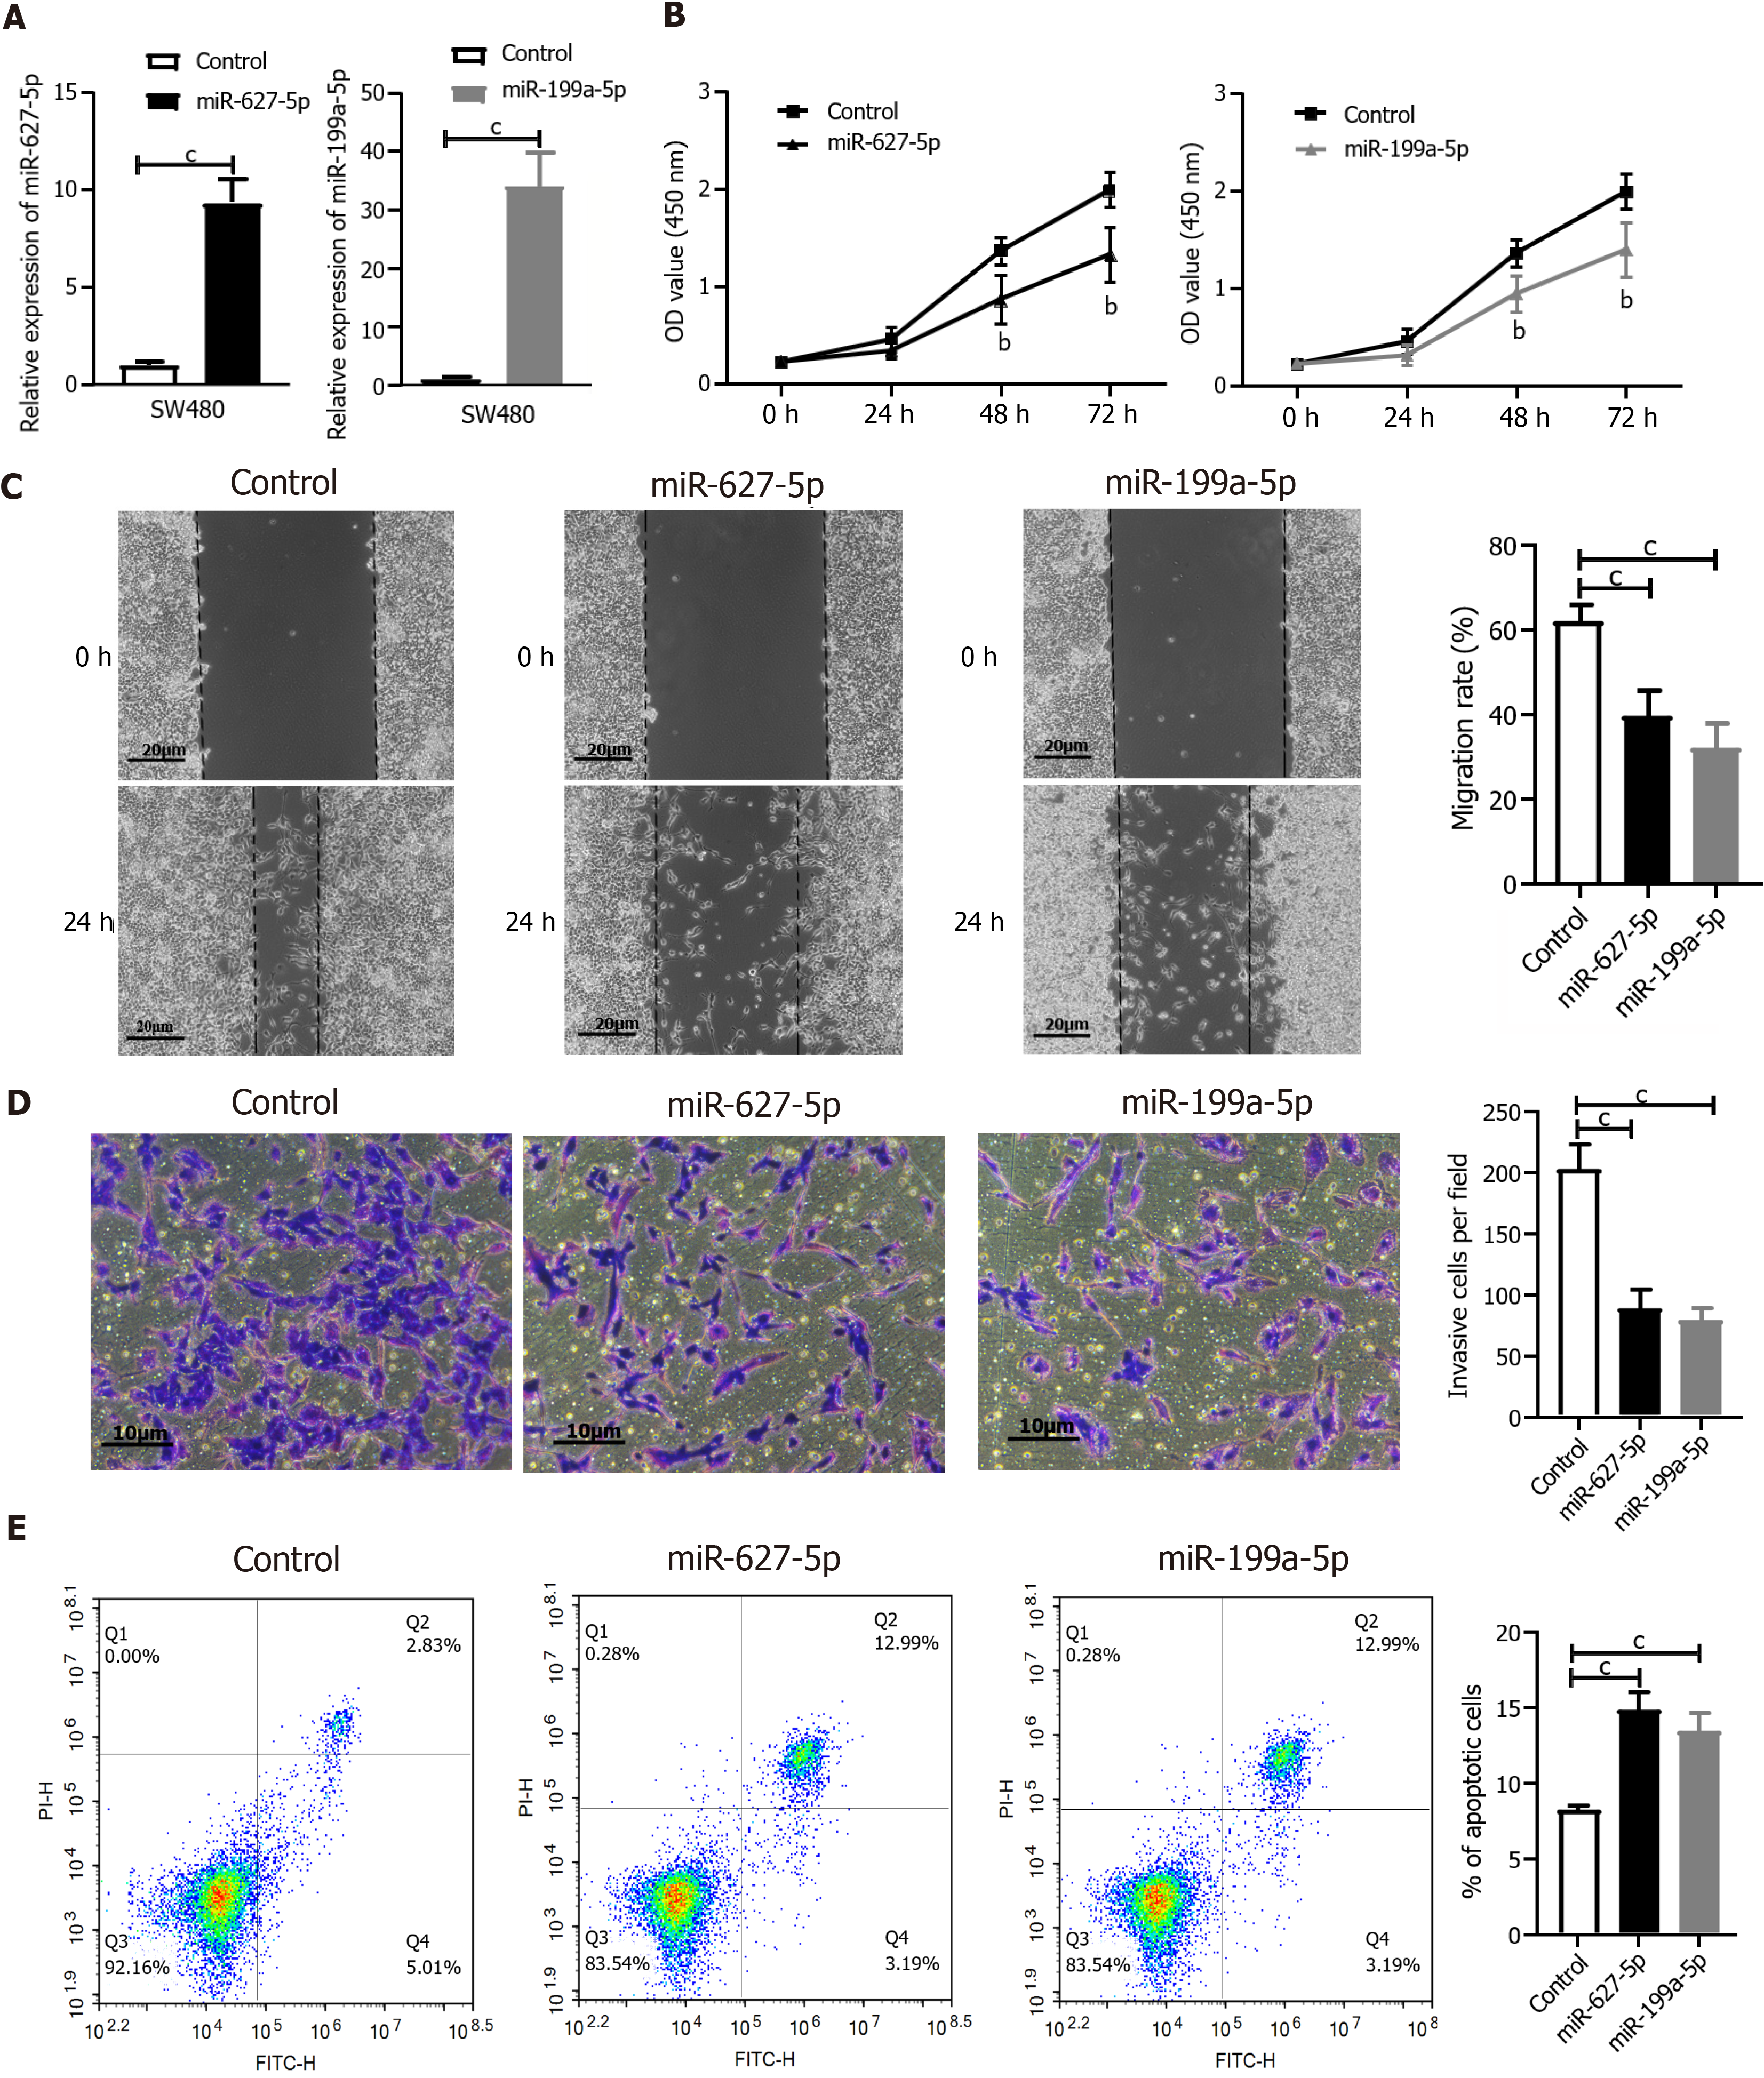
Figure 7 MiR-627-5p and miR-199a-5p acted as tumor suppressors in SW480 cells.
A: The increased levels of miR-627-5p and miR-199a-5p in SW480 cells were confirmed by quantitative real-time polymerase chain reaction after transfection with specifically synthesized mimics; B: Cell counting kit-8 assay showed that miR-627-5p and miR-199a-5p mimics inhibited the viability of SW480 cells compared to the control group; C: Wound healing assay showed that miR-627-5p and miR-199a-5p mimics inhibited the migration ability of SW480 cells; D: Transwell invasion assay revealed that miR-627-5p and miR-199a-5p mimics reduced the number of invasive cells; E: Flow cytometry showed that overexpression of miR-627-5p and miR-199a-5p increased the level of cell apoptosis in SW480 cells. bP < 0.01 vs control group; cP < 0.001 vs control group.
- Citation: Zhao DY, Zhou L, Yin TF, Zhou YC, Zhou GYJ, Wang QQ, Yao SK. Circulating miR-627-5p and miR-199a-5p are promising diagnostic biomarkers of colorectal neoplasia. World J Clin Cases 2022; 10(16): 5165-5184
- URL: https://www.wjgnet.com/2307-8960/full/v10/i16/5165.htm
- DOI: https://dx.doi.org/10.12998/wjcc.v10.i16.5165


