Copyright
©The Author(s) 2022.
World J Clin Cases. Jun 6, 2022; 10(16): 5124-5132
Published online Jun 6, 2022. doi: 10.12998/wjcc.v10.i16.5124
Published online Jun 6, 2022. doi: 10.12998/wjcc.v10.i16.5124
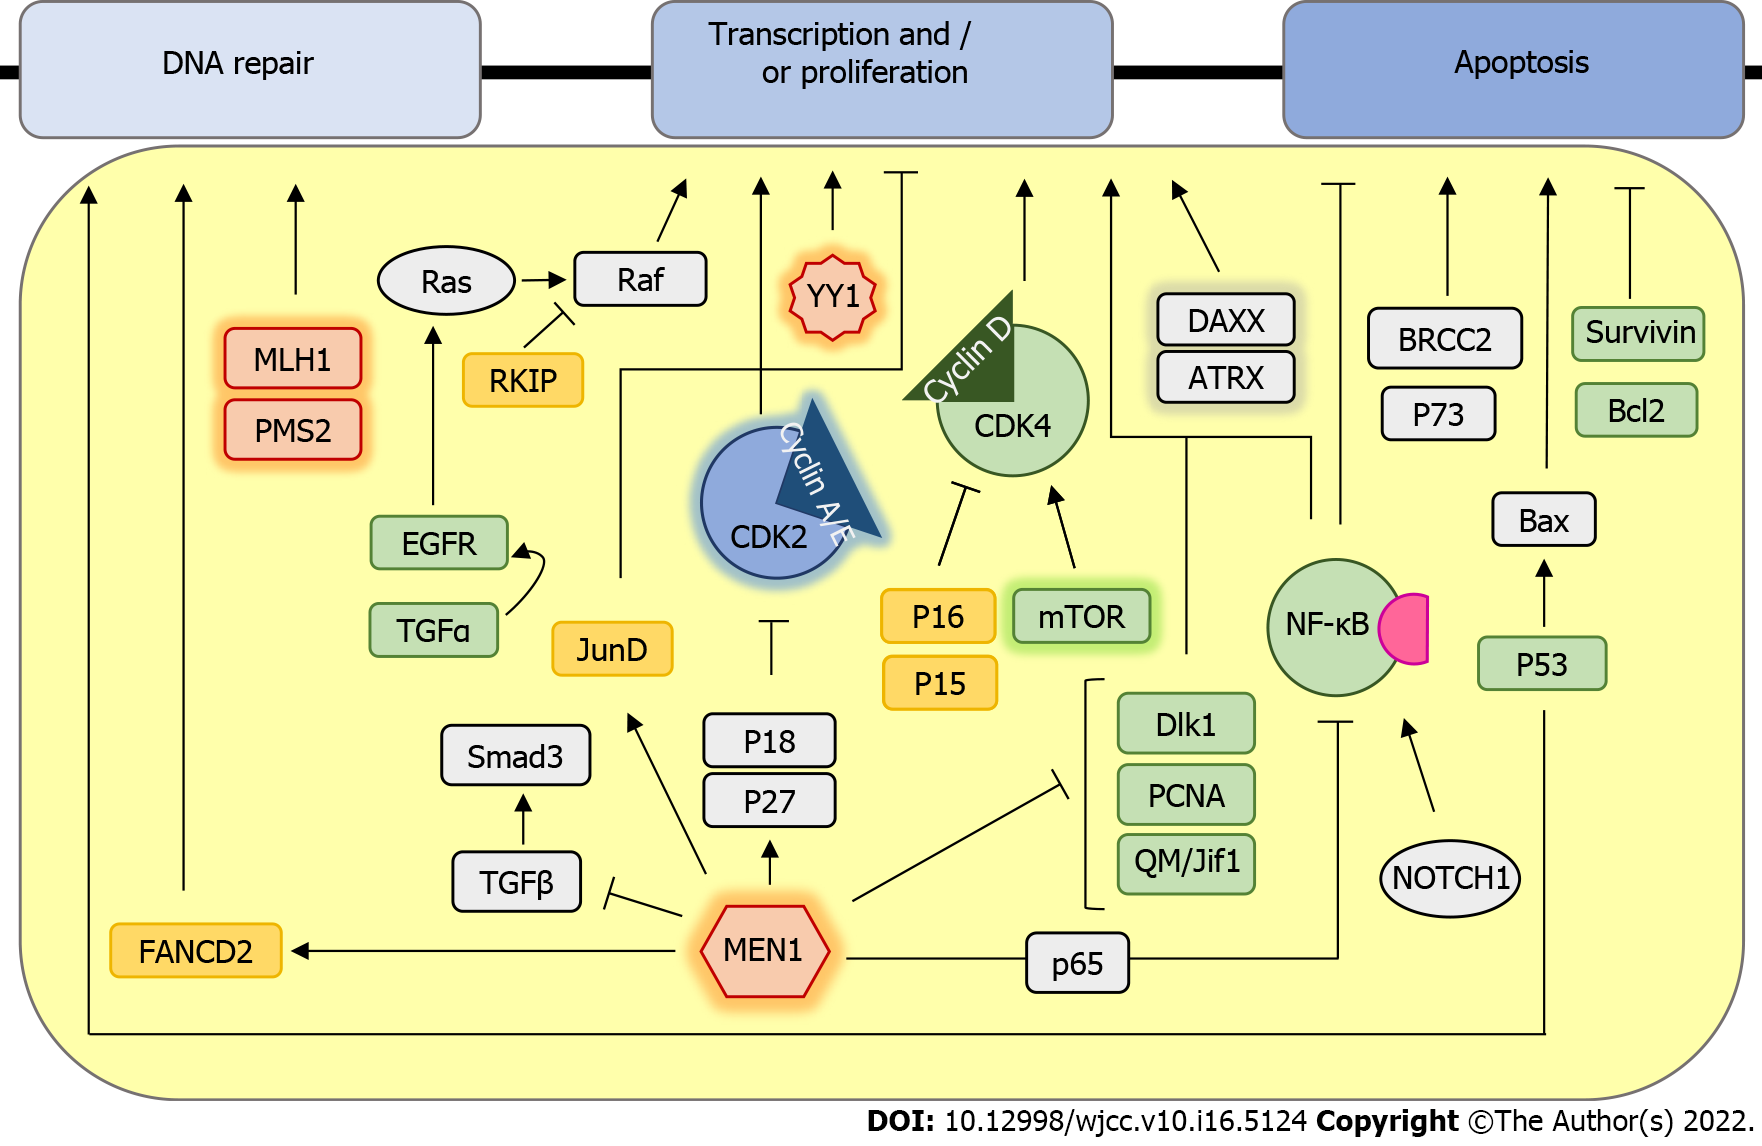
Figure 1 Schematic representation of signaling pathways involved in insulinoma development.
Proteins that are mutated are marked in red, downregulated or with a loss of function are marked in yellow, and those with a gain of function or overexpression are highlighted in green. Proteins whose role is ambiguous are colored grey. Genes and proteins that are differentially expressed only in malignant insulinomas are highlighted in glow.
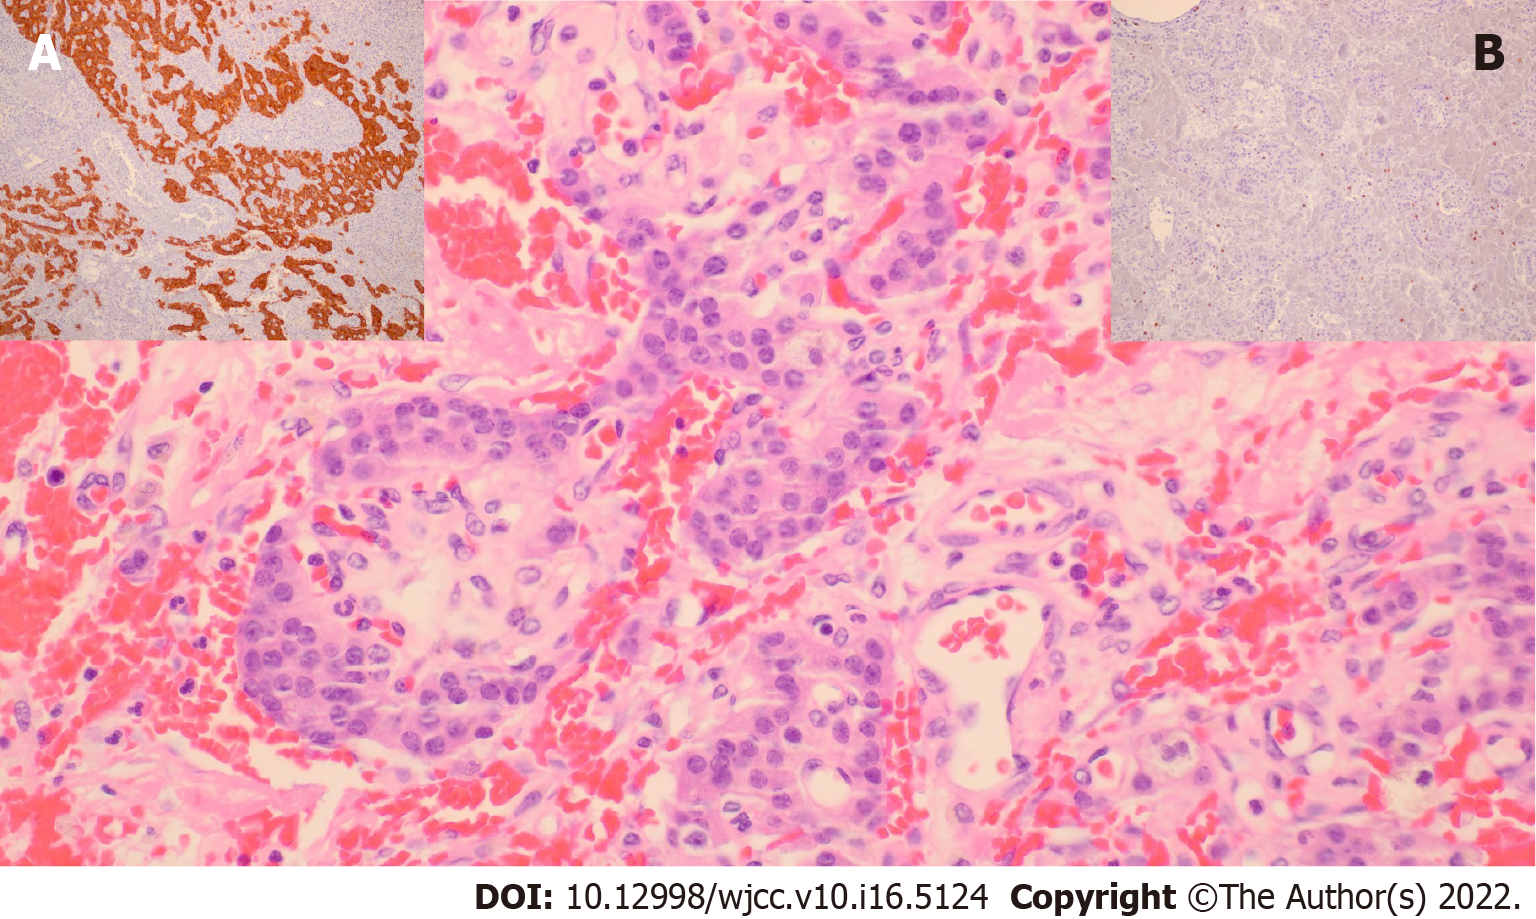
Figure 2 Pathohistological appearance of malignant insulinoma.
One of our own cases, G2 pancreatic neuroendocrine tumor, exhibited small nests of uniform cells showing infiltrative growth pattern (hemalaun and eosin, × 400). A; Brown cytoplasmic staining in tumorous cells (synaptophysin, × 100), B; Low Ki-67 proliferation index of up to 7% (Ki-67, ×200).
- Citation: Cigrovski Berkovic M, Ulamec M, Marinovic S, Balen I, Mrzljak A. Malignant insulinoma: Can we predict the long-term outcomes? World J Clin Cases 2022; 10(16): 5124-5132
- URL: https://www.wjgnet.com/2307-8960/full/v10/i16/5124.htm
- DOI: https://dx.doi.org/10.12998/wjcc.v10.i16.5124


