Copyright
©The Author(s) 2022.
World J Clin Cases. Apr 16, 2022; 10(11): 3561-3572
Published online Apr 16, 2022. doi: 10.12998/wjcc.v10.i11.3561
Published online Apr 16, 2022. doi: 10.12998/wjcc.v10.i11.3561
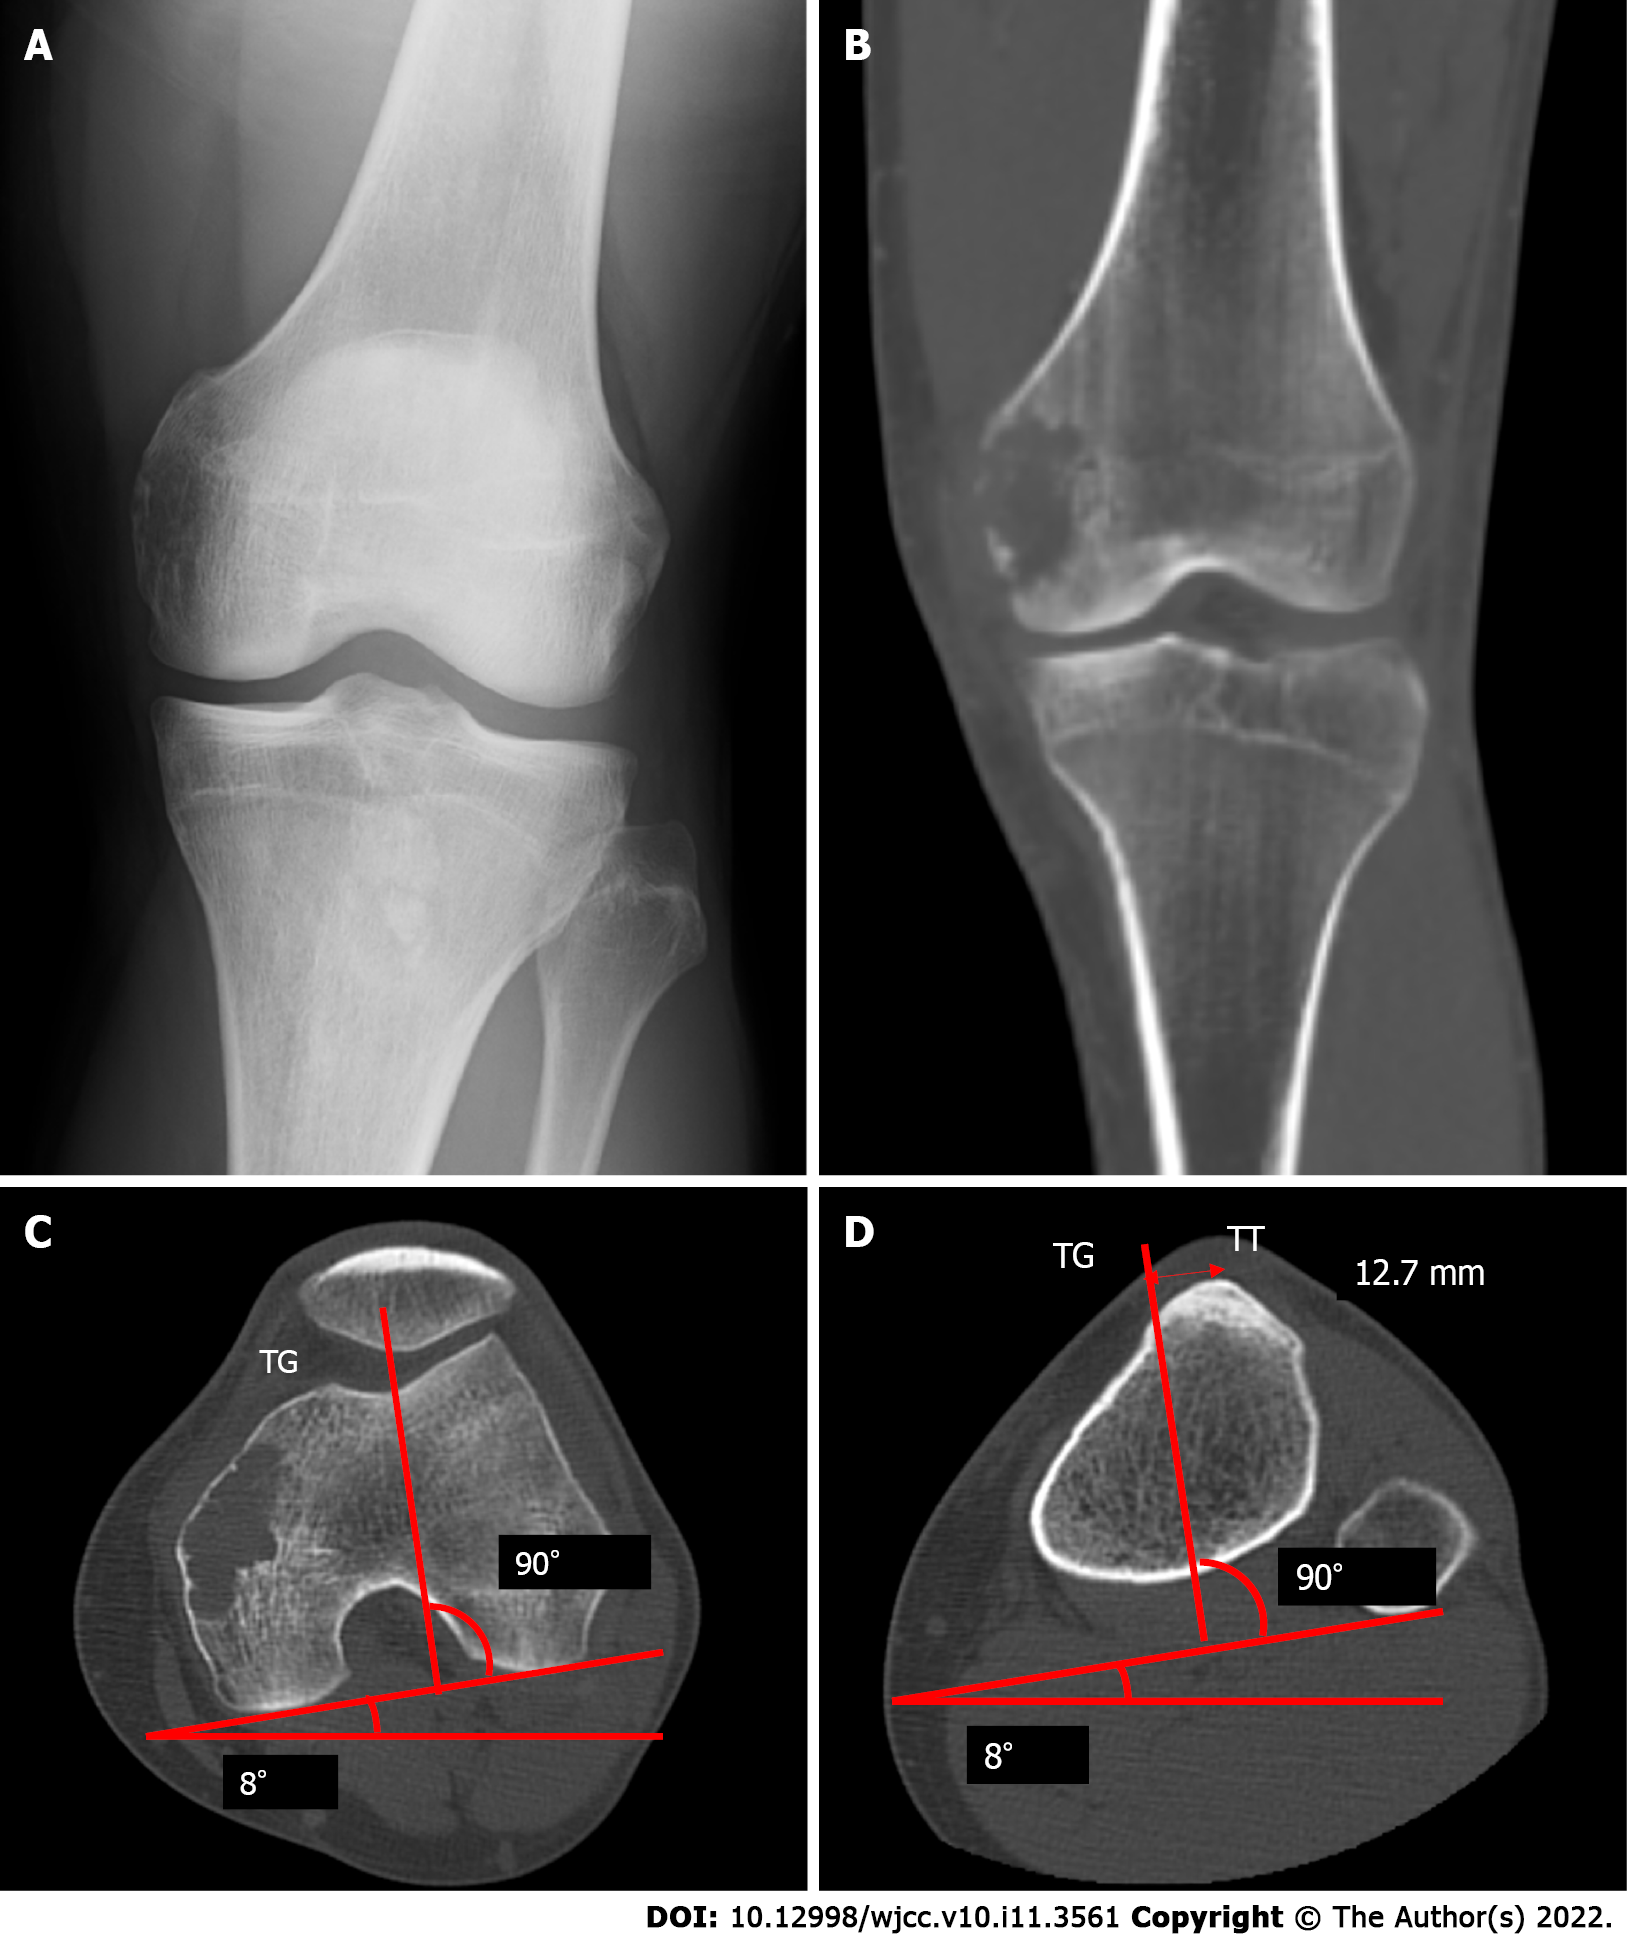
Figure 1 Images before the primary surgery.
A: Radiograph showing osteolytic lesion in the left distal femur; B: Computed tomography scan also showing the lesion; C and D: The axial radiographic view of computed tomography before the primary operation, line from the middle of the tibial tuberosity (TT) to the bottom of the trochlear groove (TG) is drawn parallel to the posterior condyle line,and the distance between TT and TG is 12.7 mm. TT: Tibial tuberosity; TG: Trochlear groove.
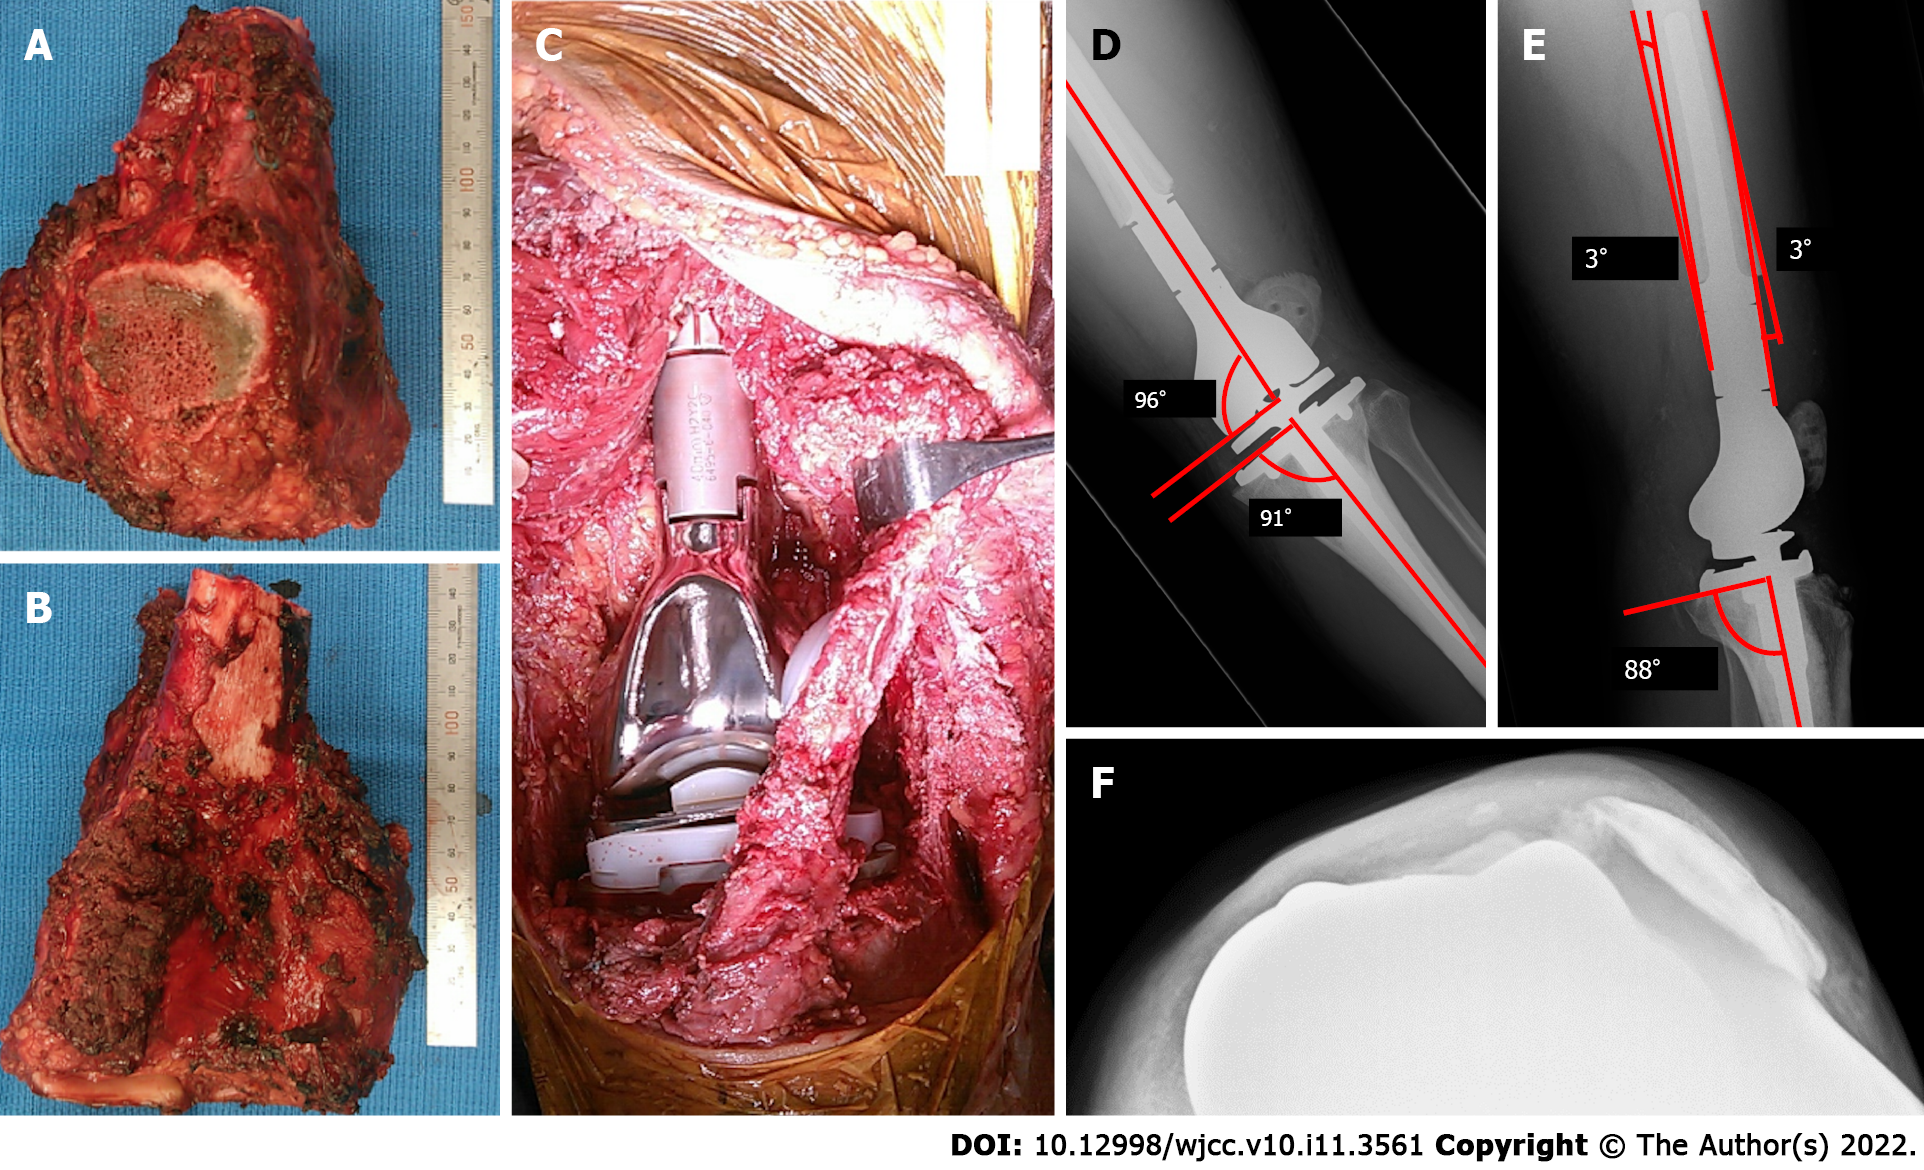
Figure 2 Photographic images during the primary surgery, and radiograph postoperatively.
A: The anterior view of the resected specimen and the longitudinally split patellar are shown; B: The posterior view of the resected specimen; C: After removal of the tumor, a tumor endoprosthesis was implanted; D and E: Patellar subluxation is found in radiograph at 1 wk postoperatively. The radiograph of the left knee shows the measurement of the coronal alignment of the femoral and tibial components. The overall anatomical alignment is defined as the angle between the femoral anatomical axis and the tibial anatomical axis (D); the lateral radiograph of the left knee shows the measurement of the sagittal alignment of the femoral and tibial components (E); F: The radiograph shows lateral luxation of the patellar at 1 mo postoperatively.
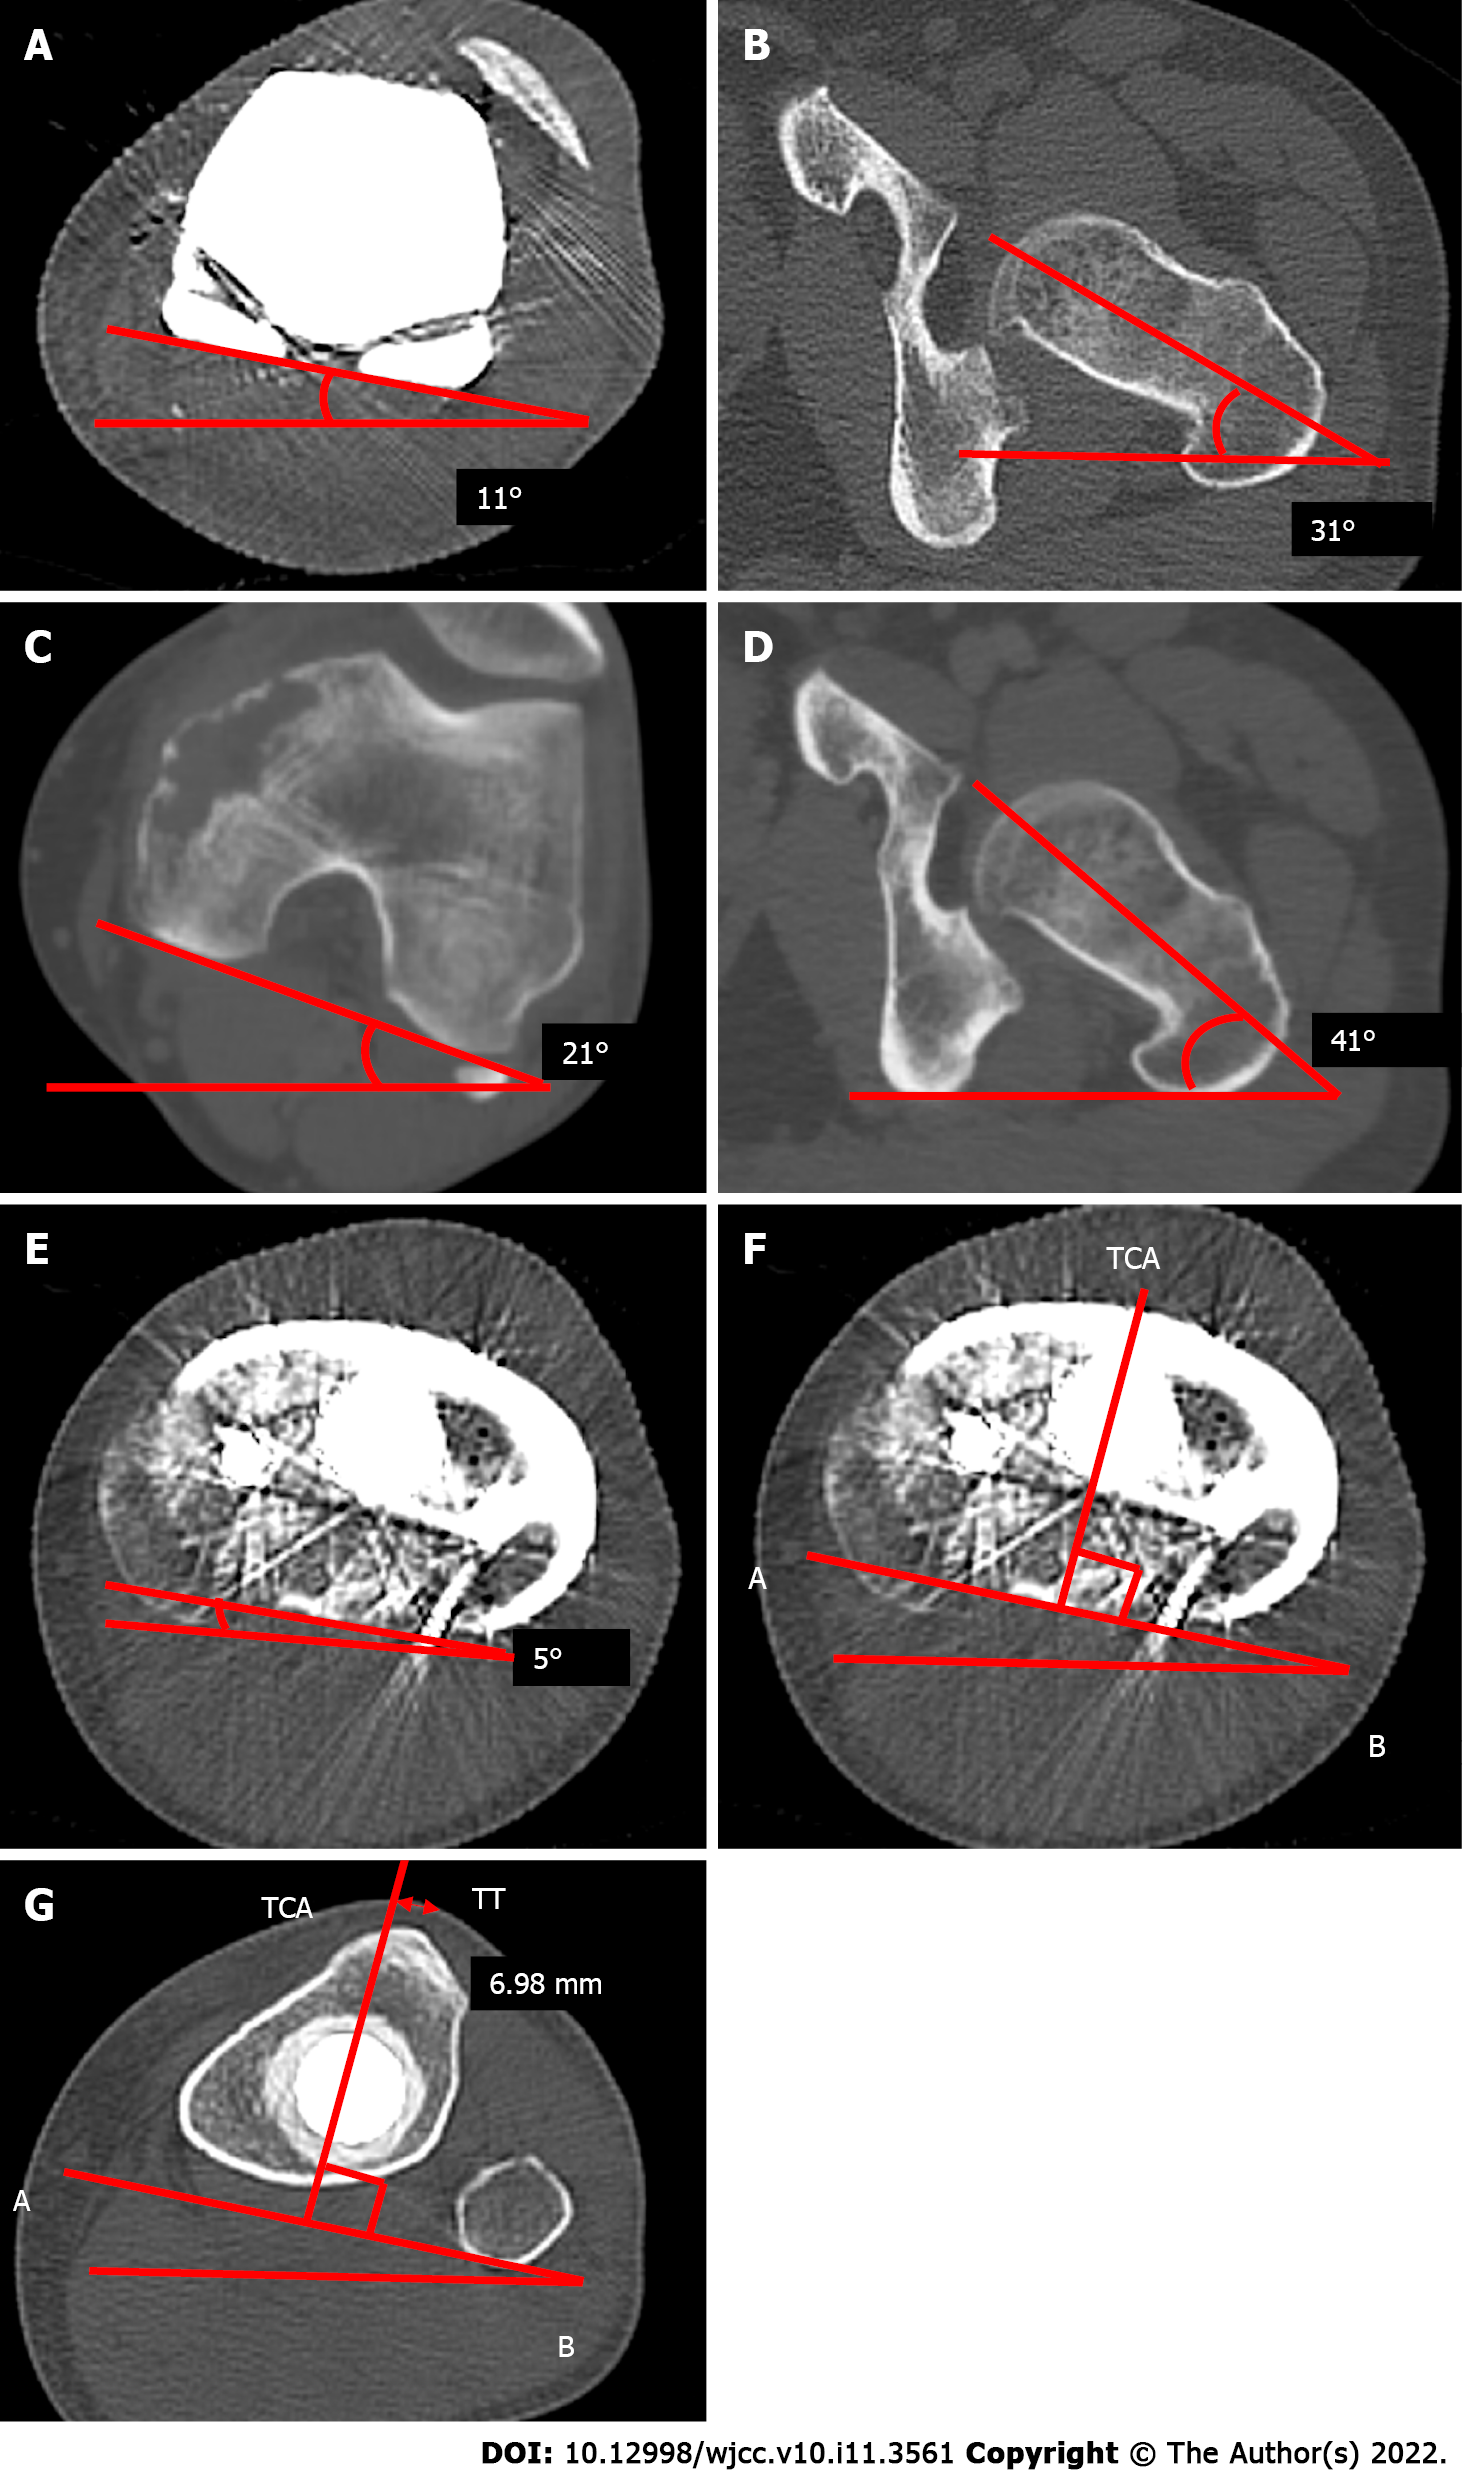
Figure 3 The computed tomography of a femoral axial and tibial axial view after or before the primary operation.
A-D: The computed tomography (CT) imaging of a femoral axial after (A and B) and before (C and D) the primary operation, which shows that the postoperative angle between the femoral component and the femoral neck axis (A and B) is equal to the preoperative angle between the femoral posterior condylar axis and femoral neck axis (C and D); E-G: A CT scan shows the axial rotation of the tibial component in relation to the posterior margins of the tibial plateau and the tibial bearing after the primary operation. The line AB is drawn along the posterior margin of the tibial tray. The tibial component axis (TCA) is perpendicular to line AB (E and F); the perpendicular distance from the TCA to the tip of the tibial tuberosity is 6.98 mm (G). TCA: Tibial component axis; TT: Tibial tuberosity.
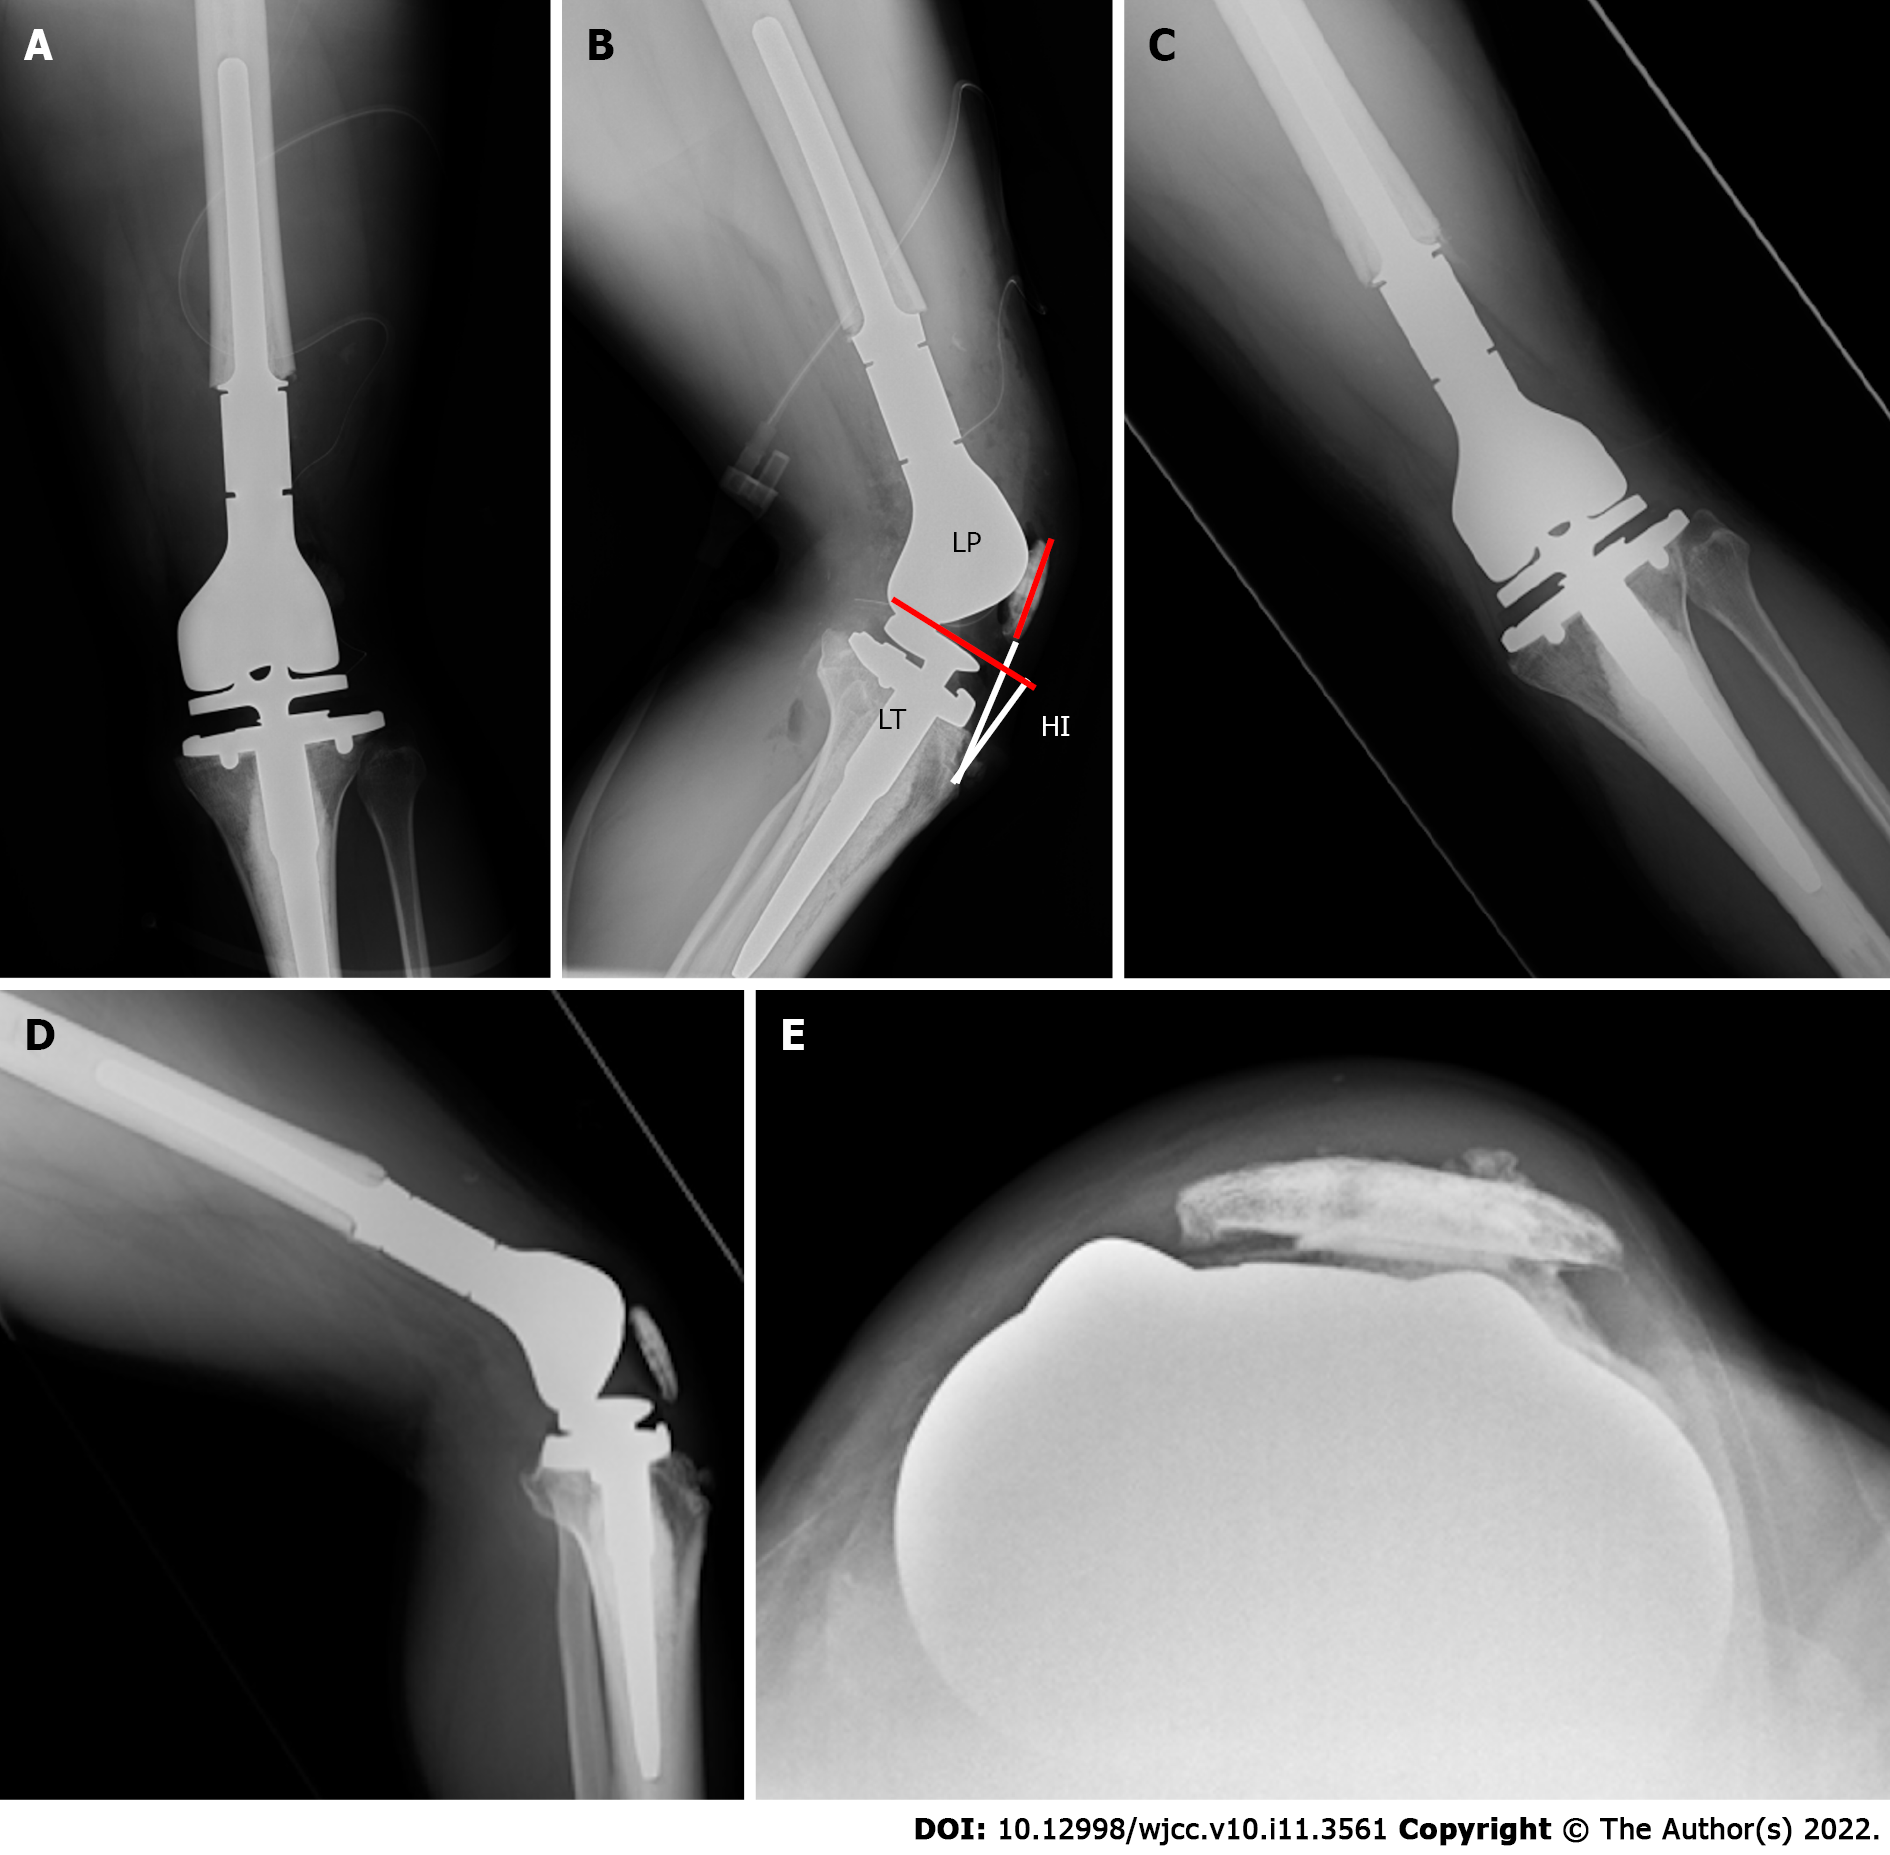
Figure 4 Radiographs after the secondary operation.
A and B: Anteroposterior (AP) view (A) and (B) lateral view which show that the measurement of the patellar position Insall-Salvati ratio is 1.15, and the length of the patellar tendon (LT)/height of the patellar tendon insertion (HI) ratio is 1.27; C-E: Radiograph 9 mo after the proximal realignment operation which shows no patellar dislocation. LP: Length of the patellar; HI: Height of the insertion; LT: Length of the tendon.
- Citation: Kubota Y, Tanaka K, Hirakawa M, Iwasaki T, Kawano M, Itonaga I, Tsumura H. Patellar dislocation following distal femoral replacement after extra-articular knee resection for bone sarcoma: A case report. World J Clin Cases 2022; 10(11): 3561-3572
- URL: https://www.wjgnet.com/2307-8960/full/v10/i11/3561.htm
- DOI: https://dx.doi.org/10.12998/wjcc.v10.i11.3561


