Copyright
©The Author(s) 2022.
World J Clin Cases. Apr 16, 2022; 10(11): 3436-3448
Published online Apr 16, 2022. doi: 10.12998/wjcc.v10.i11.3436
Published online Apr 16, 2022. doi: 10.12998/wjcc.v10.i11.3436
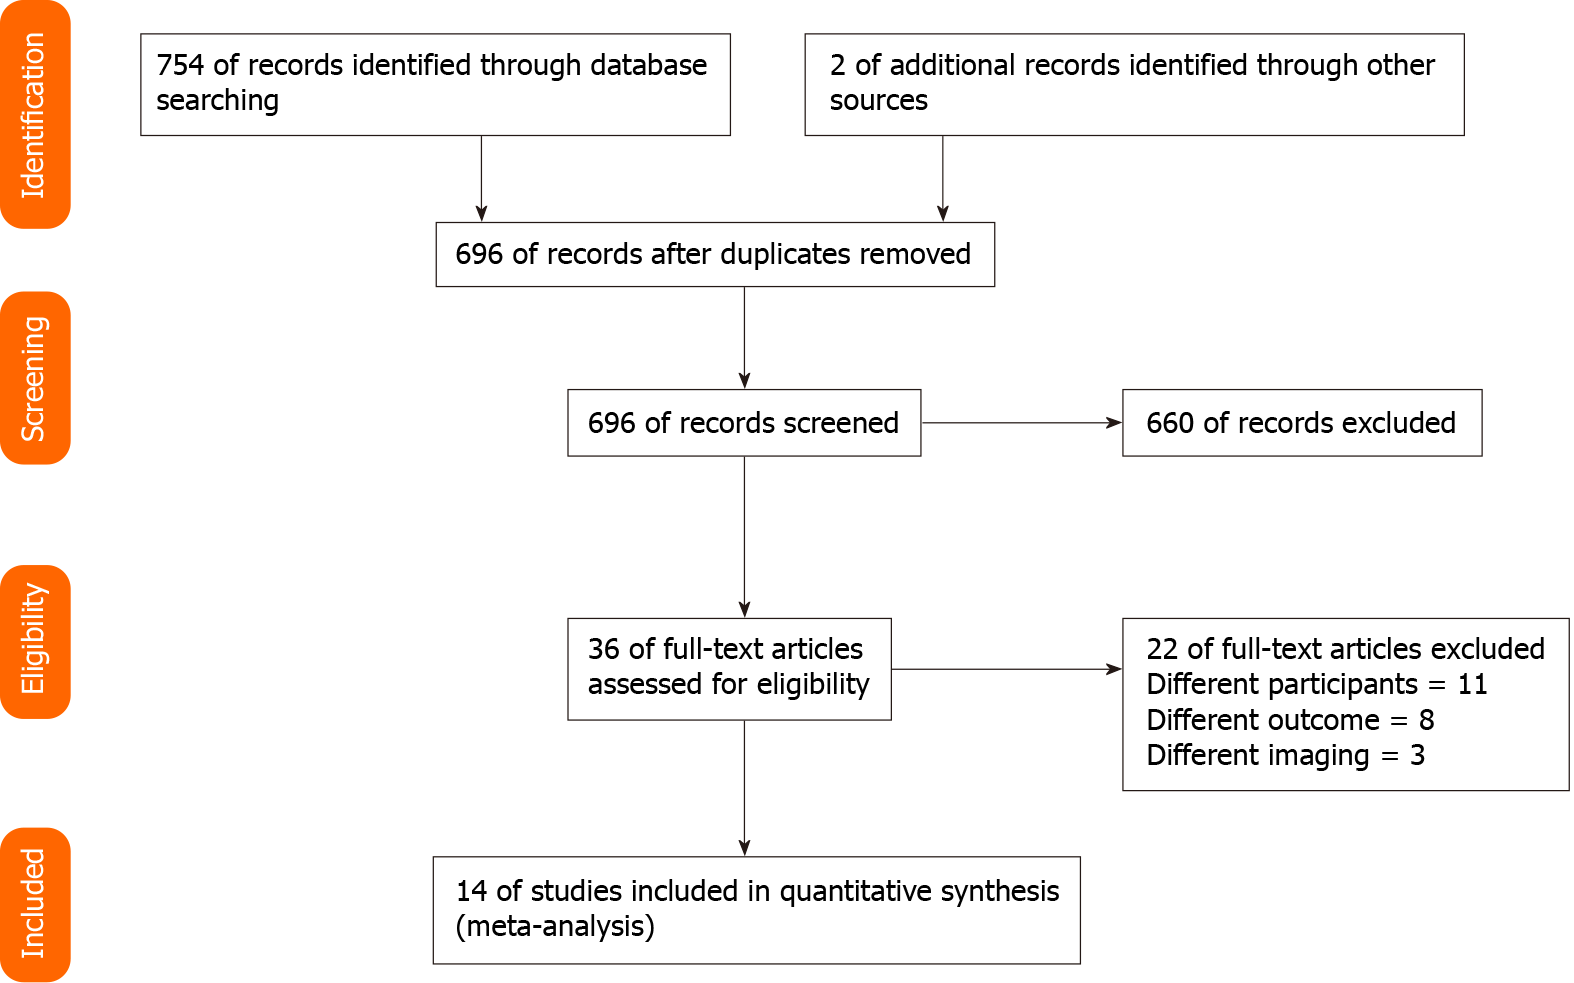
Figure 1 Search strategy.
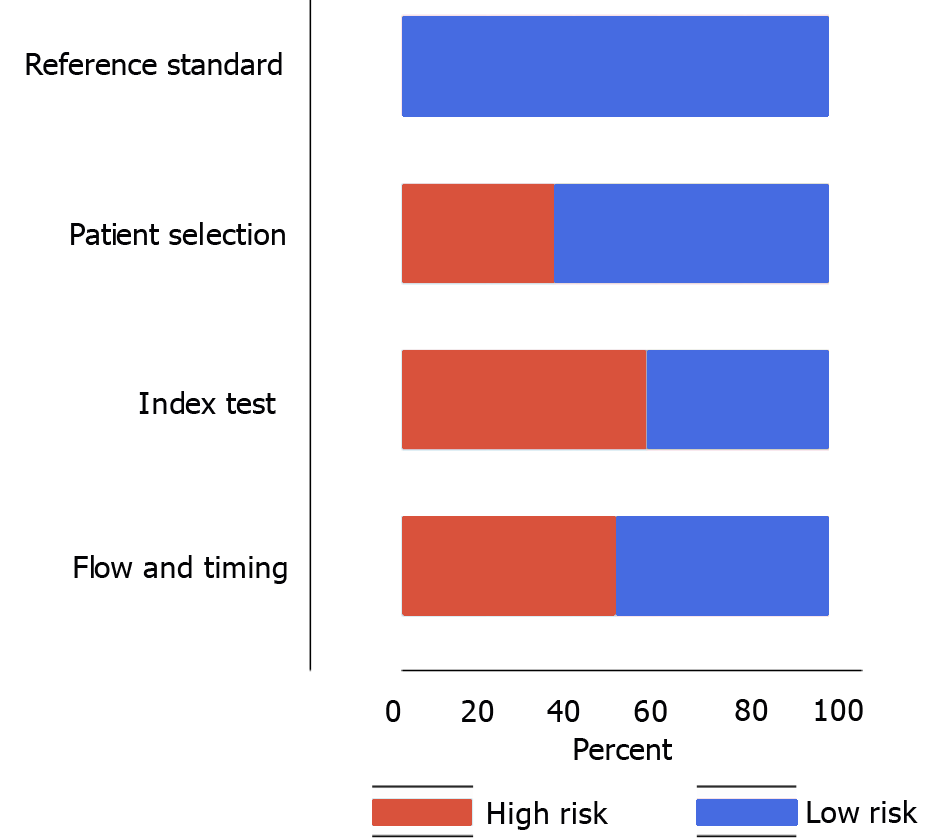
Figure 2 Quality assessment of the included studies based on quality assessment of diagnostic accuracy studies-2 tool (n = 19).
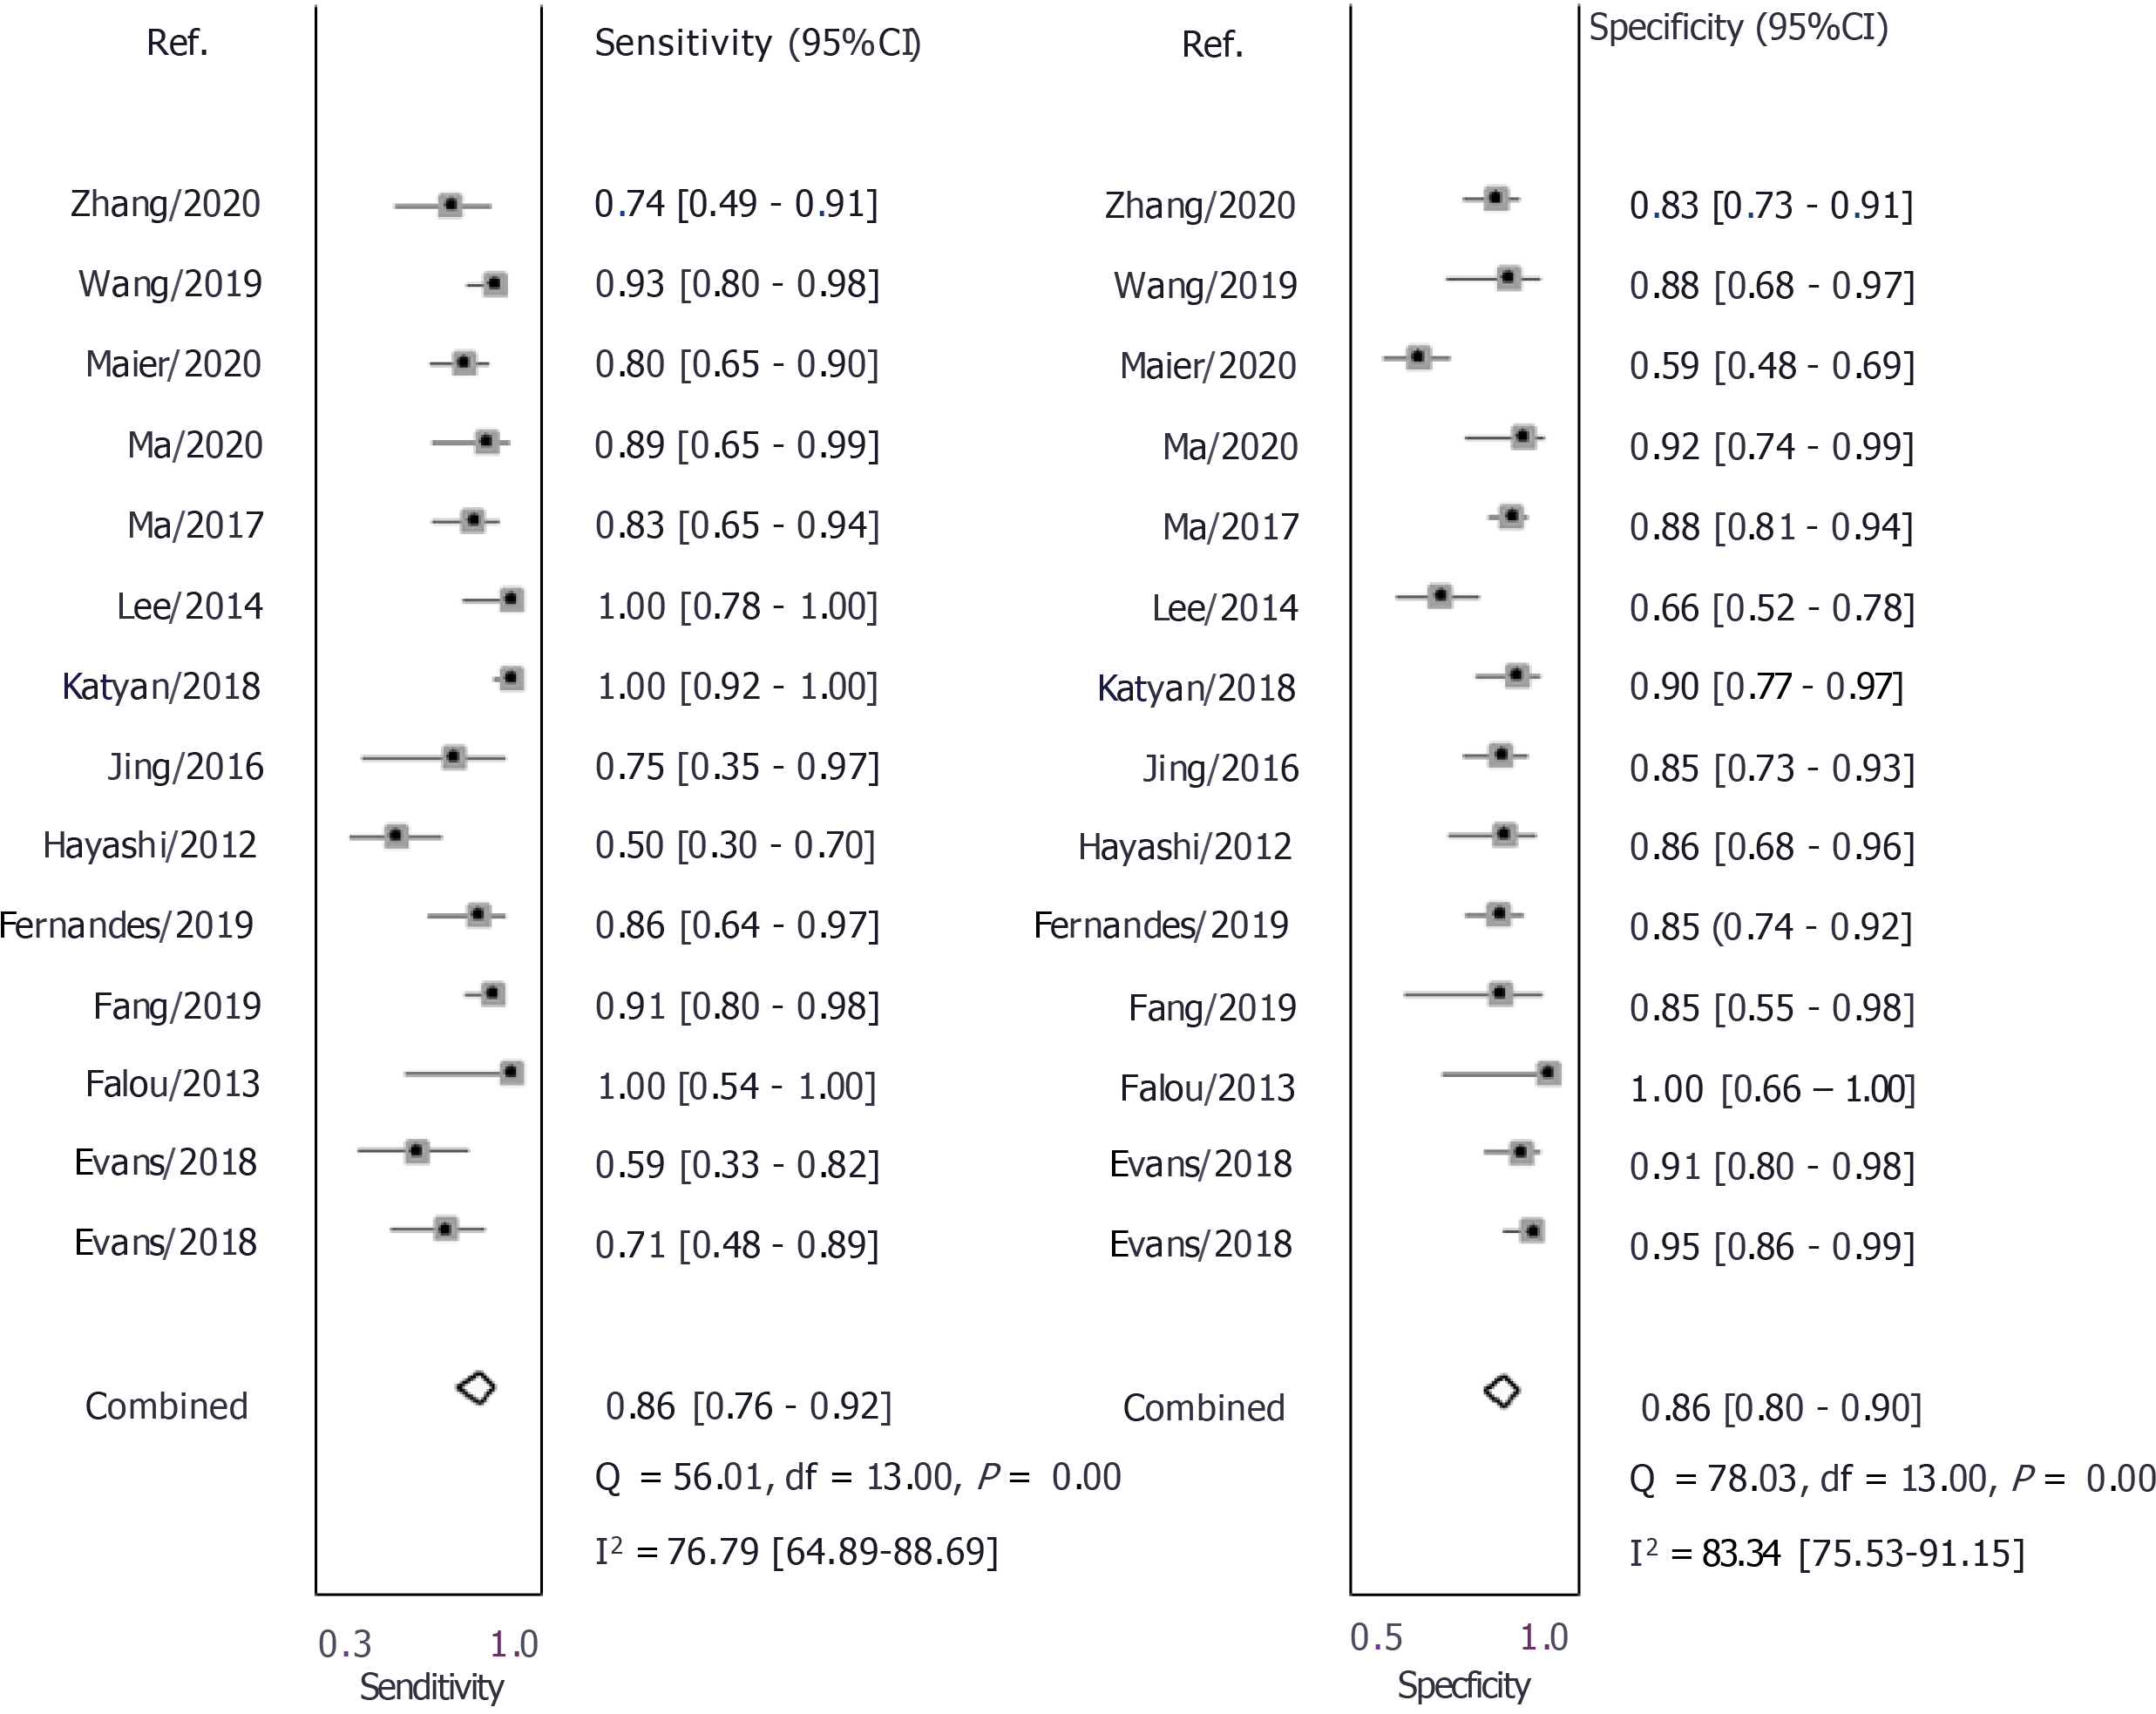
Figure 3 Forest plot showing pooled sensitivity and specificity of ultrasound elastography for predicting pathological complete response following neoadjuvant chemotherapy amongst breast cancer patients.
Q: Q statistic; df: Degree of freedom; I2: I2 statistic for heterogeneity; CI: Confidence interval.
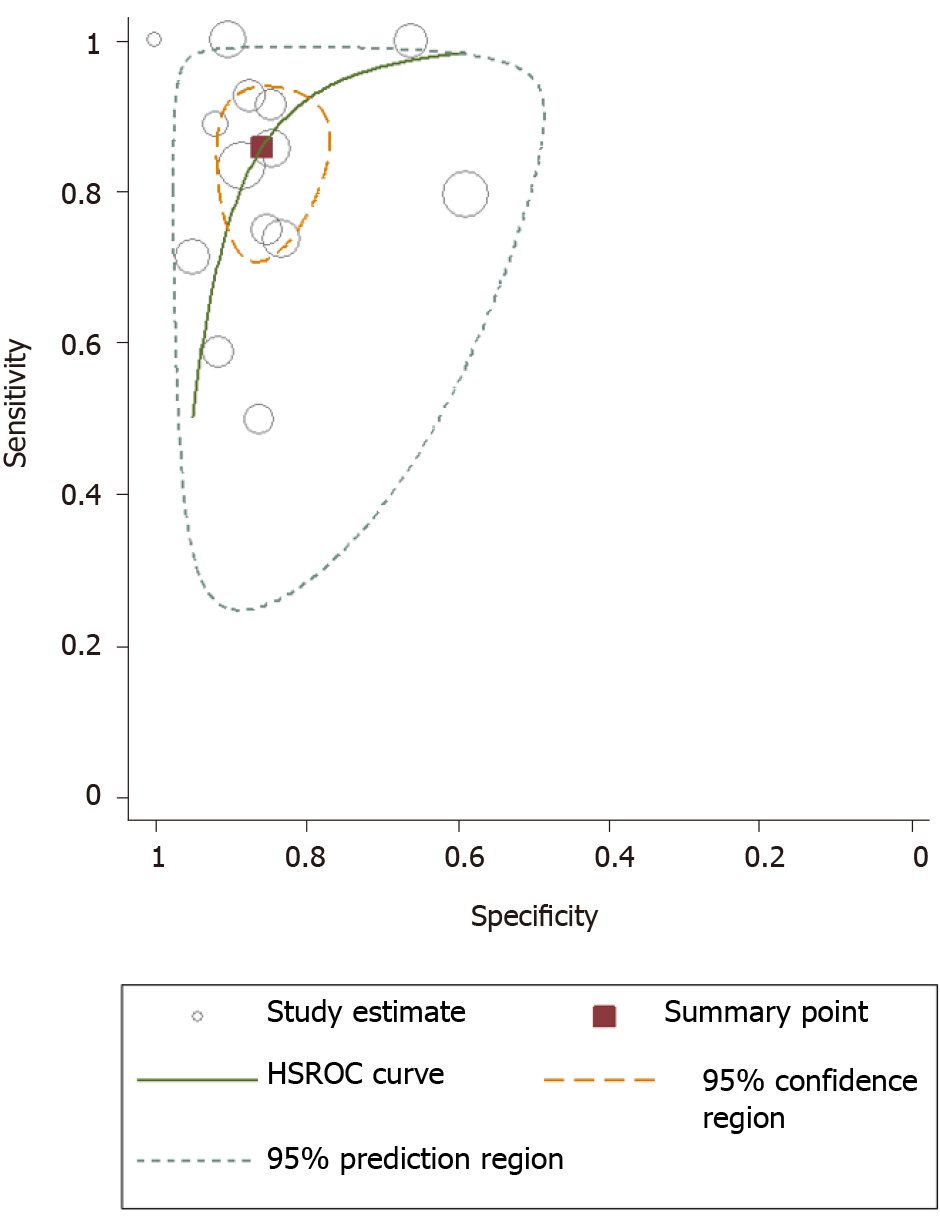
Figure 4 Summary receiver operator characteristic curve of ultrasound elastography for predicting pathological complete response following neoadjuvant chemotherapy amongst breast cancer patients.
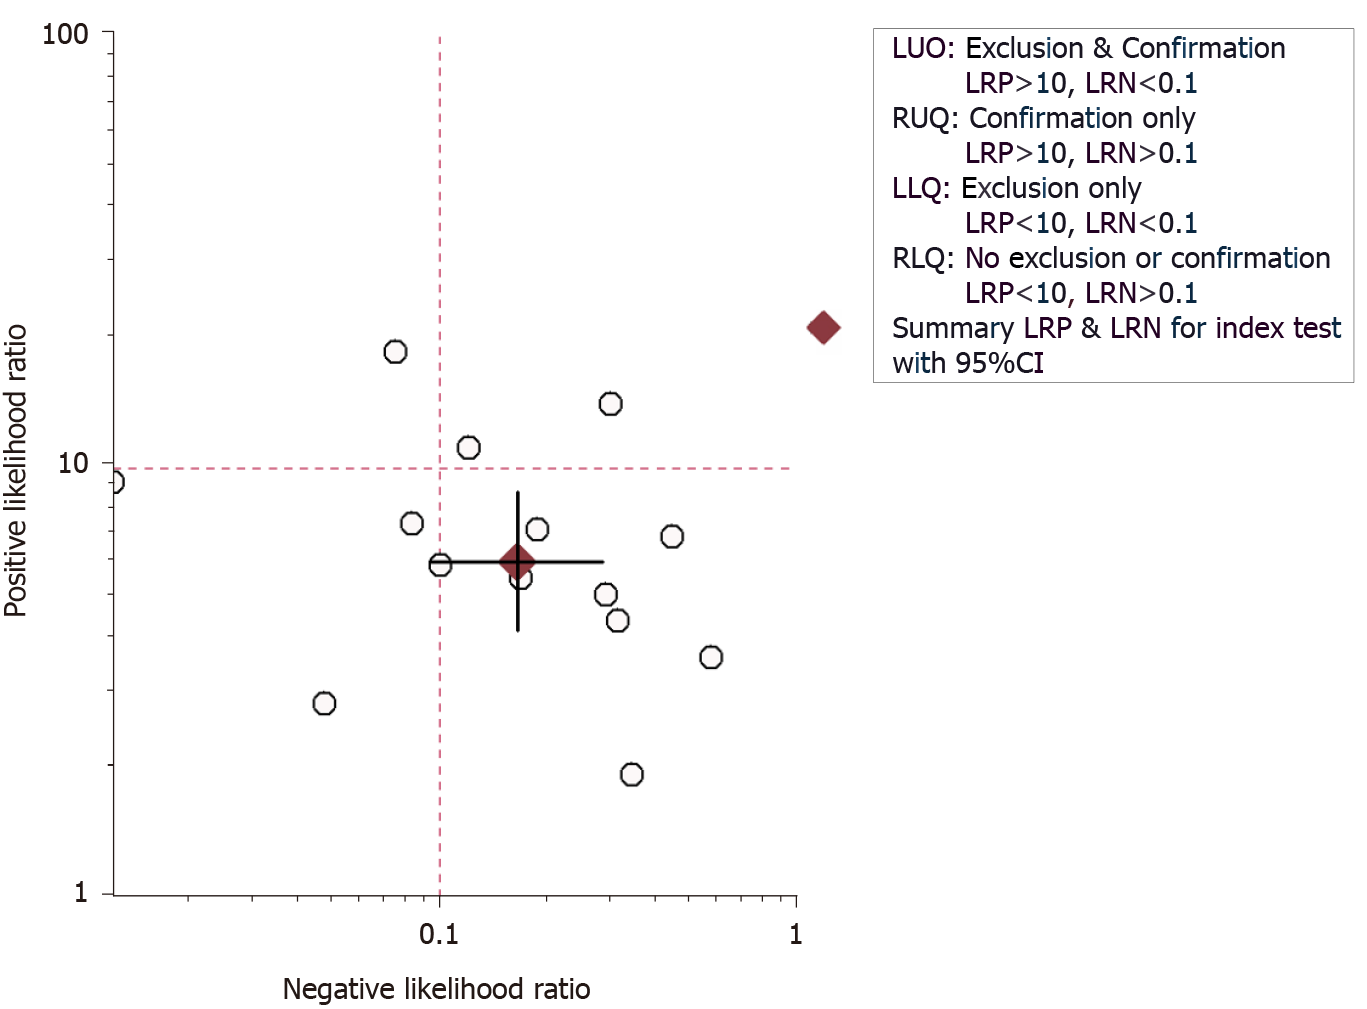
Figure 5 Likelihood scattergram of ultrasound elastography.
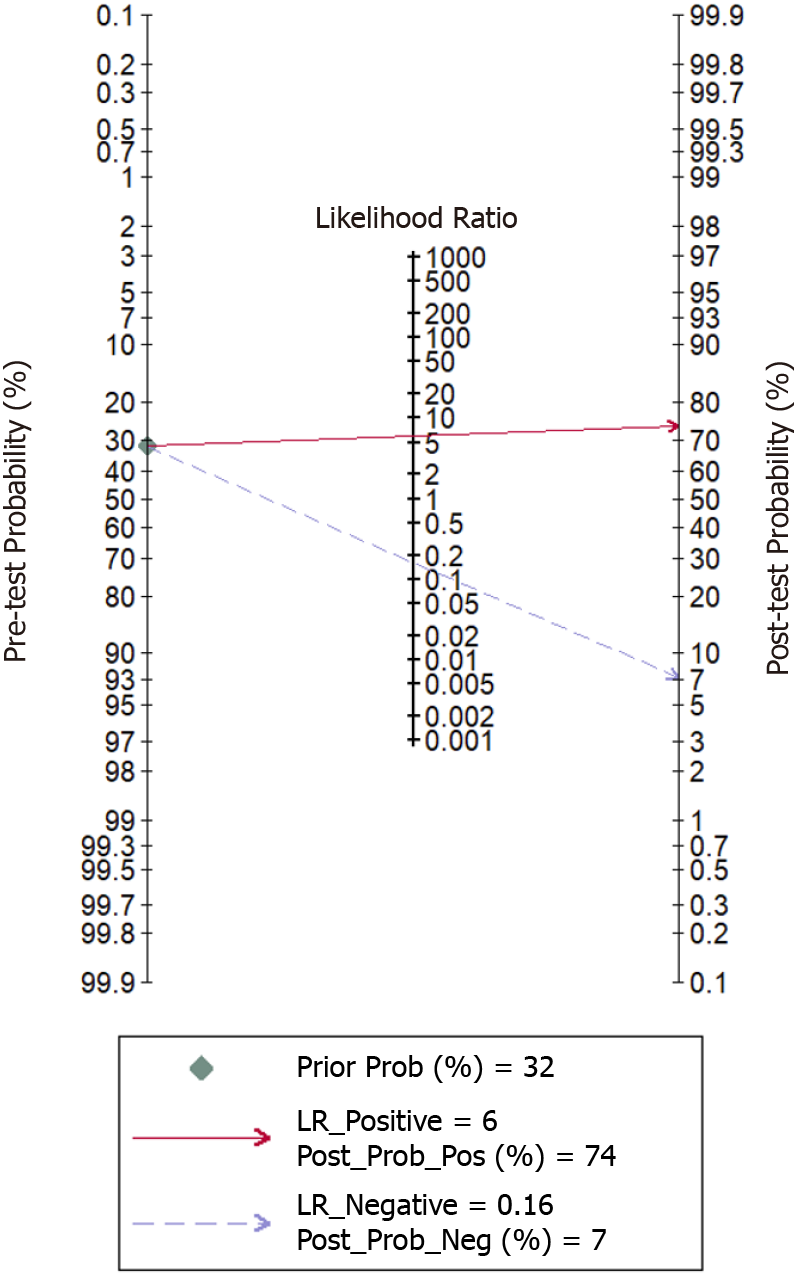
Figure 6 Fagan nomogram of ultrasound elastography.
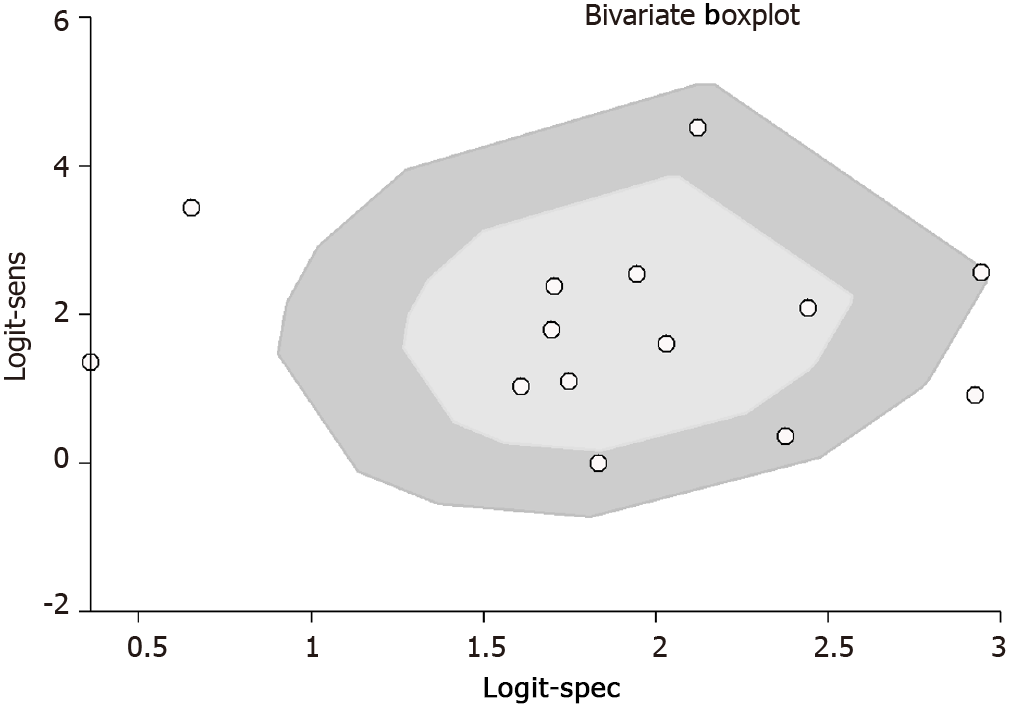
Figure 7 Bivariate boxplot of the sensitivity and specificity of ultrasound elastography.
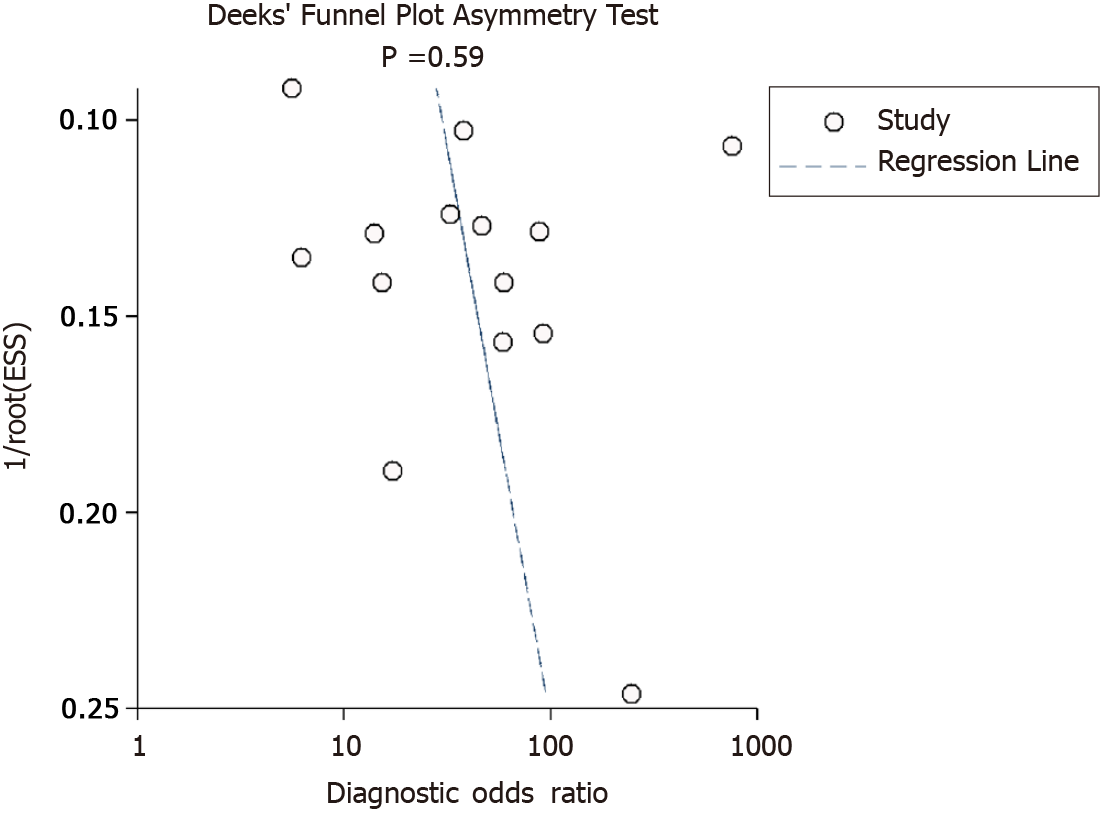
Figure 8 Funnel plot for publication bias.
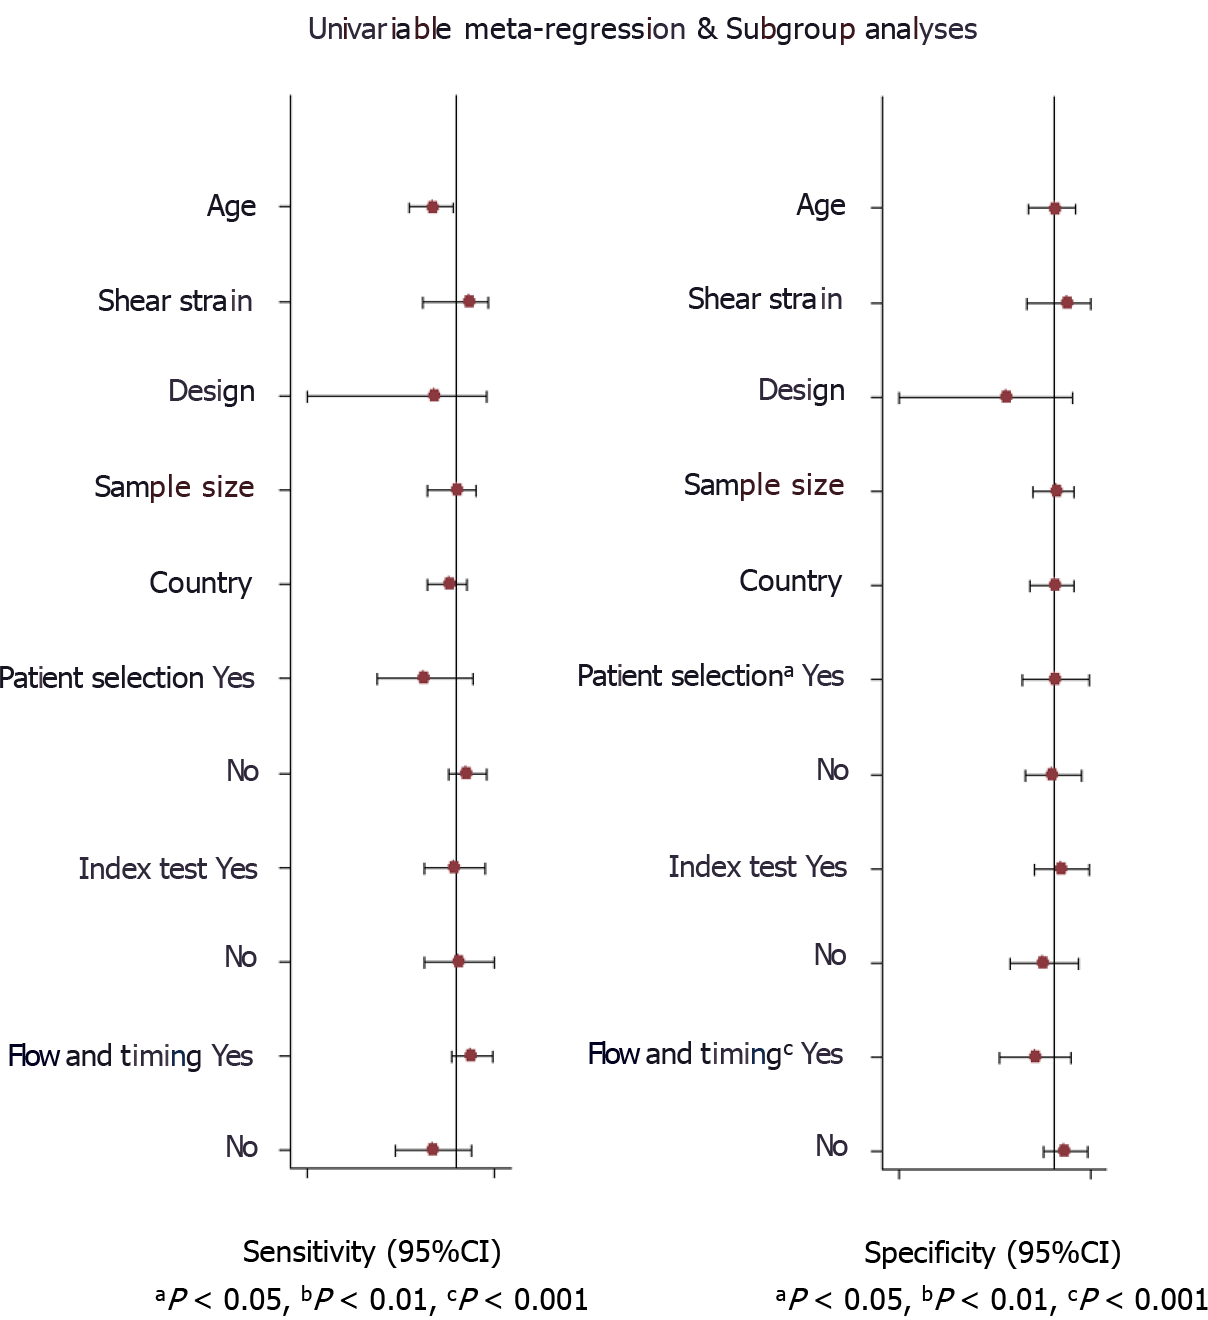
Figure 9 Univariable and multivariable meta-regression results for ultrasound elastography for predicting pathological complete response following neoadjuvant chemotherapy amongst breast cancer patients.
CI: Confidence interval.
- Citation: Chen W, Fang LX, Chen HL, Zheng JH. Accuracy of ultrasound elastography for predicting breast cancer response to neoadjuvant chemotherapy: A systematic review and meta-analysis. World J Clin Cases 2022; 10(11): 3436-3448
- URL: https://www.wjgnet.com/2307-8960/full/v10/i11/3436.htm
- DOI: https://dx.doi.org/10.12998/wjcc.v10.i11.3436


