Copyright
©The Author(s) 2022.
World J Clin Cases. Apr 16, 2022; 10(11): 3426-3435
Published online Apr 16, 2022. doi: 10.12998/wjcc.v10.i11.3426
Published online Apr 16, 2022. doi: 10.12998/wjcc.v10.i11.3426
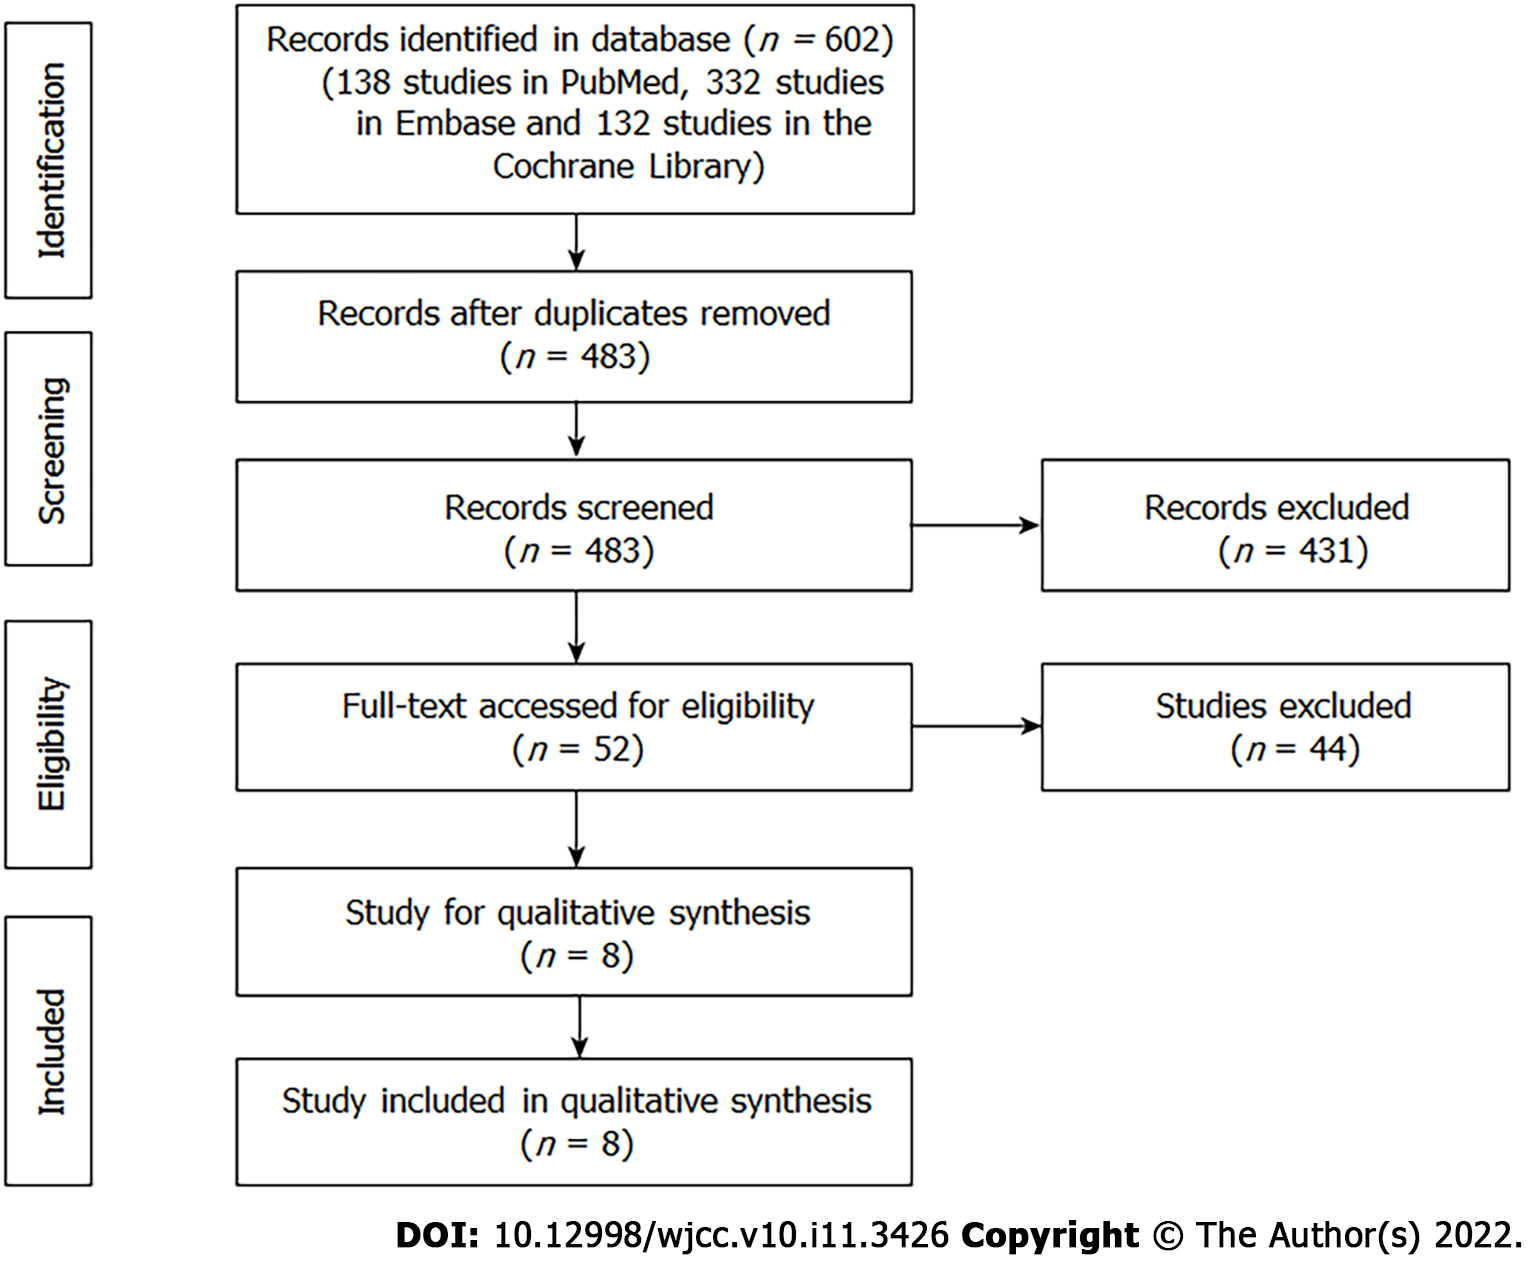
Figure 1 Flowchart of study selection.
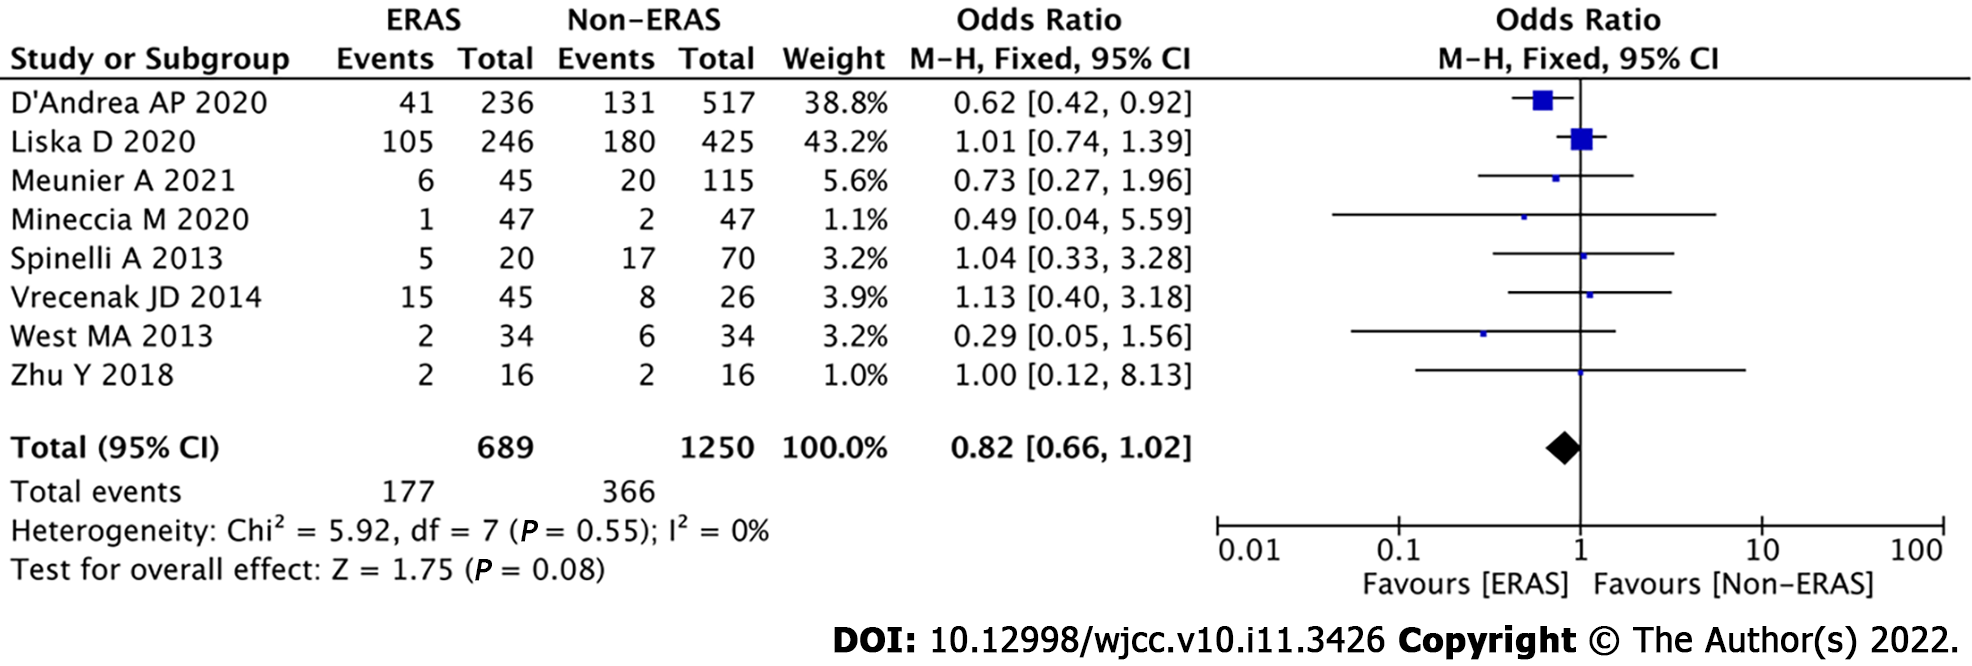
Figure 2 Comparison of postoperative overall complications between the enhanced recovery after surgery group and the non-enhanced recovery after surgery group.
CI: Confidence interval; ERAS: Enhanced recovery after surgery.
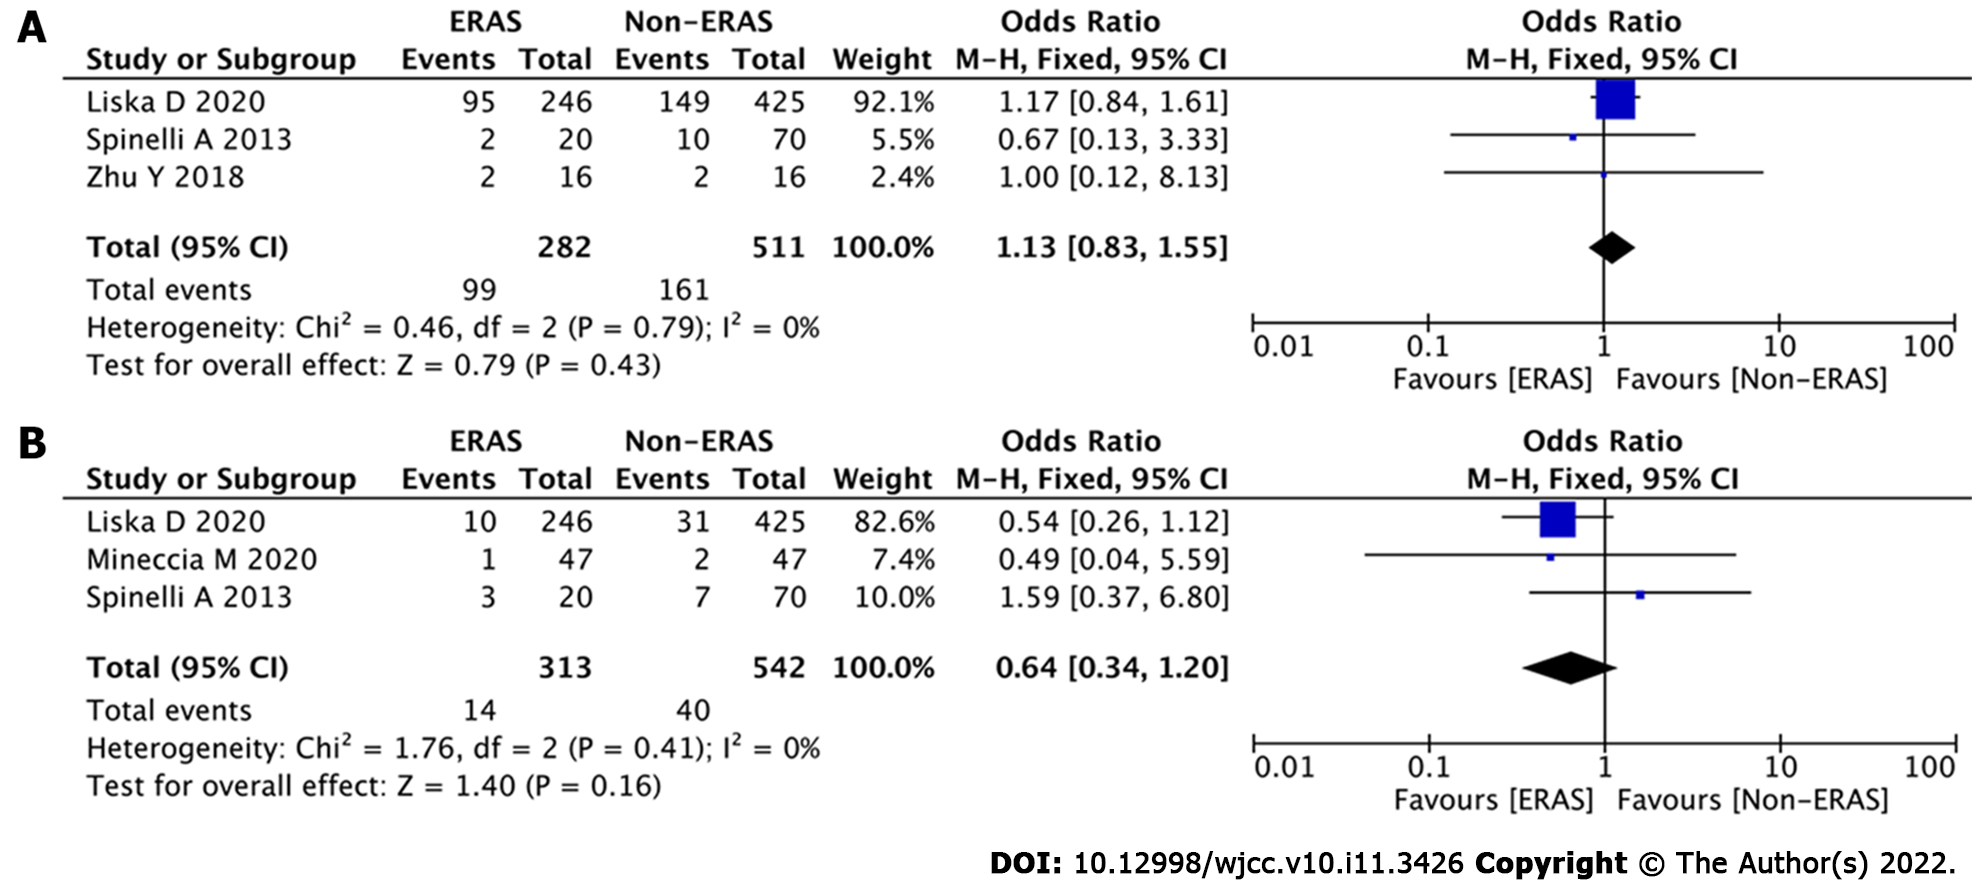
Figure 3 Subgroup analysis of minor and major complications between the enhanced recovery after surgery group and the non-enhanced recovery after surgery group.
A: Minor complications; B: Major complications. CI: Confidence interval; ERAS: Enhanced recovery after surgery.
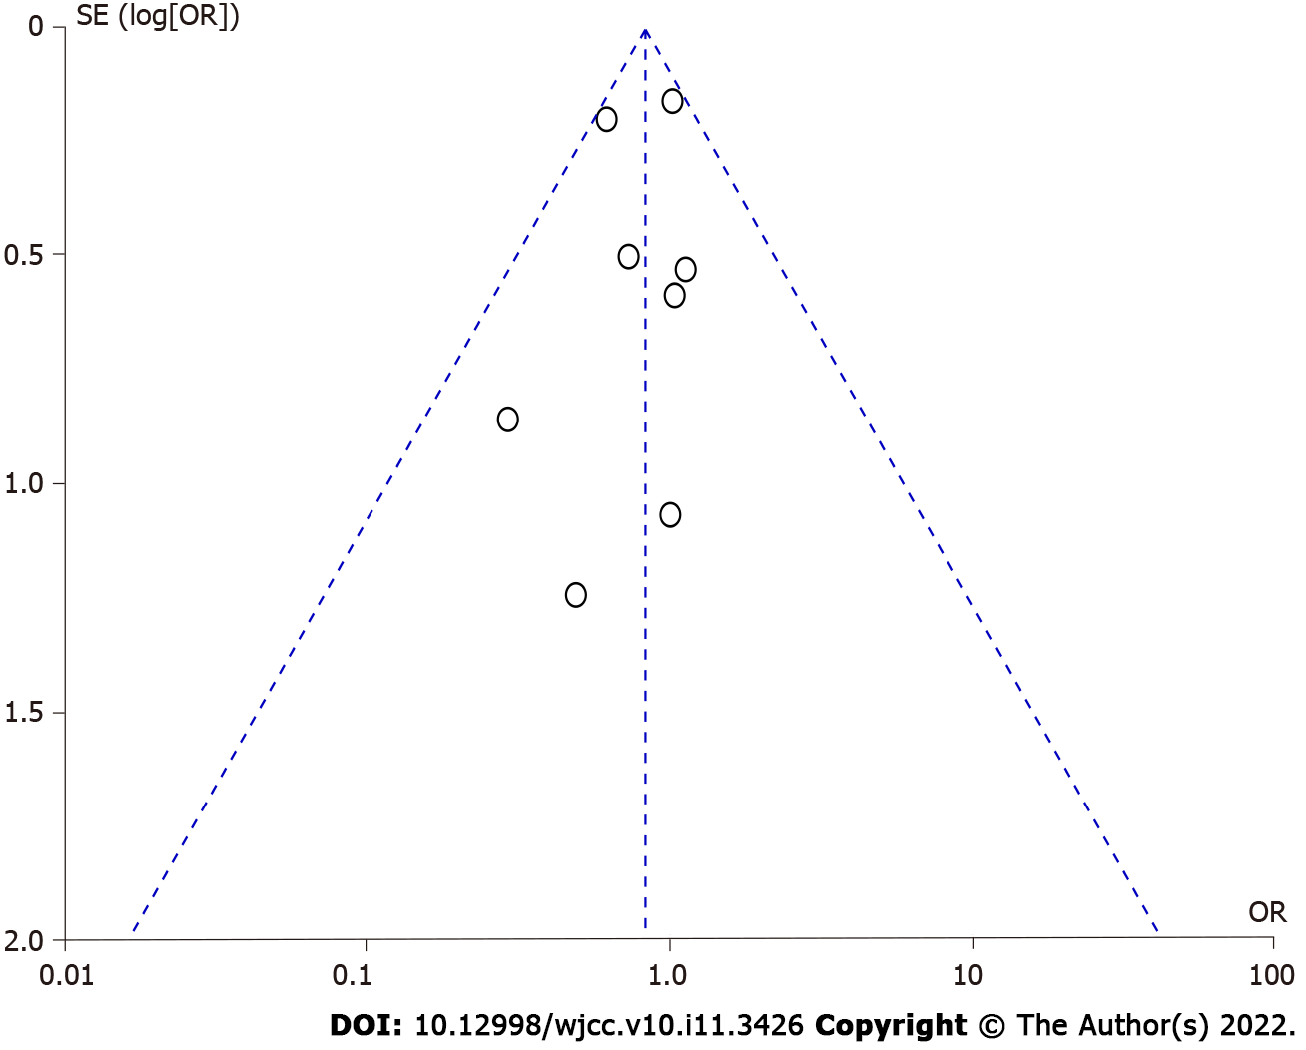
Figure 4 Funnel plot of postoperative complications.
- Citation: Peng D, Cheng YX, Tao W, Tang H, Ji GY. Effect of enhanced recovery after surgery on inflammatory bowel disease surgery: A meta-analysis. World J Clin Cases 2022; 10(11): 3426-3435
- URL: https://www.wjgnet.com/2307-8960/full/v10/i11/3426.htm
- DOI: https://dx.doi.org/10.12998/wjcc.v10.i11.3426


