Copyright
©The Author(s) 2022.
World J Clin Cases. Apr 16, 2022; 10(11): 3389-3400
Published online Apr 16, 2022. doi: 10.12998/wjcc.v10.i11.3389
Published online Apr 16, 2022. doi: 10.12998/wjcc.v10.i11.3389
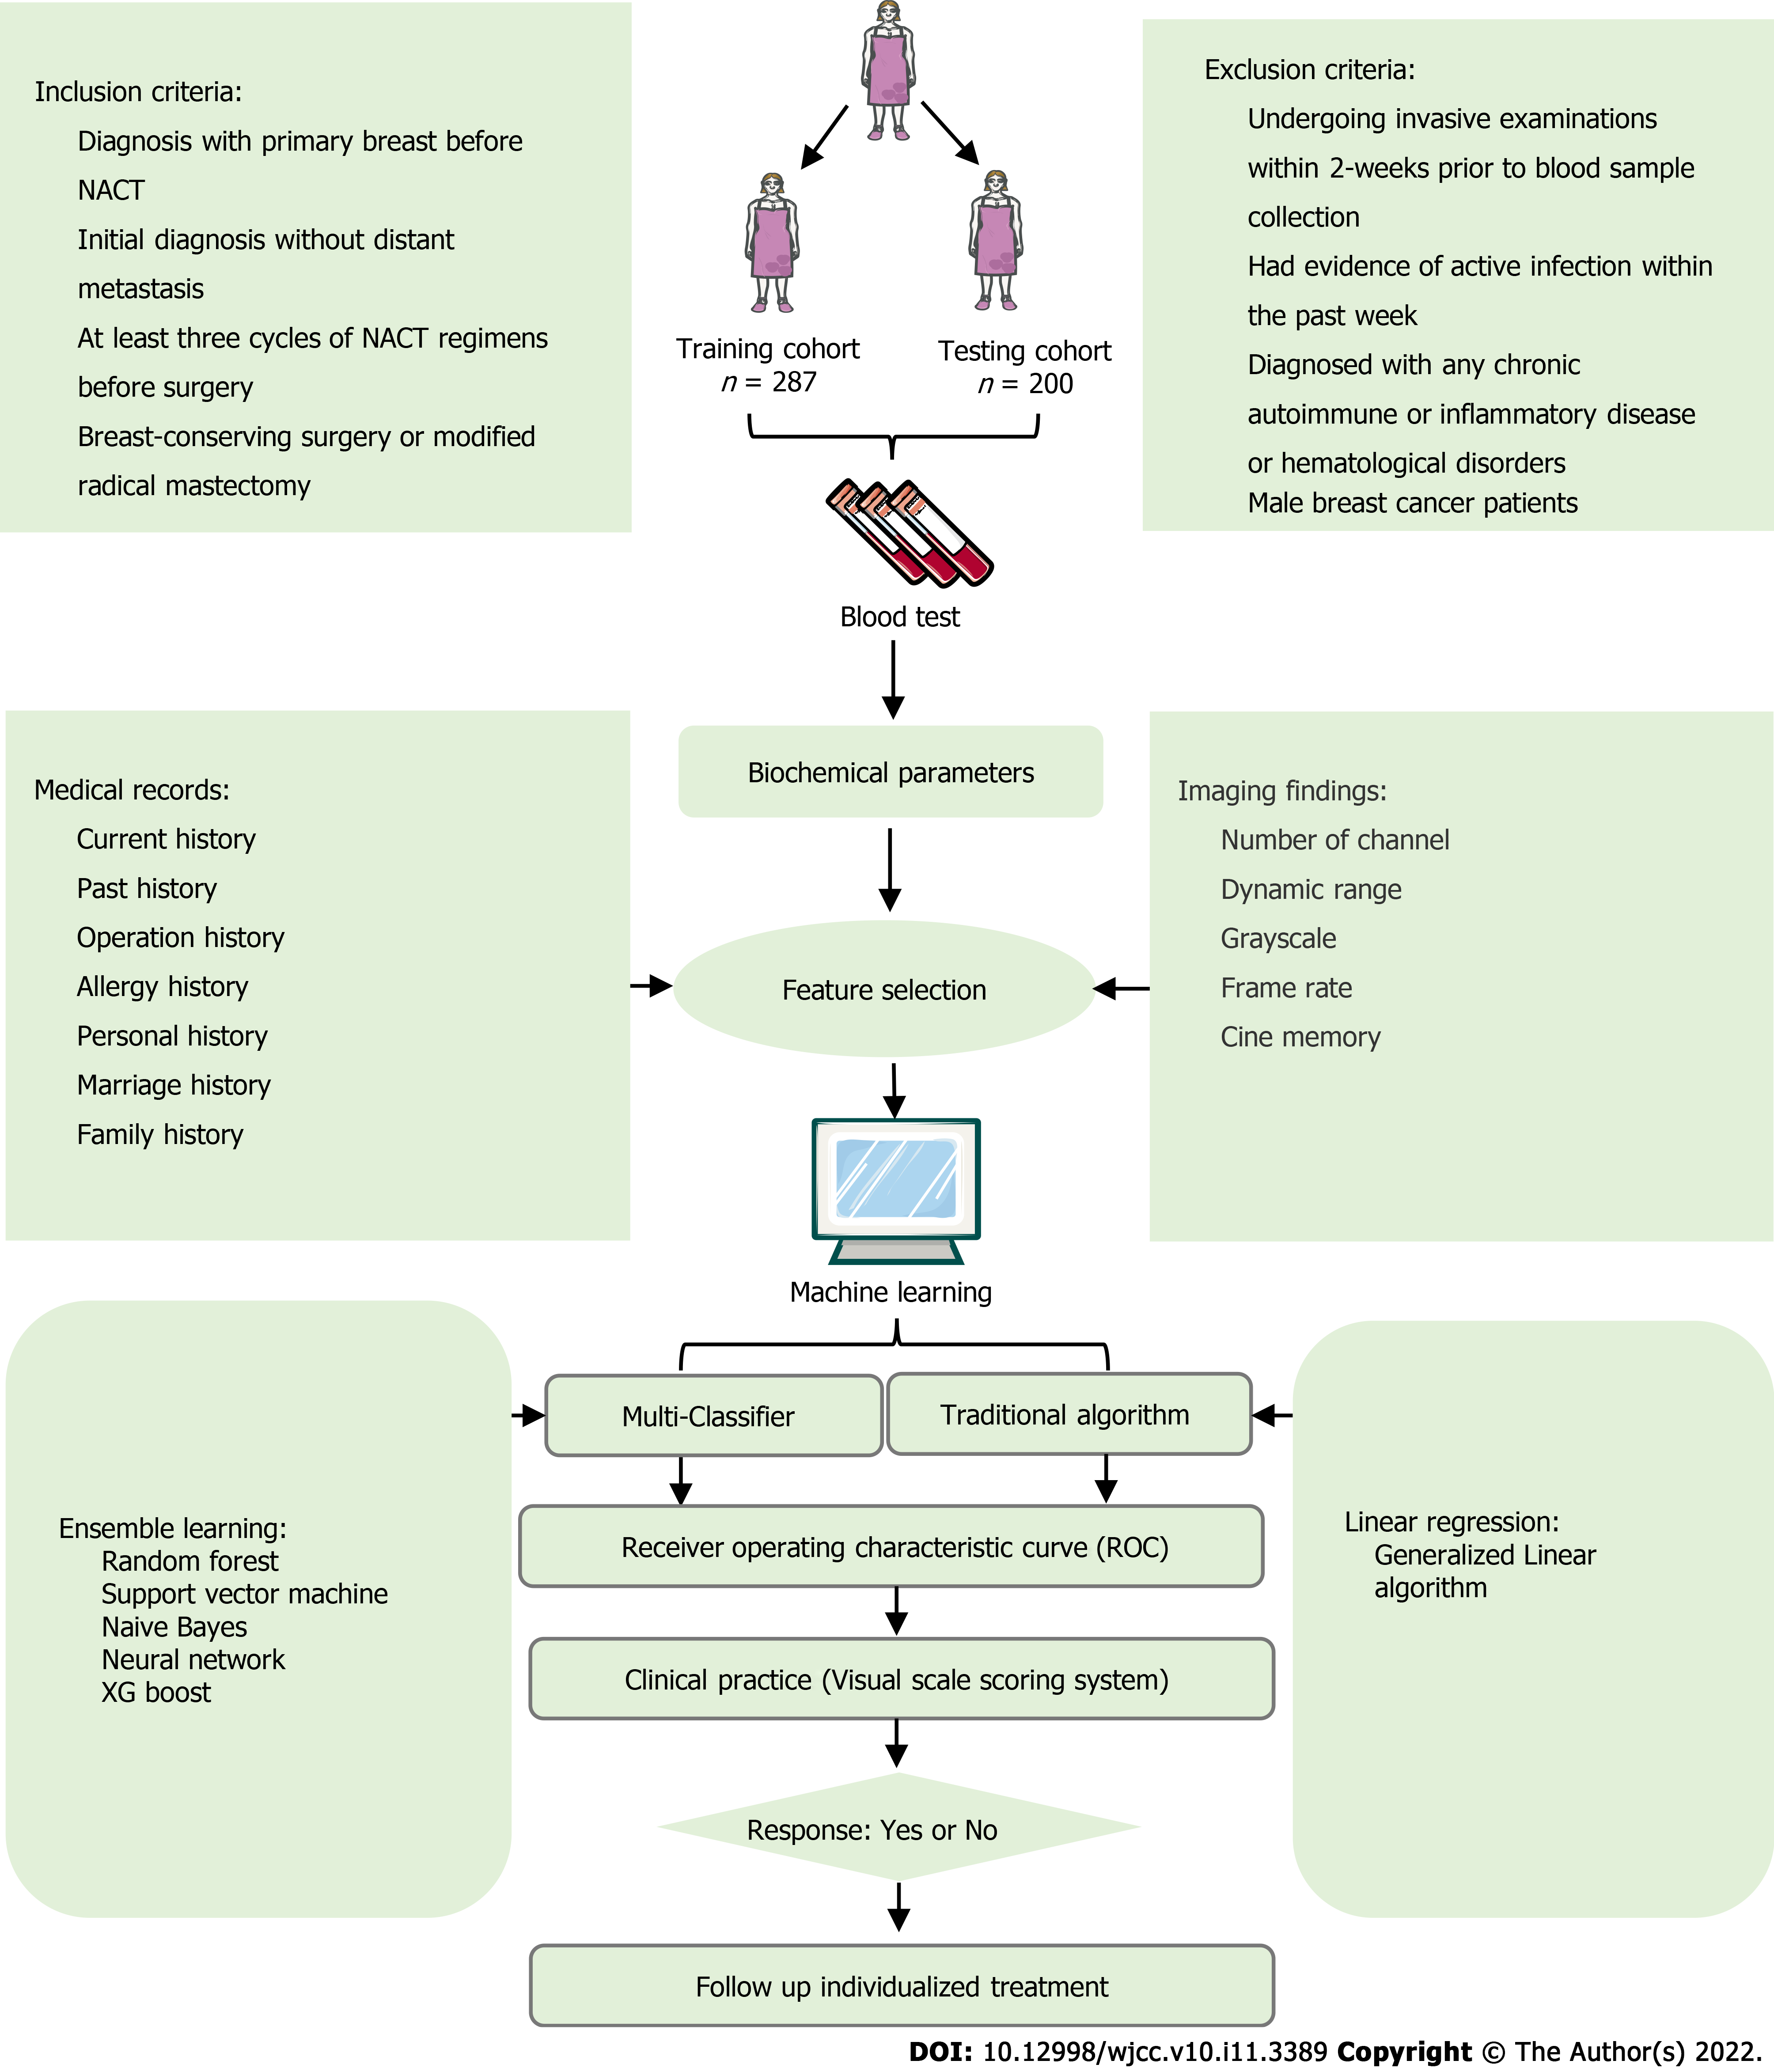
Figure 1 The flow chart of patient selection and data process.
NACT: Neoadjuvant chemotherapy; ROC: Receiver operating characteristic.
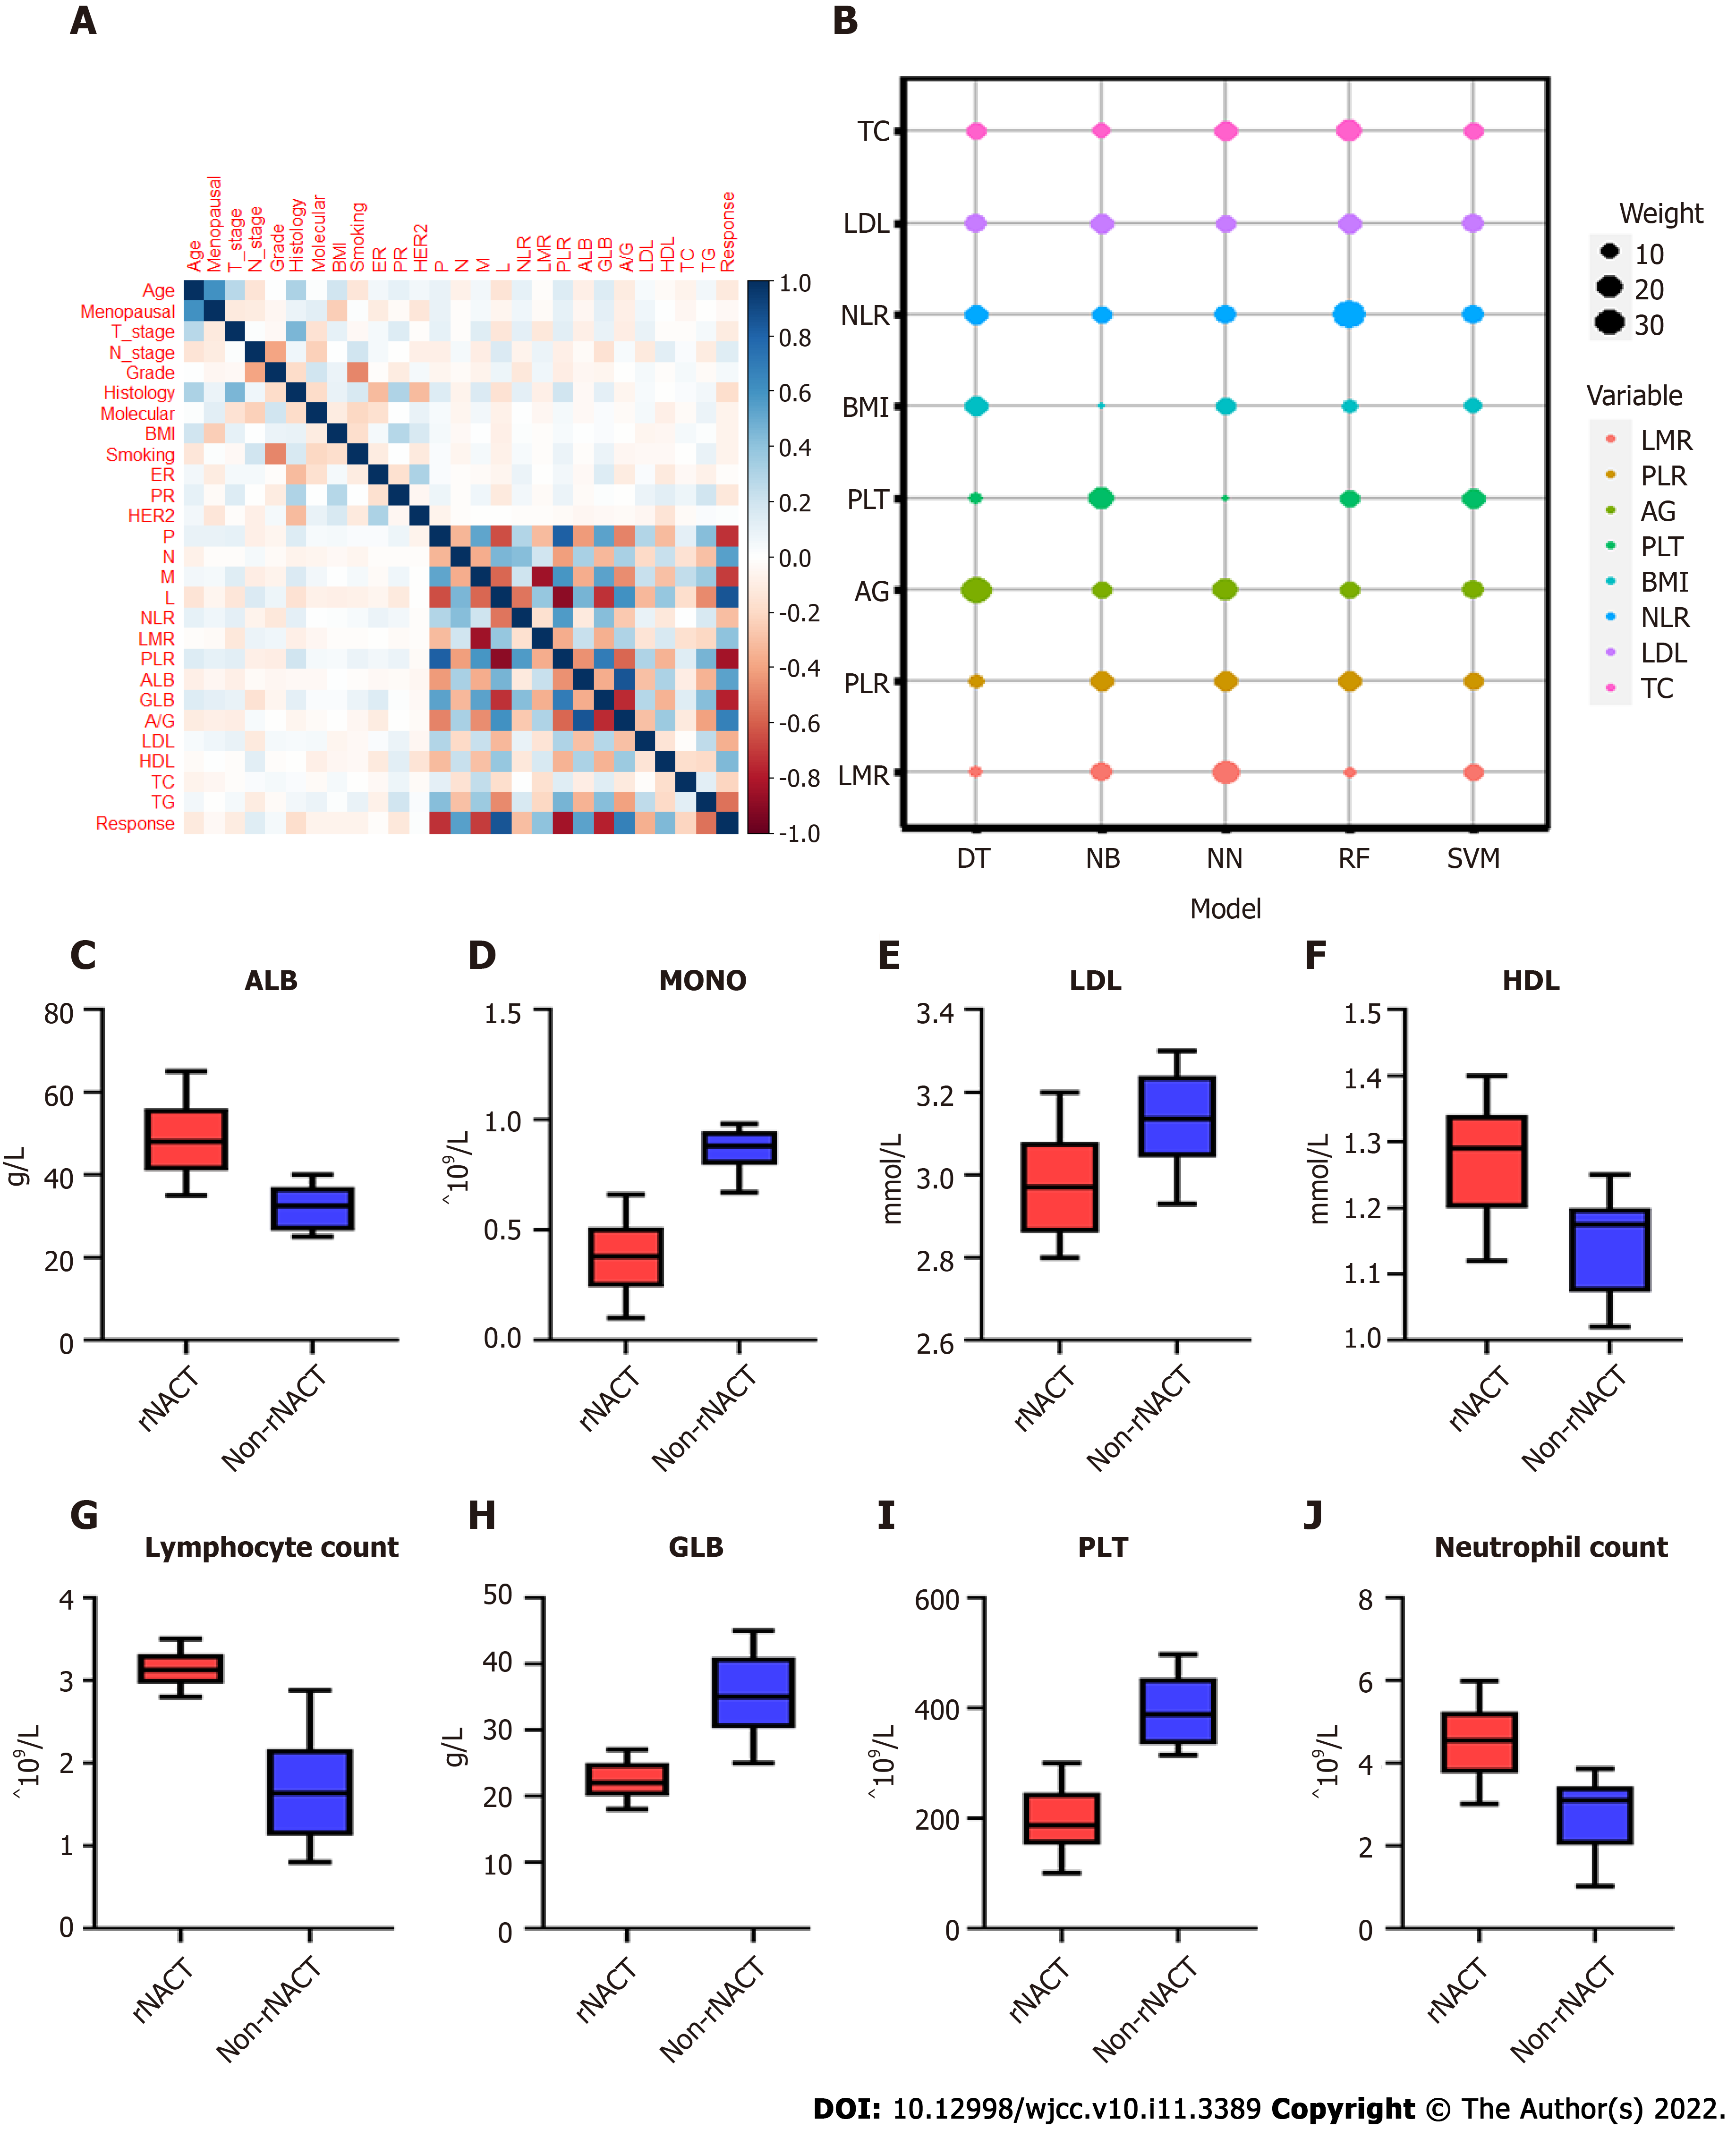
Figure 2 Statistical analysis of features included in machine learning based models.
A: Heatmap representing the correlation between candidate variables included in predictive models using Spearman’s correlation coefficient; B: Scaled importance rank of all features included in predictive models for identifying risk of response after neoadjuvant chemotherapy (rNACT) in breast cancer patients; C-J: Box and jitter plots showing distribution of continuous features included in predictive models between rNACT and non-rNACT groups. BMI: Body mass index; PR: Partial response; NLR: Neutrophil-to-lymphocyte ratio; LMR: Lymphocyte-to-monocyte ratio; PLR: Platelet-to-lymphocyte ratio; A/G: Albumin-to-globulin ratio; LDL: Low-density lipoprotein; HDL: High-density lipoprotein; TC: Total cholesterol; TG: Triglyceride.
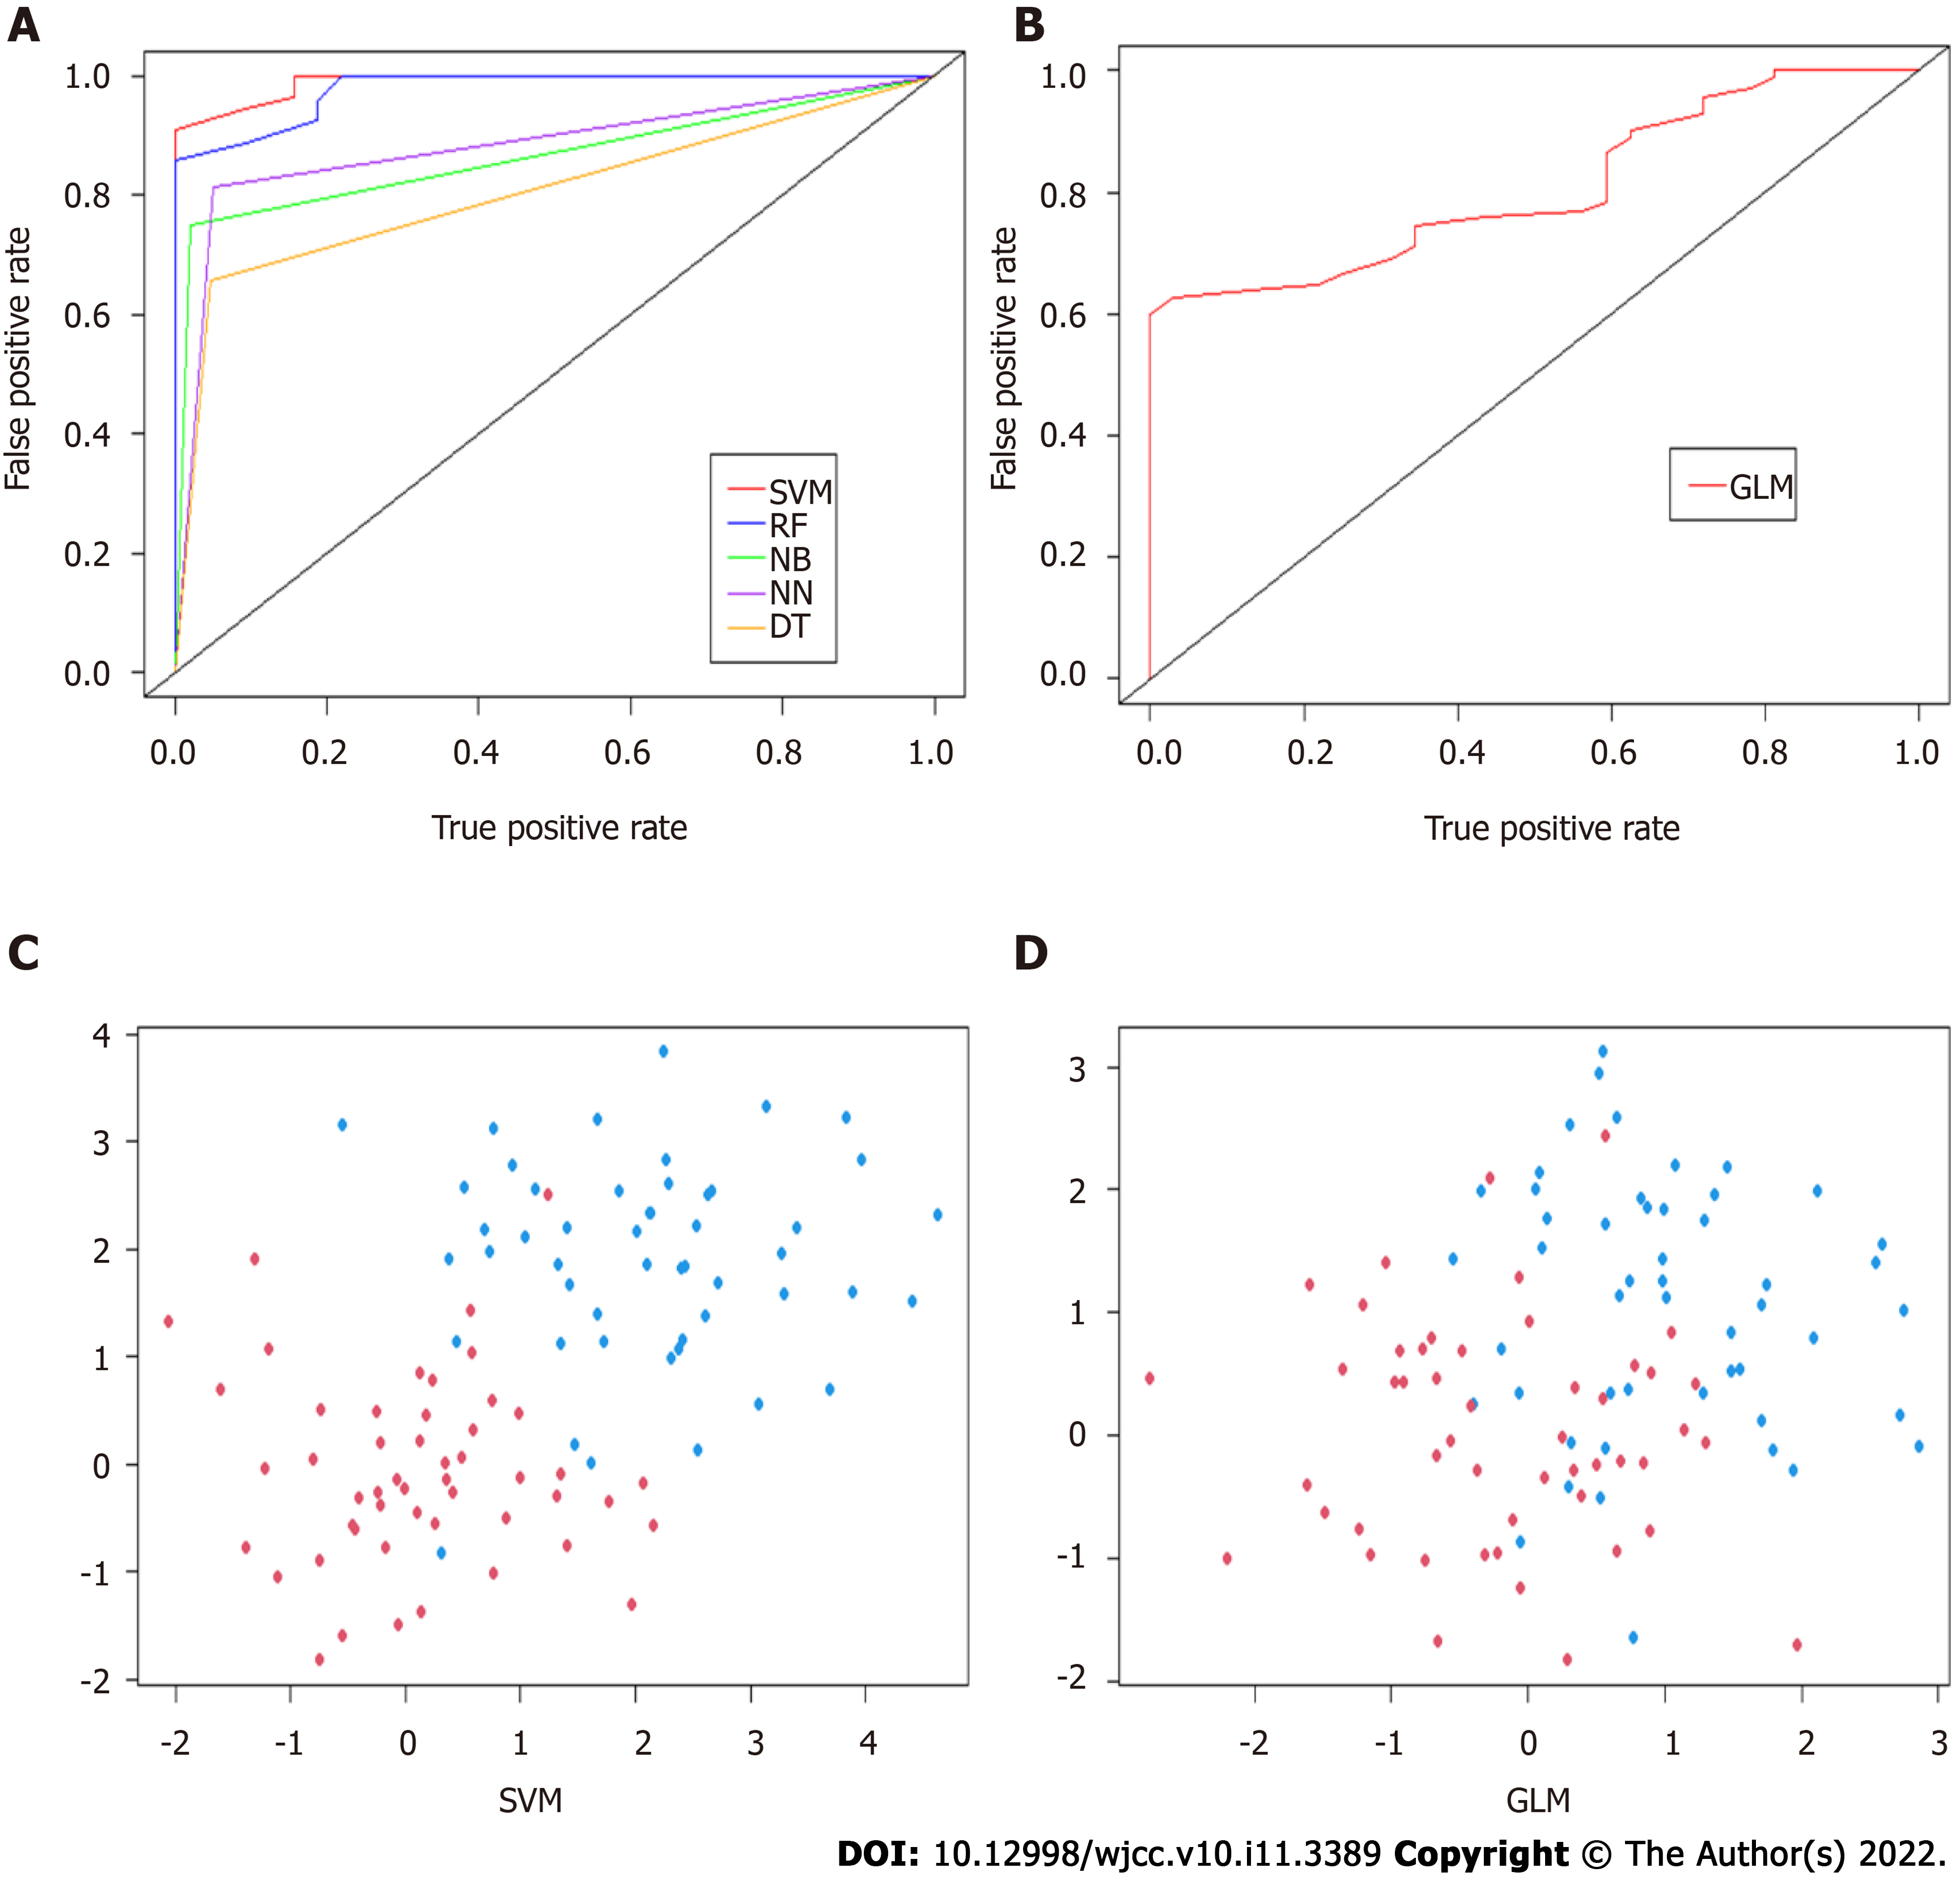
Figure 3 Validation and comparison of the predictive model.
A: Area under the receiver operating characteristic curve (AUC) to assess the performance of response after neoadjuvant chemotherapy (rNACT) risk prediction of machine learning based models; B: AUC to assess the performance of rNACT risk prediction of generalized linear model (GLM); C: Discriminative evaluation of support vector machine in predicting rNACT; D: Discriminative evaluation of GLM in predicting rNACT. SVM: Support vector machine; GLM: Generalized linear model.
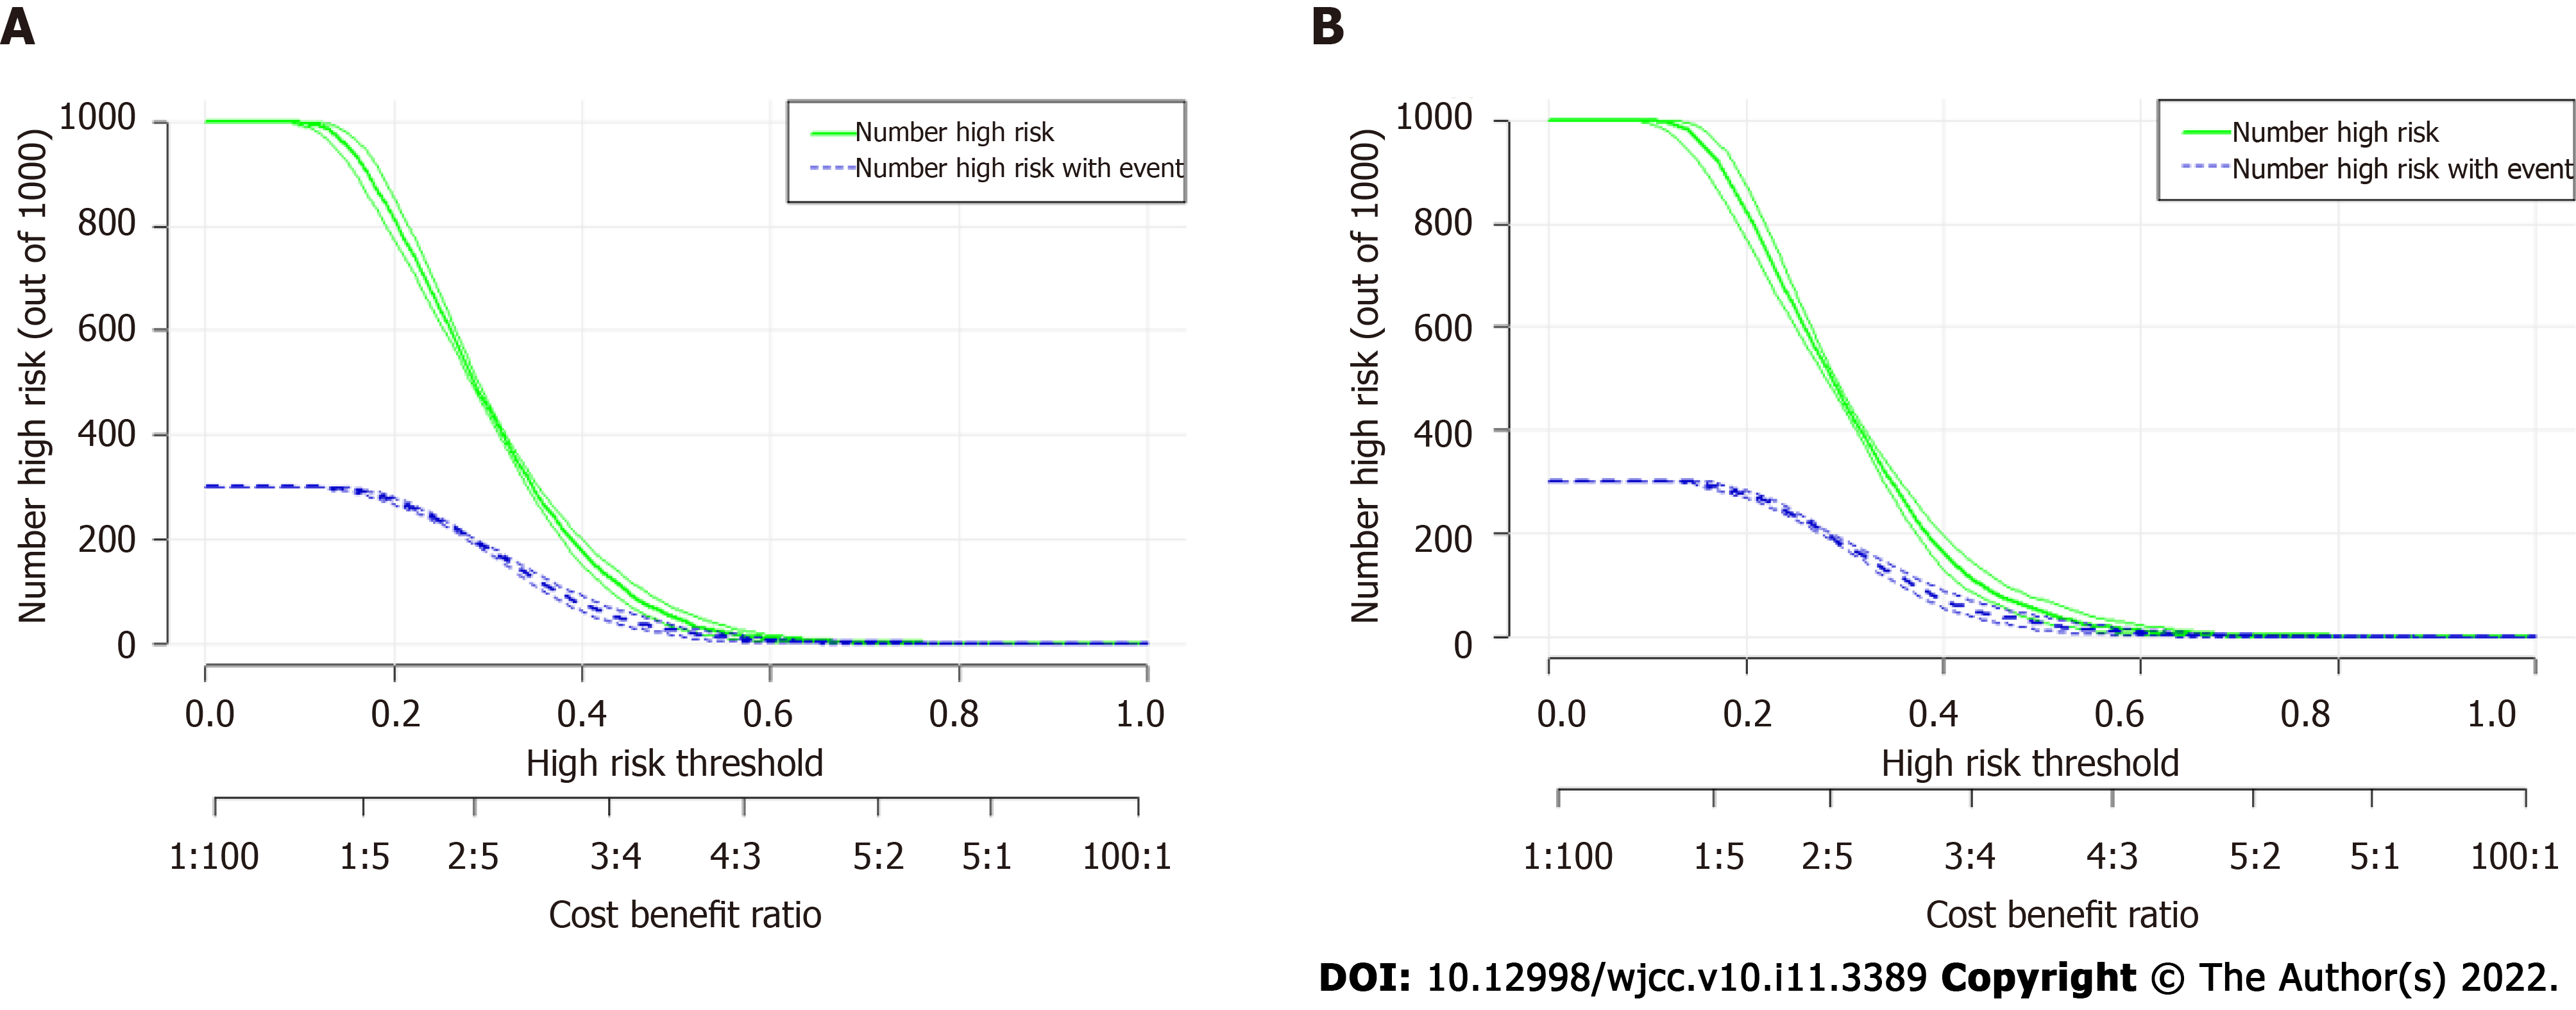
Figure 4 Prediction performance of support vector machine model via clinical impact curve.
A: Training set; B: Validation set. The green line predicts the probability of poor response after neoadjuvant chemotherapy (rNACT), and the blue line shows how many patients will be at high risk of non-rNACT.
- Citation: Ke ZR, Chen W, Li MX, Wu S, Jin LT, Wang TJ. Added value of systemic inflammation markers for monitoring response to neoadjuvant chemotherapy in breast cancer patients. World J Clin Cases 2022; 10(11): 3389-3400
- URL: https://www.wjgnet.com/2307-8960/full/v10/i11/3389.htm
- DOI: https://dx.doi.org/10.12998/wjcc.v10.i11.3389


