Copyright
©The Author(s) 2024.
World J Exp Med. Mar 20, 2024; 14(1): 91271
Published online Mar 20, 2024. doi: 10.5493/wjem.v14.i1.91271
Published online Mar 20, 2024. doi: 10.5493/wjem.v14.i1.91271
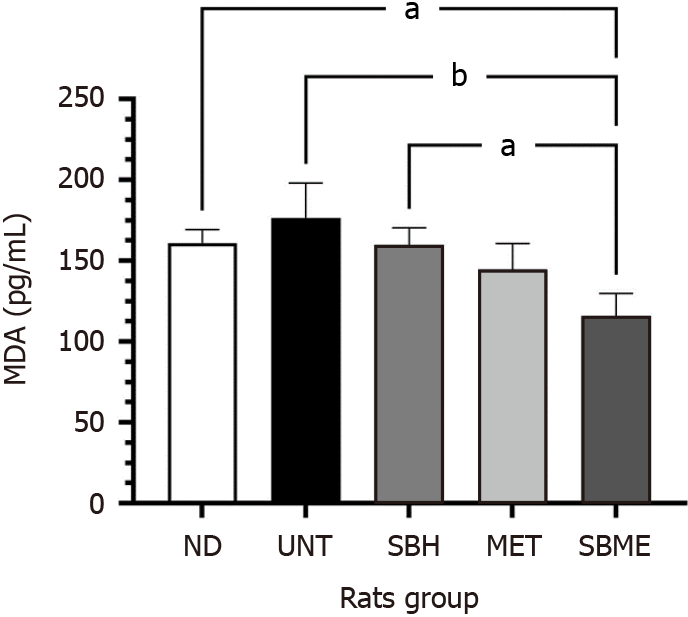
Figure 1 MDA level in diabetic rats in response to different treatments over 12 d.
Data were analyzed using one-way analysis of variance, followed by Tukey’s post-test. Data showed in mean ± SEM; a,bP < 0.05. ND: Non-diabetic group; UNT: Untreated diabetic group; SBH: Stingless bee honey group; MET: Metformin group; SBME: Stingless bee honey plus metformin group.
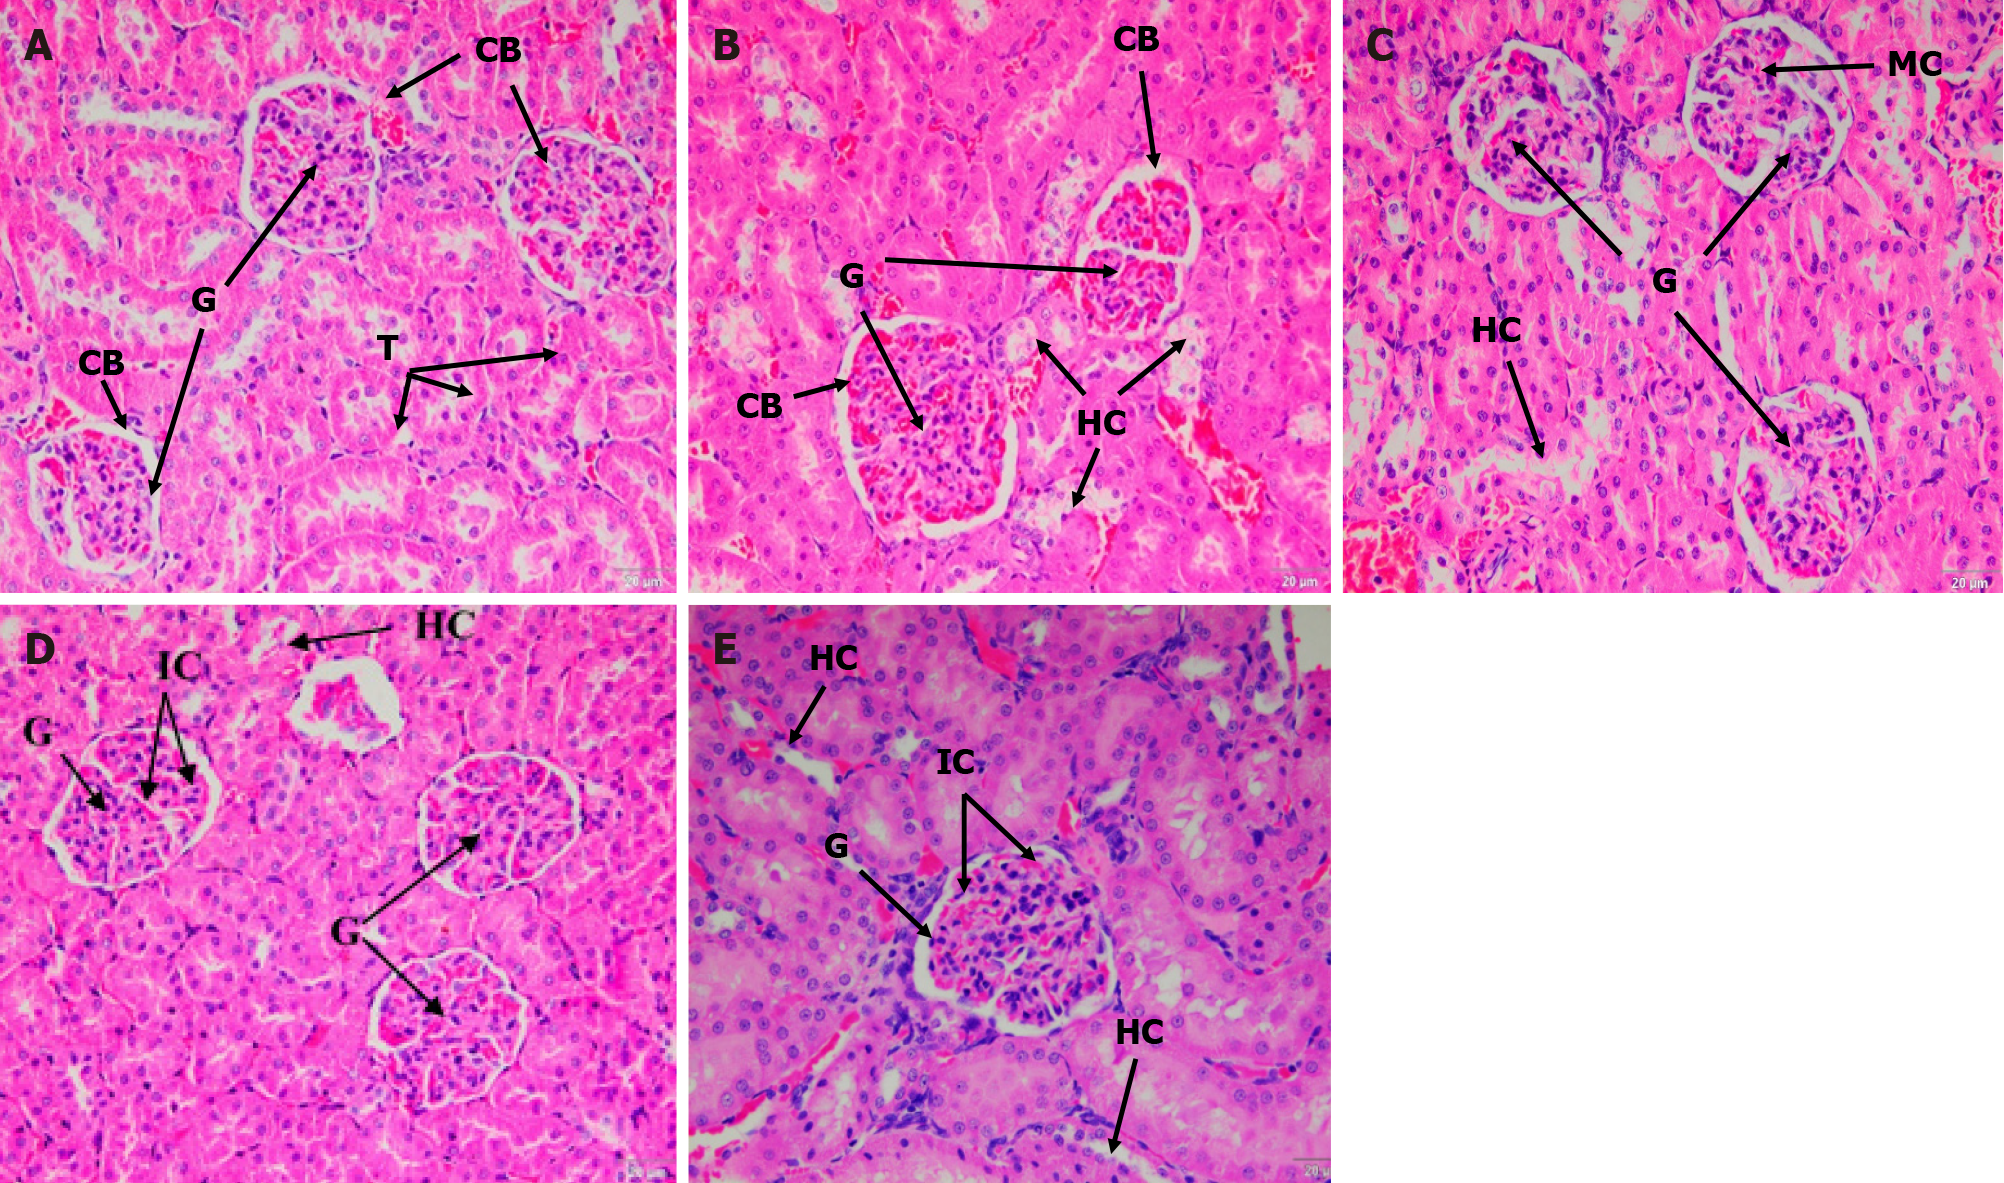
Figure 2 H&E staining of kidney tissue samples on day 13.
A: Tissue sample for the non-diabetic control group; B: Untreated (UNT) diabetic group; C: Stingless bee honey (SBH) treatment group; D: Metformin (MET) treatment group; E: Stingless bee honey plus metformin (SBME) treatment group. The UNT group showed an increase in glomerular cellularity and tubular hydropic changes. The MET and SBME groups showed high cellularity and mesangial matrix expansion. The SBH group showed a decrease in hydropic changes and mild cellularity of the glomerulus (H&E staining, 40 ×). G: Glomerulus; CB: Capsule Bowman; T: Tubules; HC: Hydropic changes; IC: Increased cellularity; C: Capillary; M: Mesangial cell; MC: Mild cellularity.
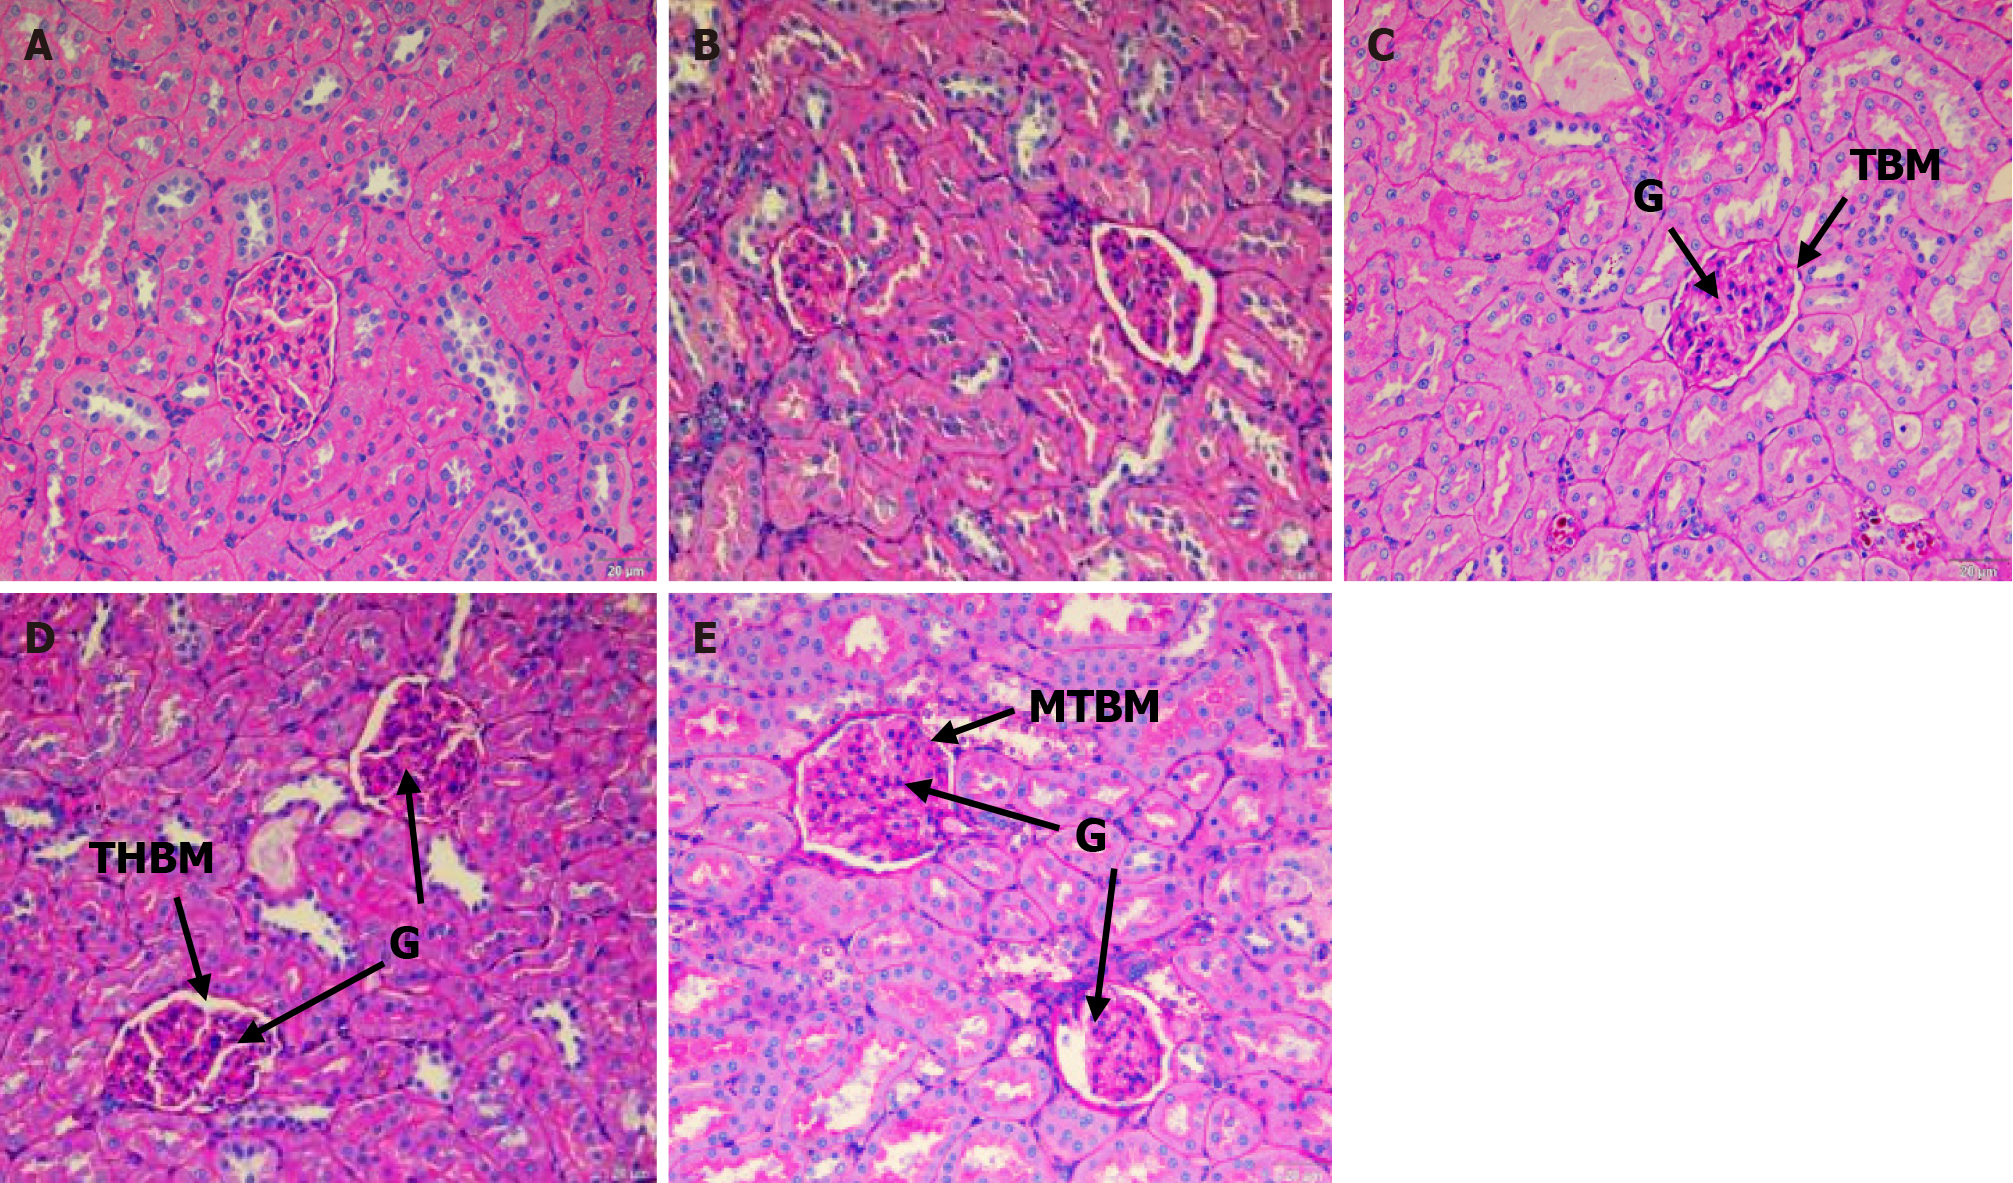
Figure 3 Periodic acid–Schiff staining of kidney tissue sample on day 13.
A: Tissue sample for the non-diabetic (ND) control group; B: Untreated (UNT) diabetic group; C: Stingless bee honey plus metformin (SBME) treatment group; D: Stingless bee honey (SBH) treatment group; E: Metformin (MET) treatment group. The ND control group showed normal kidney tissue architecture. The UNT group had hydropic tubules and thickened basement membrane of the glomeruli, tubules, and blood capillaries. The SBH group showed improvement in these basement membrane changes. The MET group showed mild thickening of the glomerular basement membrane. The SBME group showed improvement of the basement membrane (PAS staining, 40 ×). G: Glomerulus; TBM: Thin layer basement membrane of glomeruli; T: Tubules; THBM: Thickening basement membrane of glomeruli; TT: Thickening basement membrane of tubules; AT: Atrophic tubules; MTBM: Mild thickening basement membrane of glomeruli.
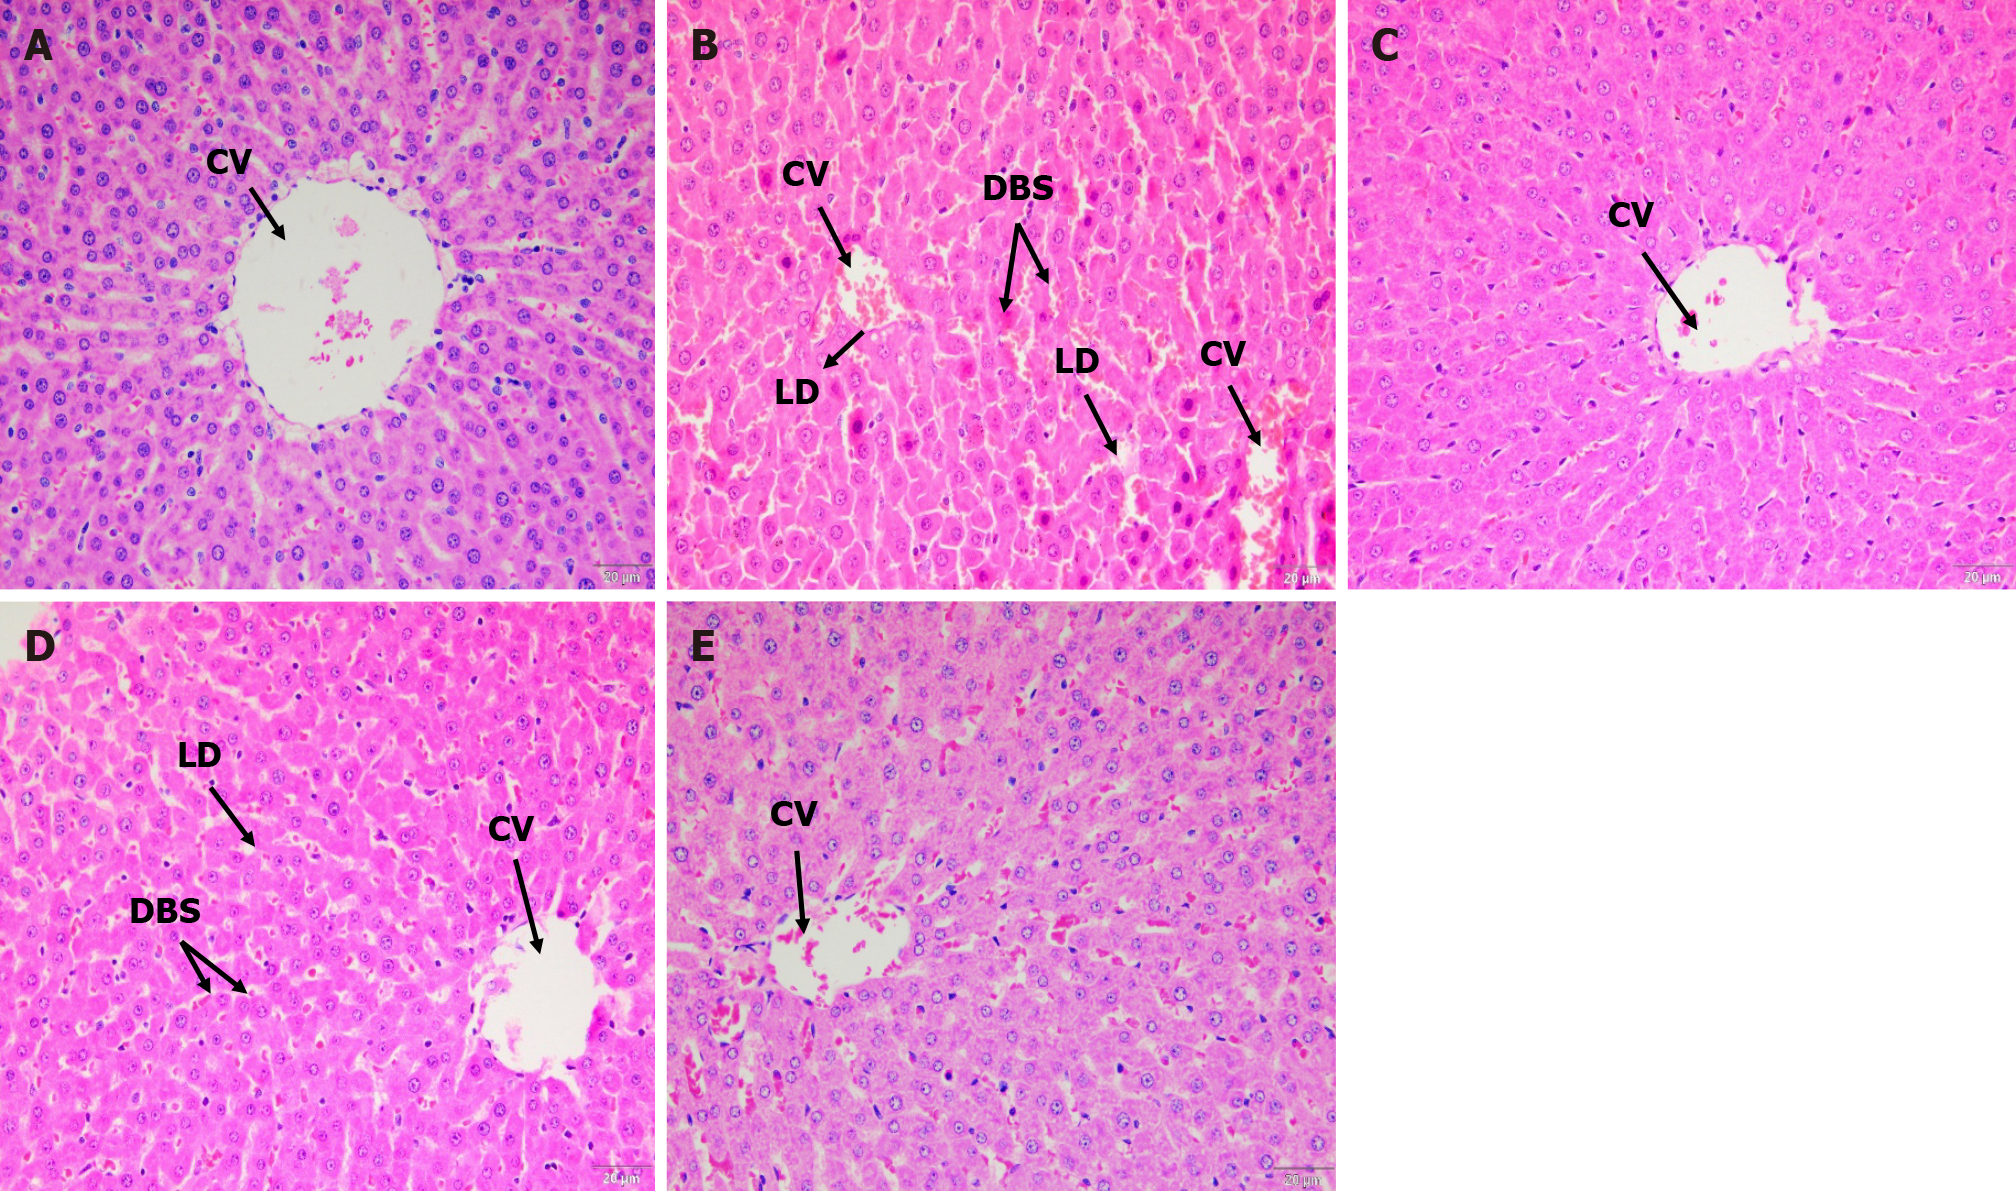
Figure 4 H&E staining of liver tissue sample on day 13.
A: Tissue sample for the non-diabetic (ND) control group; B: Untreated (UNT) diabetic group; C: Stingless bee honey (SBH) treatment group; D: Metformin (MET) treatment group; E: Stingless bee honey plus metformin (SBME) treatment group. The ND control group showed normal liver architecture. The UNT group had lipid droplet formation in hepatocytes with dilated blood sinusoids and congestion surrounding central veins. The SBH group showed significant reduction in steatosis and sinusoid congestion. The MET group showed a reduction in steatosis, but sinusoids congestion was still present. The SBME group had decreased lipid droplet formation and dilated blood sinusoids (H&E staining, 40 ×). CV: Central vein; BS: Blood sinusoids; H: Hepatocytes; LD: Lipid droplet; DBS: Dilated blood sinusoids.
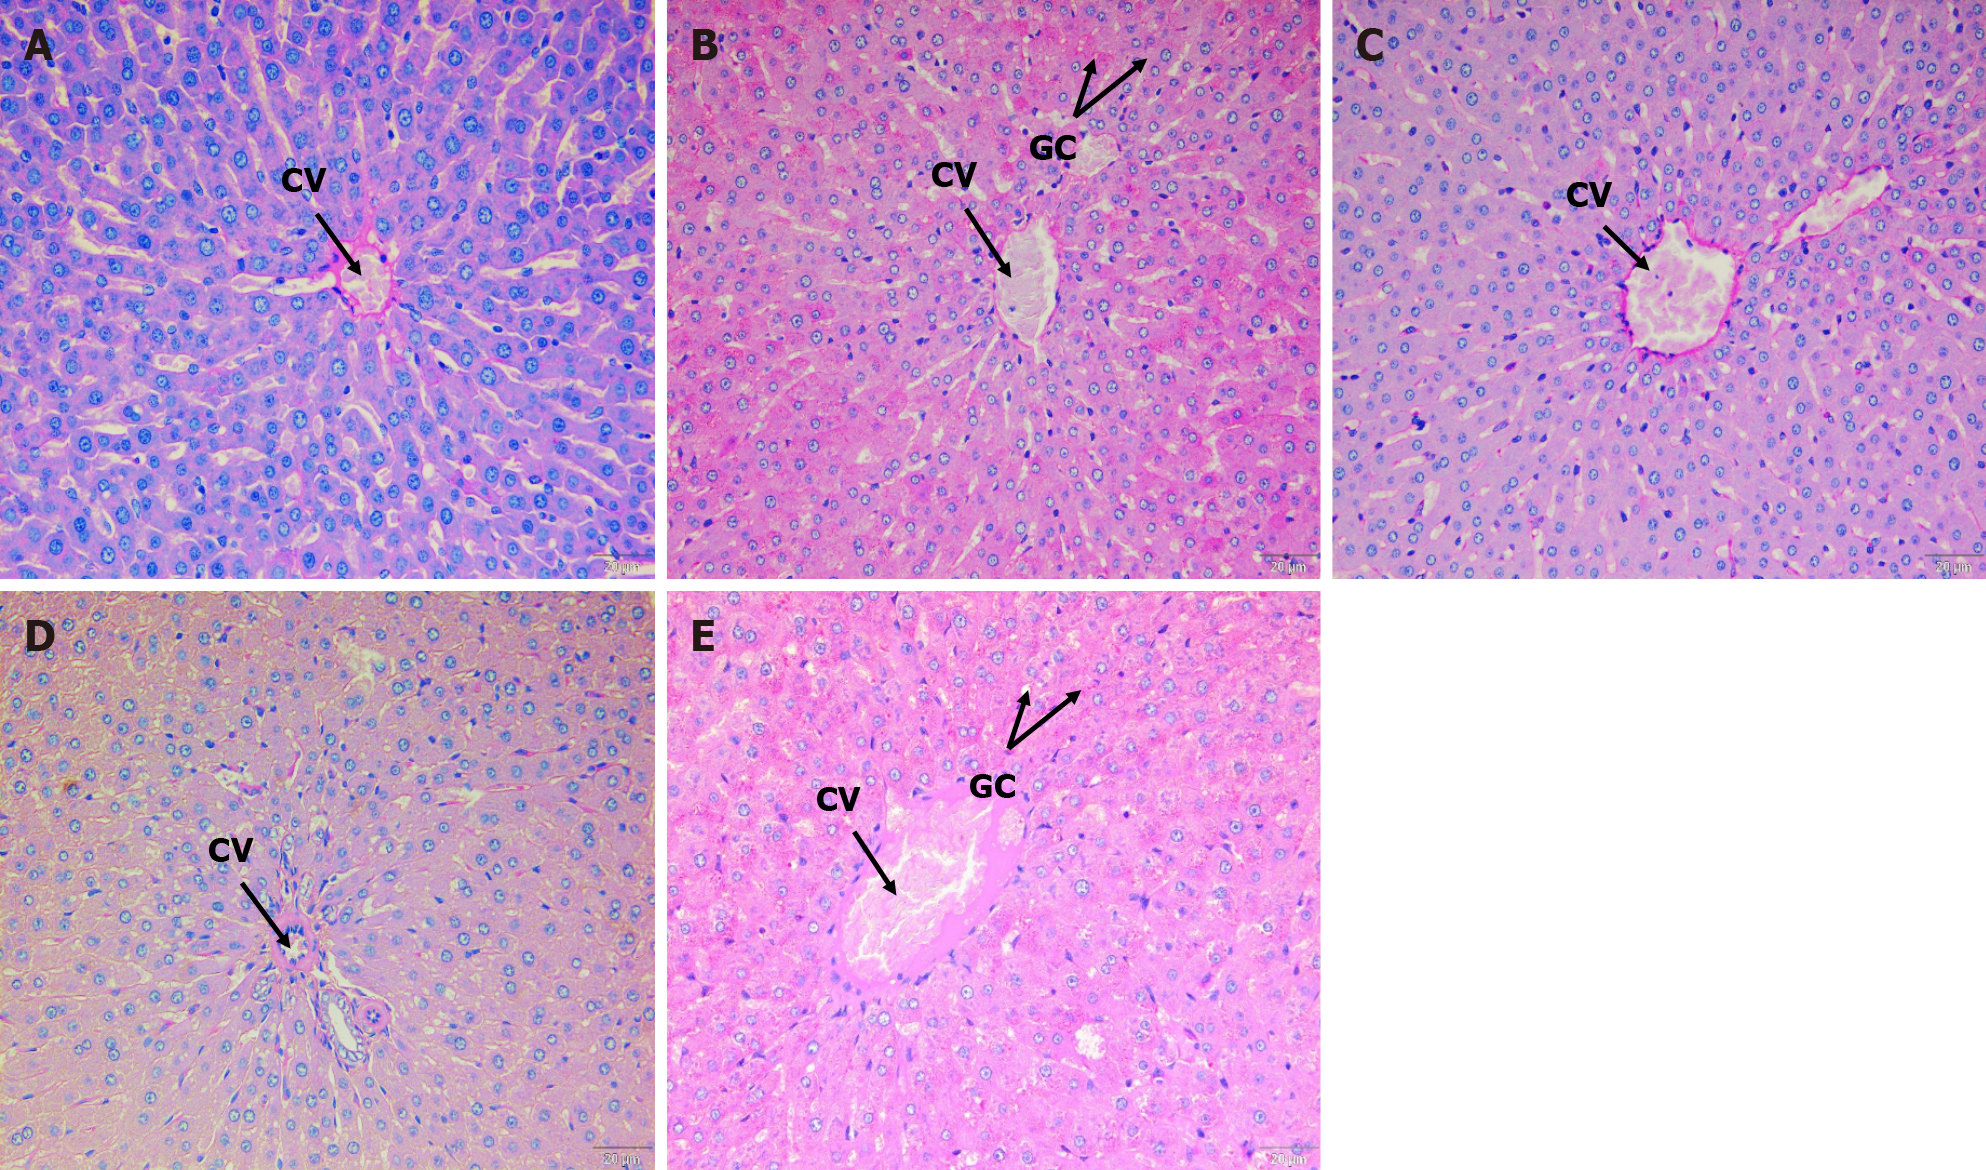
Figure 5 Periodic acid–Schiff staining of liver tissue sample on the 13th day of study.
A: Tissue sample for the non-diabetic (ND) control group; B: Untreated diabetic (UNT) group; C: Stingless bee honey (SBH) treatment group; D: Stingless bee honey plus metformin (SBME) treatment group; E: Metformin treatment (MET) group. The ND control group showed normal architecture. The UNT group showed an increase in glycogen content. The SBH diabetic group showed a reduction in glycogen content. The MET group showed an increase in glycogen content. The SBME group showed a reduction in glycogen content (PAS staining, 40 ×). CV: Central vein; GC: Glycogen content showed an increase in glycogen content.
- Citation: Mohd Nasir S, Ismail AF, Tuan Ismail TS, Wan Abdul Rahman WF, Wan Ahmad WAN, Tengku Din TADAA, Sirajudeen KNS. Hepatic and renal effects of oral stingless bee honey in a streptozotocin-induced diabetic rat model. World J Exp Med 2024; 14(1): 91271
- URL: https://www.wjgnet.com/2220-315x/full/v14/i1/91271.htm
- DOI: https://dx.doi.org/10.5493/wjem.v14.i1.91271


