Copyright
©The Author(s) 2023.
World J Gastrointest Surg. Dec 27, 2023; 15(12): 2757-2764
Published online Dec 27, 2023. doi: 10.4240/wjgs.v15.i12.2757
Published online Dec 27, 2023. doi: 10.4240/wjgs.v15.i12.2757
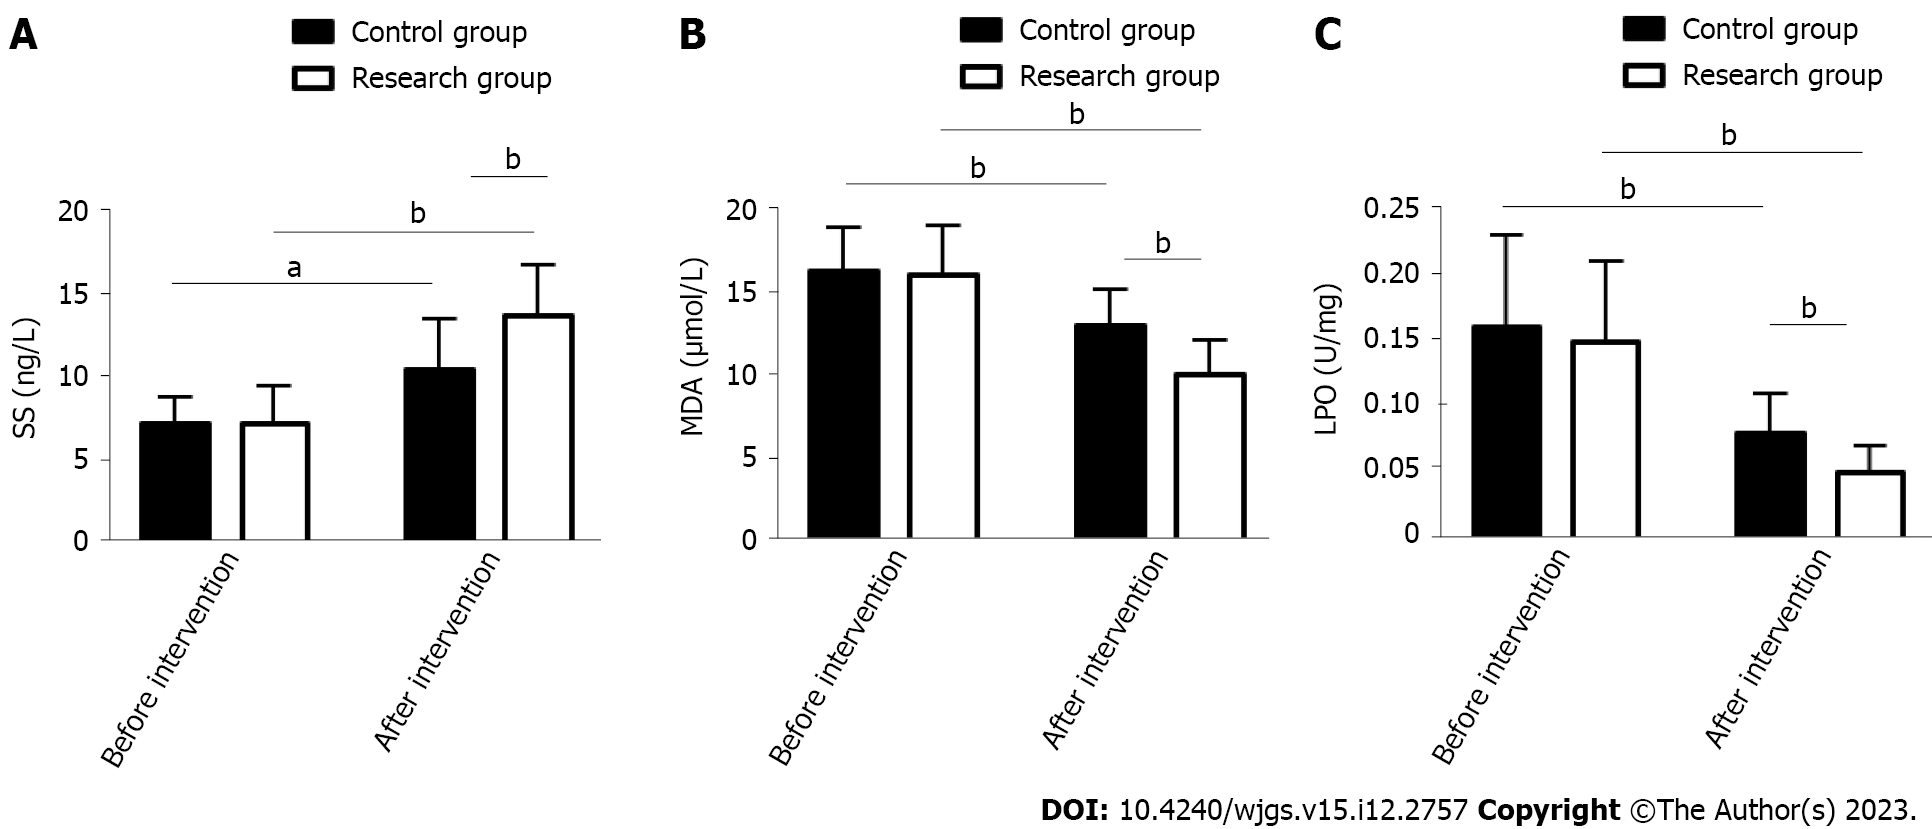
Figure 1 Somatostatin, malondialdehyde and lipid peroxide of patients with peptic ulcer in the two groups.
A: Pre- and posttreatment somatostatin levels in the two groups; b: Pre- and posttreatment malondialdehyde levels in the two groups; C: Pre- and posttreatment lipid peroxide levels in the two groups. aP < 0.05, bP < 0.01. SS: Somatostatin; MDA: Malondialdehyde; LPO: Lipid peroxide.
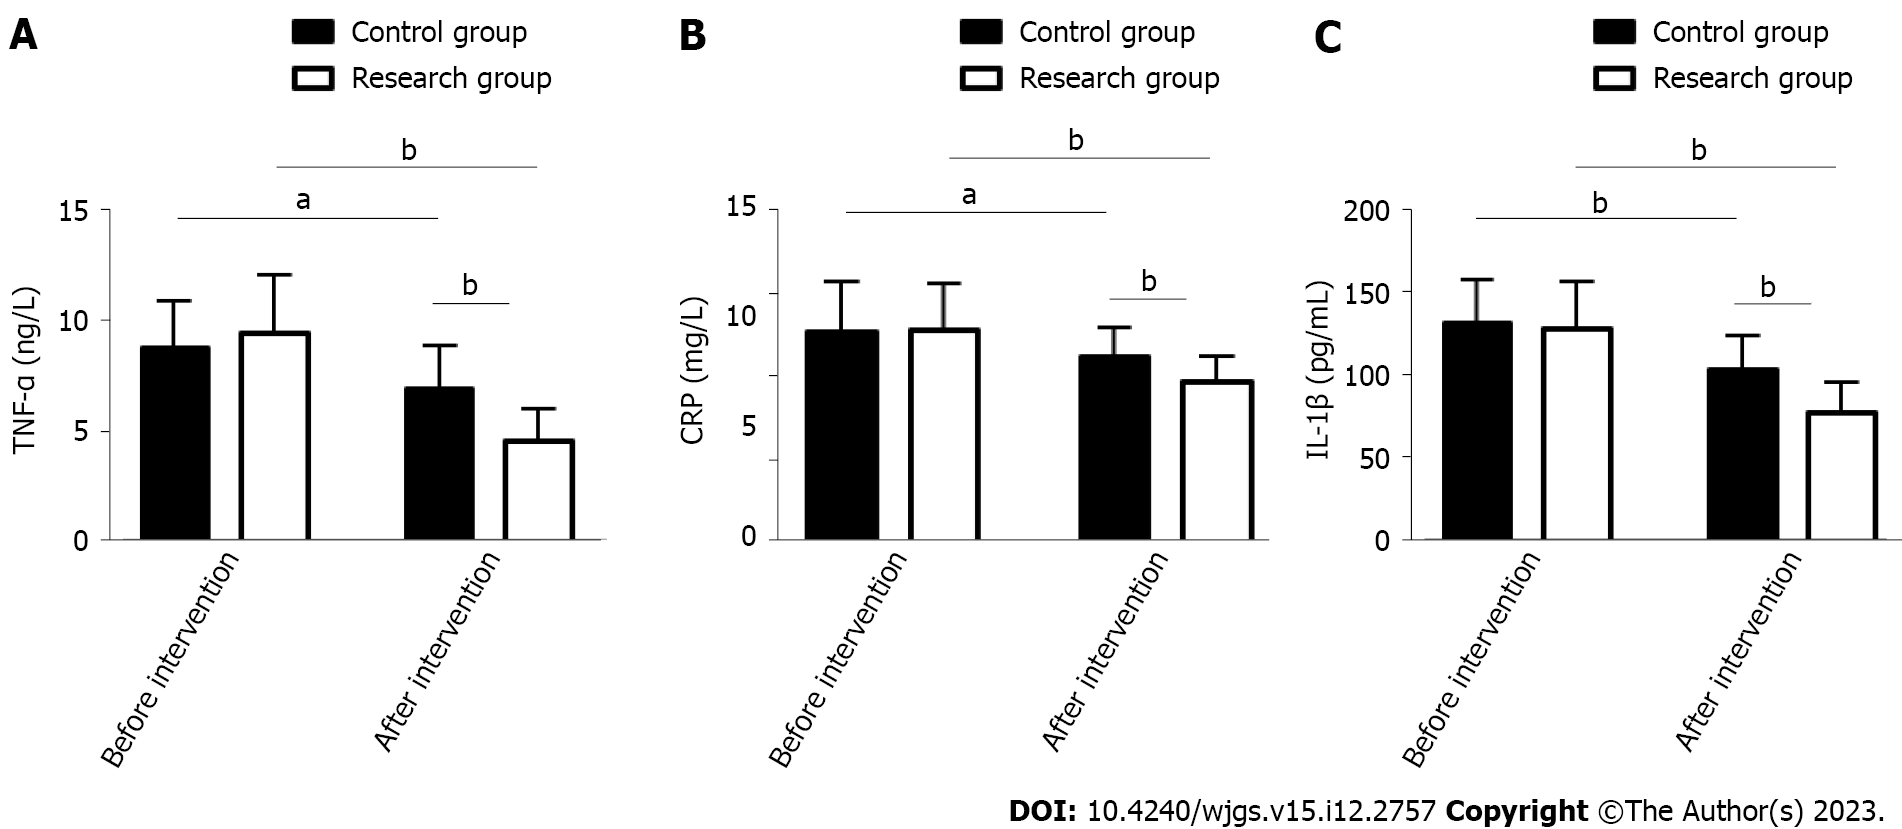
Figure 2 Tumor necrosis factor-α, C-reactive protein, and interleukin-1β of patients with peptic ulcer in the two groups.
A: Pre- and posttreatment tumor necrosis factor-α levels in the two groups; B: Pre- and posttreatment C-reactive protein levels in the two groups; C: Pre- and posttreatment IL-1β levels in the two groups. aP < 0.05, bP < 0.01. TNF-α: Tumor necrosis factor-α; CRP: C-reactive protein; IL-1β: Interleukin-1β.
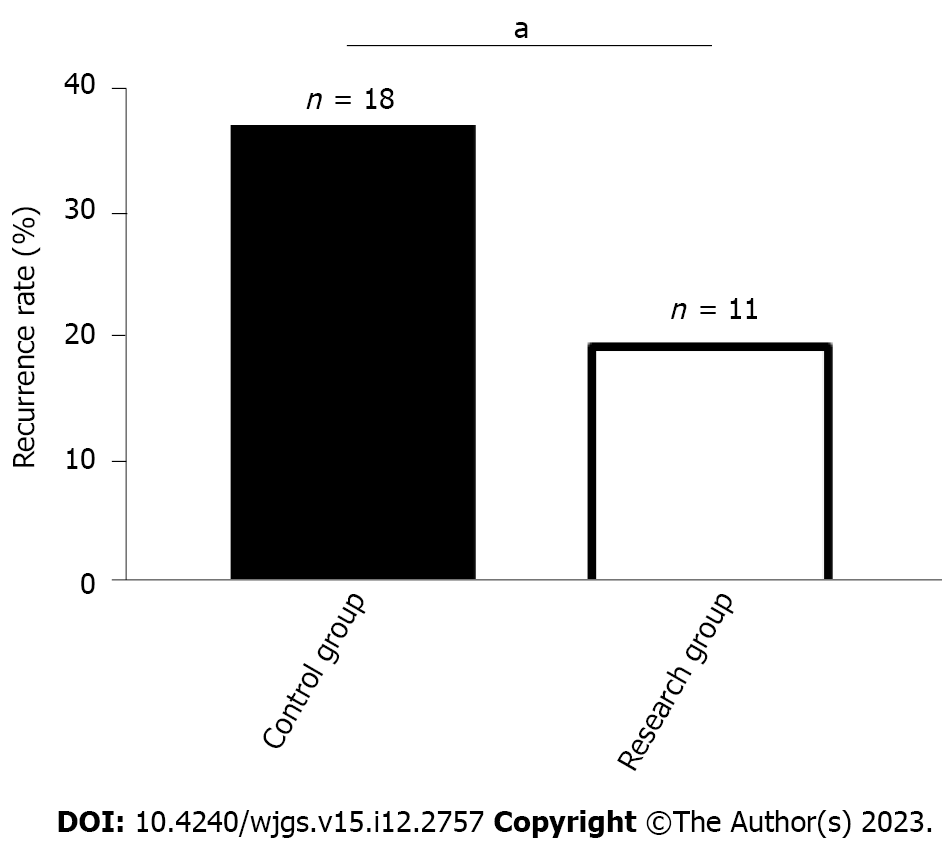
Figure 3 Recurrence rate of patients with peptic ulcer in the two groups.
aP < 0.05.
- Citation: Leng ZY, Wang JH, Gao L, Shi K, Hua HB. Efficacy of pantoprazole plus perforation repair for peptic ulcer and its effect on the stress response. World J Gastrointest Surg 2023; 15(12): 2757-2764
- URL: https://www.wjgnet.com/1948-9366/full/v15/i12/2757.htm
- DOI: https://dx.doi.org/10.4240/wjgs.v15.i12.2757


