Copyright
©The Author(s) 2023.
World J Gastrointest Surg. Nov 27, 2023; 15(11): 2513-2524
Published online Nov 27, 2023. doi: 10.4240/wjgs.v15.i11.2513
Published online Nov 27, 2023. doi: 10.4240/wjgs.v15.i11.2513
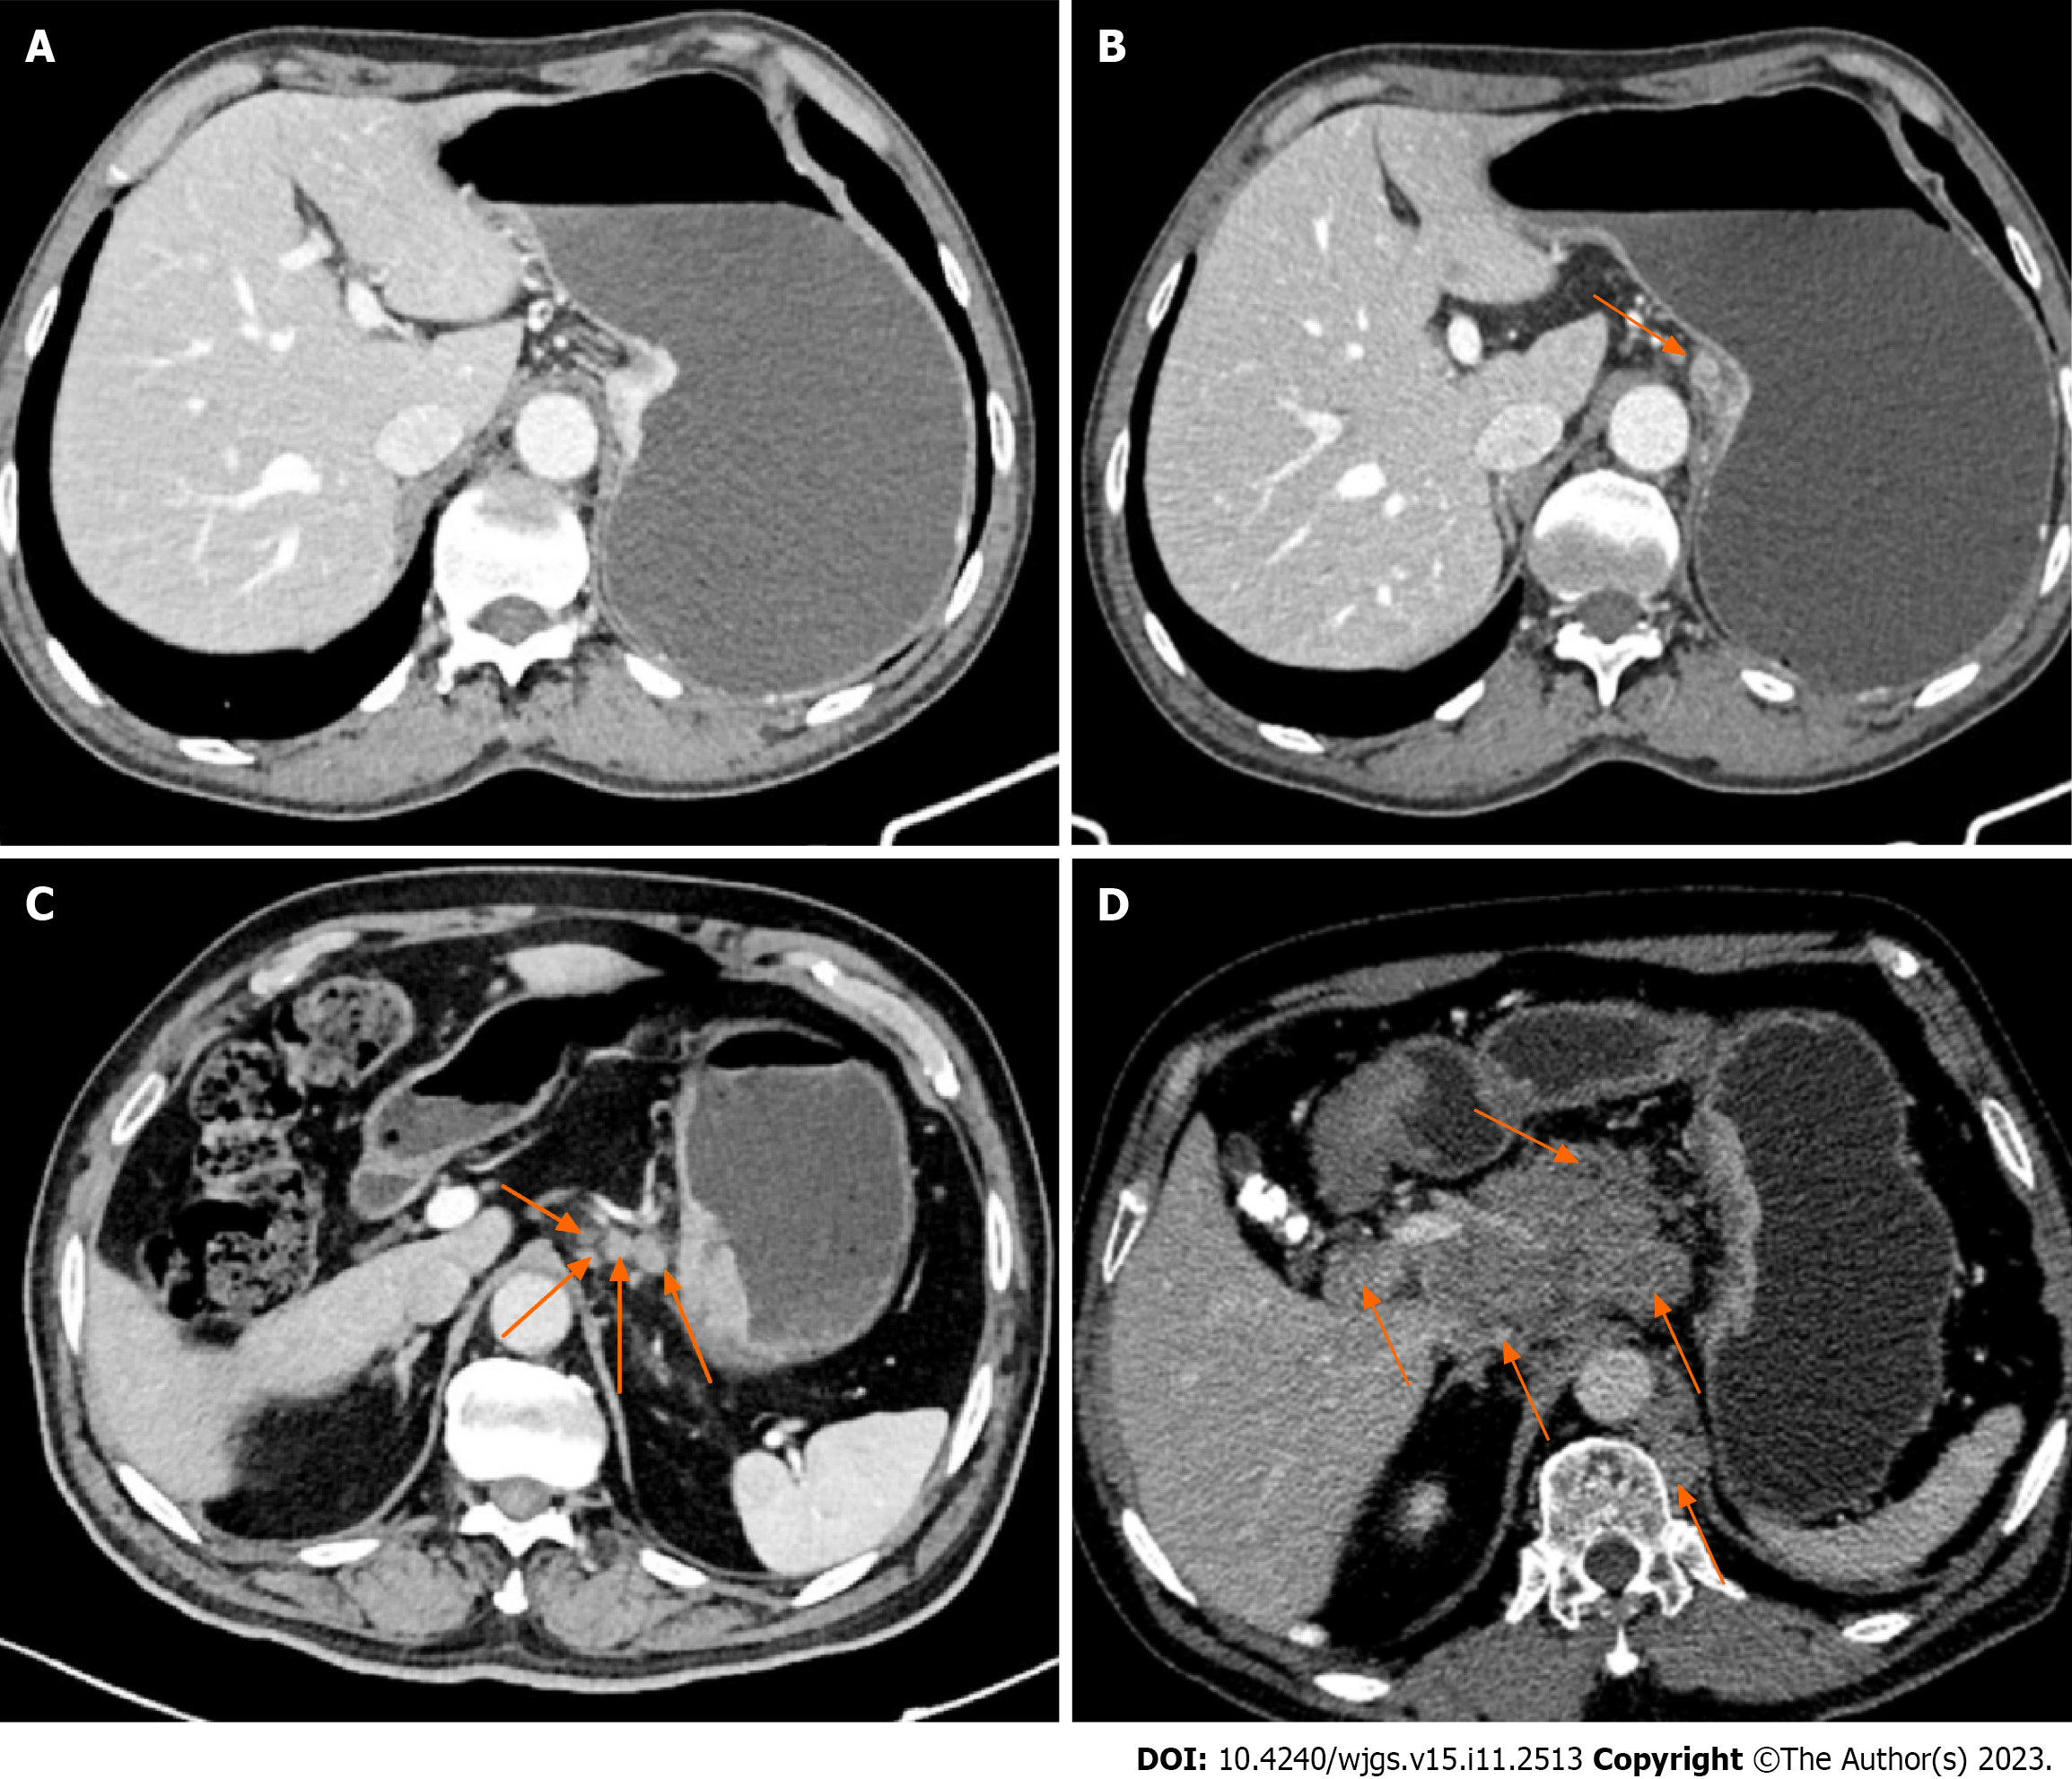
Figure 1 T staging based on three-phase dynamic contrast-enhanced computed tomography scanning.
A: In stage T1, the tumor invaded the muscularis mucosa of the stomach wall but did not invade the muscularis propria, and a clear fat layer can be seen (orange arrow); B: In stage T2, the local gastric wall of the lesser curvature of the stomach thickened uniformly and enhanced obviously, and the tumor invaded the muscularis propria. The low enhancement band of submucosal middle layer was interrupted and disappeared, and the residual part of the outer layer was slightly enhanced, with a smooth outer edge of the gastric wall (orange arrow); C: In stage T3, the highly enhanced tumor invaded the whole stomach wall, and a few short strips were observed on the serosa surface, with the surrounding fat space blurred (orange arrow); D: In stage T4, the soft tissue masses inside and outside the gastric wall of the lesser curvature side of the stomach were significantly enhanced, and the muscular interruption was clearly displayed, with the surrounding fat space banded with infiltration and accompanied by multiple liver metastases (orange arrow).
Figure 2 N staging based on three-phase dynamic contrast-enhanced computed tomography scanning.
A: N0: No local lymph node metastasis; B: N1: On the lesser curvature of the stomach, an enlarged lymph node with a diameter of approximately 10 mm is quasi-round, and slightly inhomogeneous enhancement can be observed (orange arrow); C: N2: More than 3 local lymph node metastases were in the left cardia, right cardia, and lesser curvature of the stomach, and the largest was located in the lesser curvature of the stomach, with a short diameter of approximately 12 mm (orange arrows); D: N3: There were more than 7 local lymph node metastases (e.g., porta hepatic, common hepatic artery, left gastric artery, splenic artery, celiac trunk), the lymph nodes were fused into clusters, and the lymph nodes were necrotic and uneven enhancement (orange arrows).
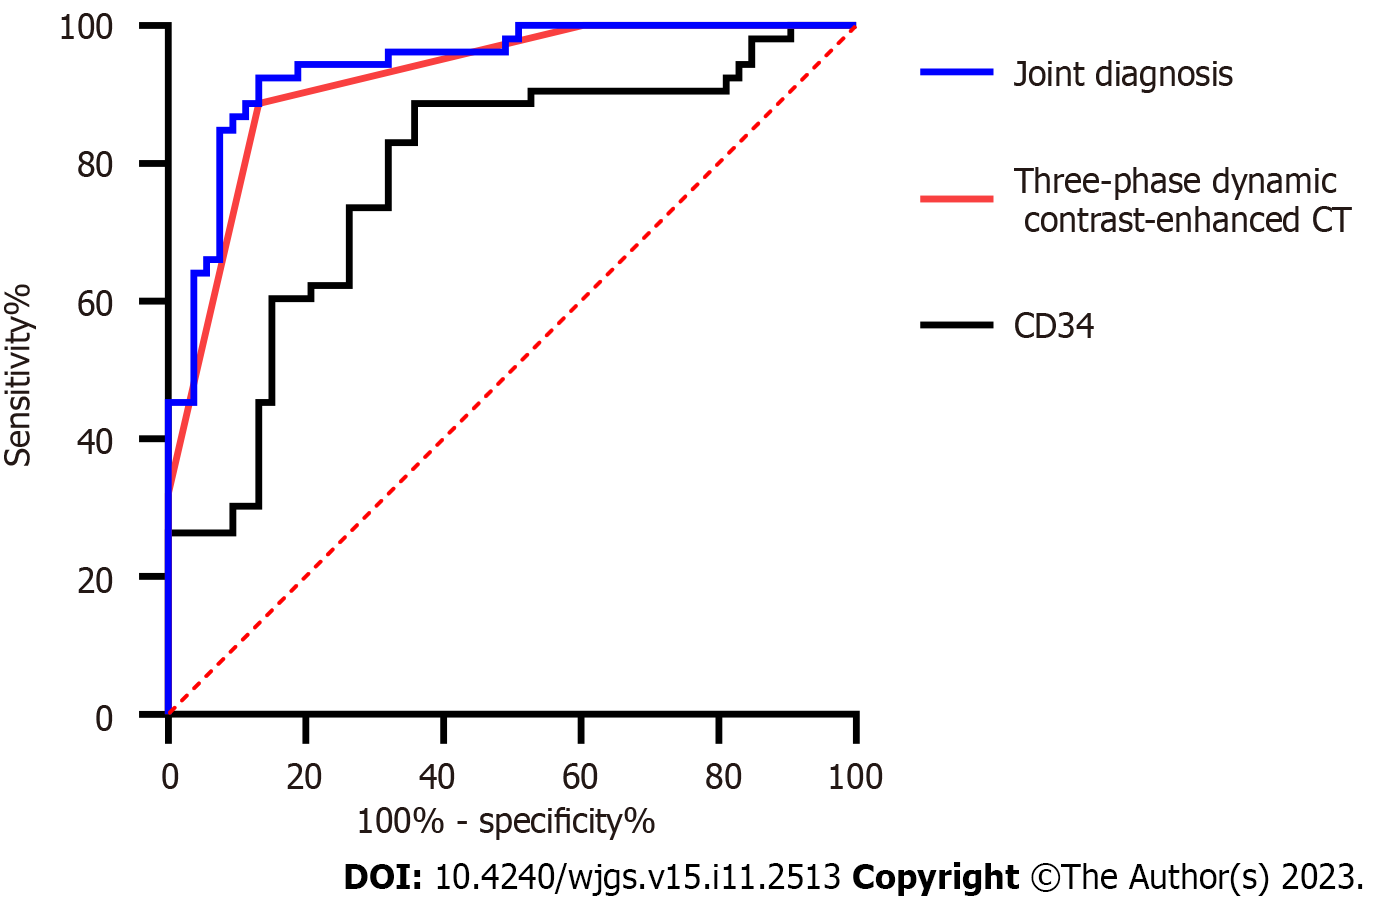
Figure 3 Receiver operating characteristic curve of dynamic three-phase enhanced computed tomography and CD34 in the diagnosis of T stage.
CT: Computed tomography.
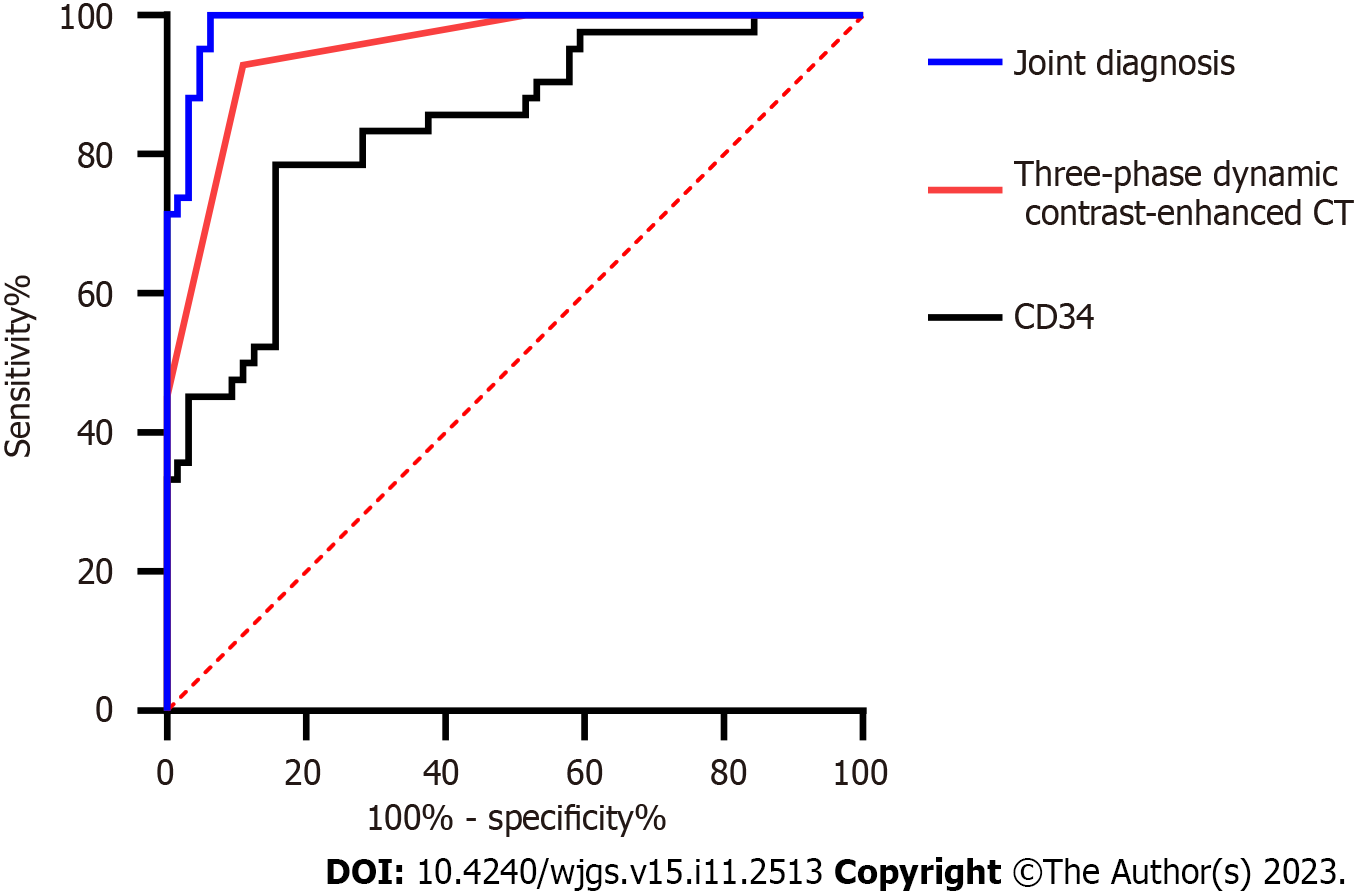
Figure 4 Receiver operating characteristic curve of dynamic three-phase enhanced computed tomography and CD34 in the diagnosis of N stage.
CT: Computed tomography.
- Citation: Liu H, Zhao KY. Application of CD34 expression combined with three-phase dynamic contrast-enhanced computed tomography scanning in preoperative staging of gastric cancer. World J Gastrointest Surg 2023; 15(11): 2513-2524
- URL: https://www.wjgnet.com/1948-9366/full/v15/i11/2513.htm
- DOI: https://dx.doi.org/10.4240/wjgs.v15.i11.2513


