Copyright
©The Author(s) 2022.
World J Gastrointest Surg. Sep 27, 2022; 14(9): 963-975
Published online Sep 27, 2022. doi: 10.4240/wjgs.v14.i9.963
Published online Sep 27, 2022. doi: 10.4240/wjgs.v14.i9.963
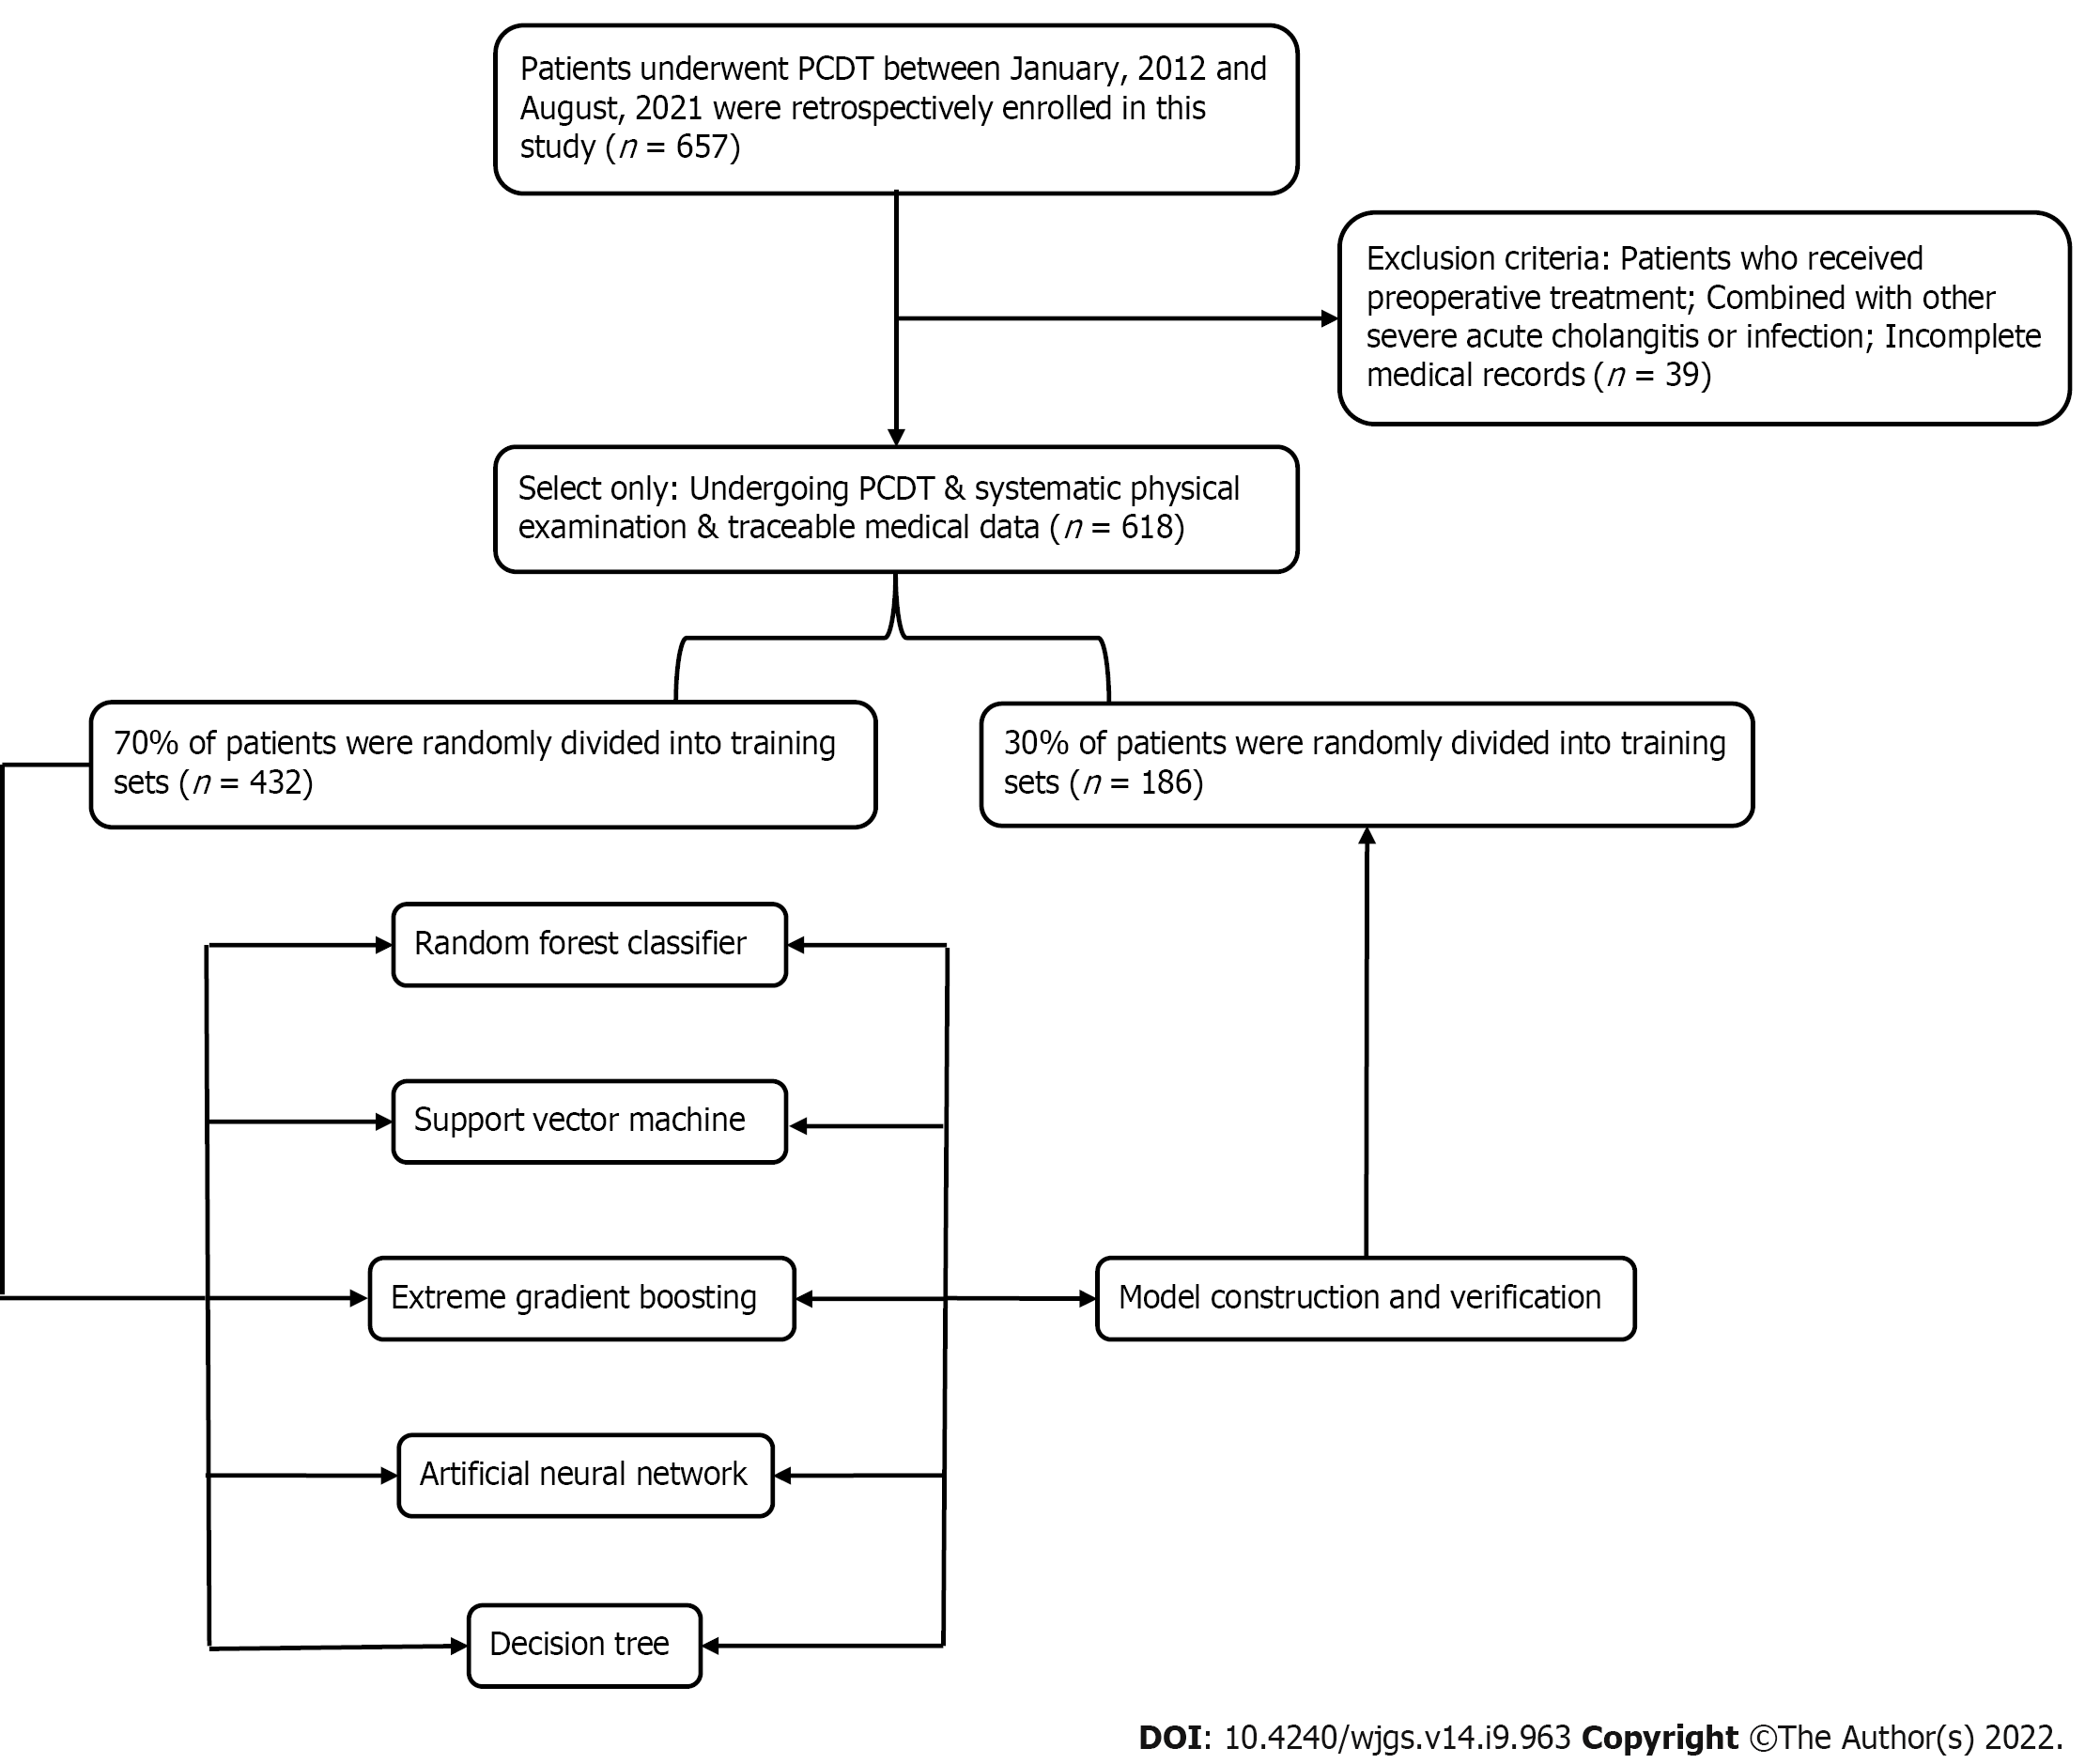
Figure 1 The flow chart.
PD: Pancreatoduodenectomy.
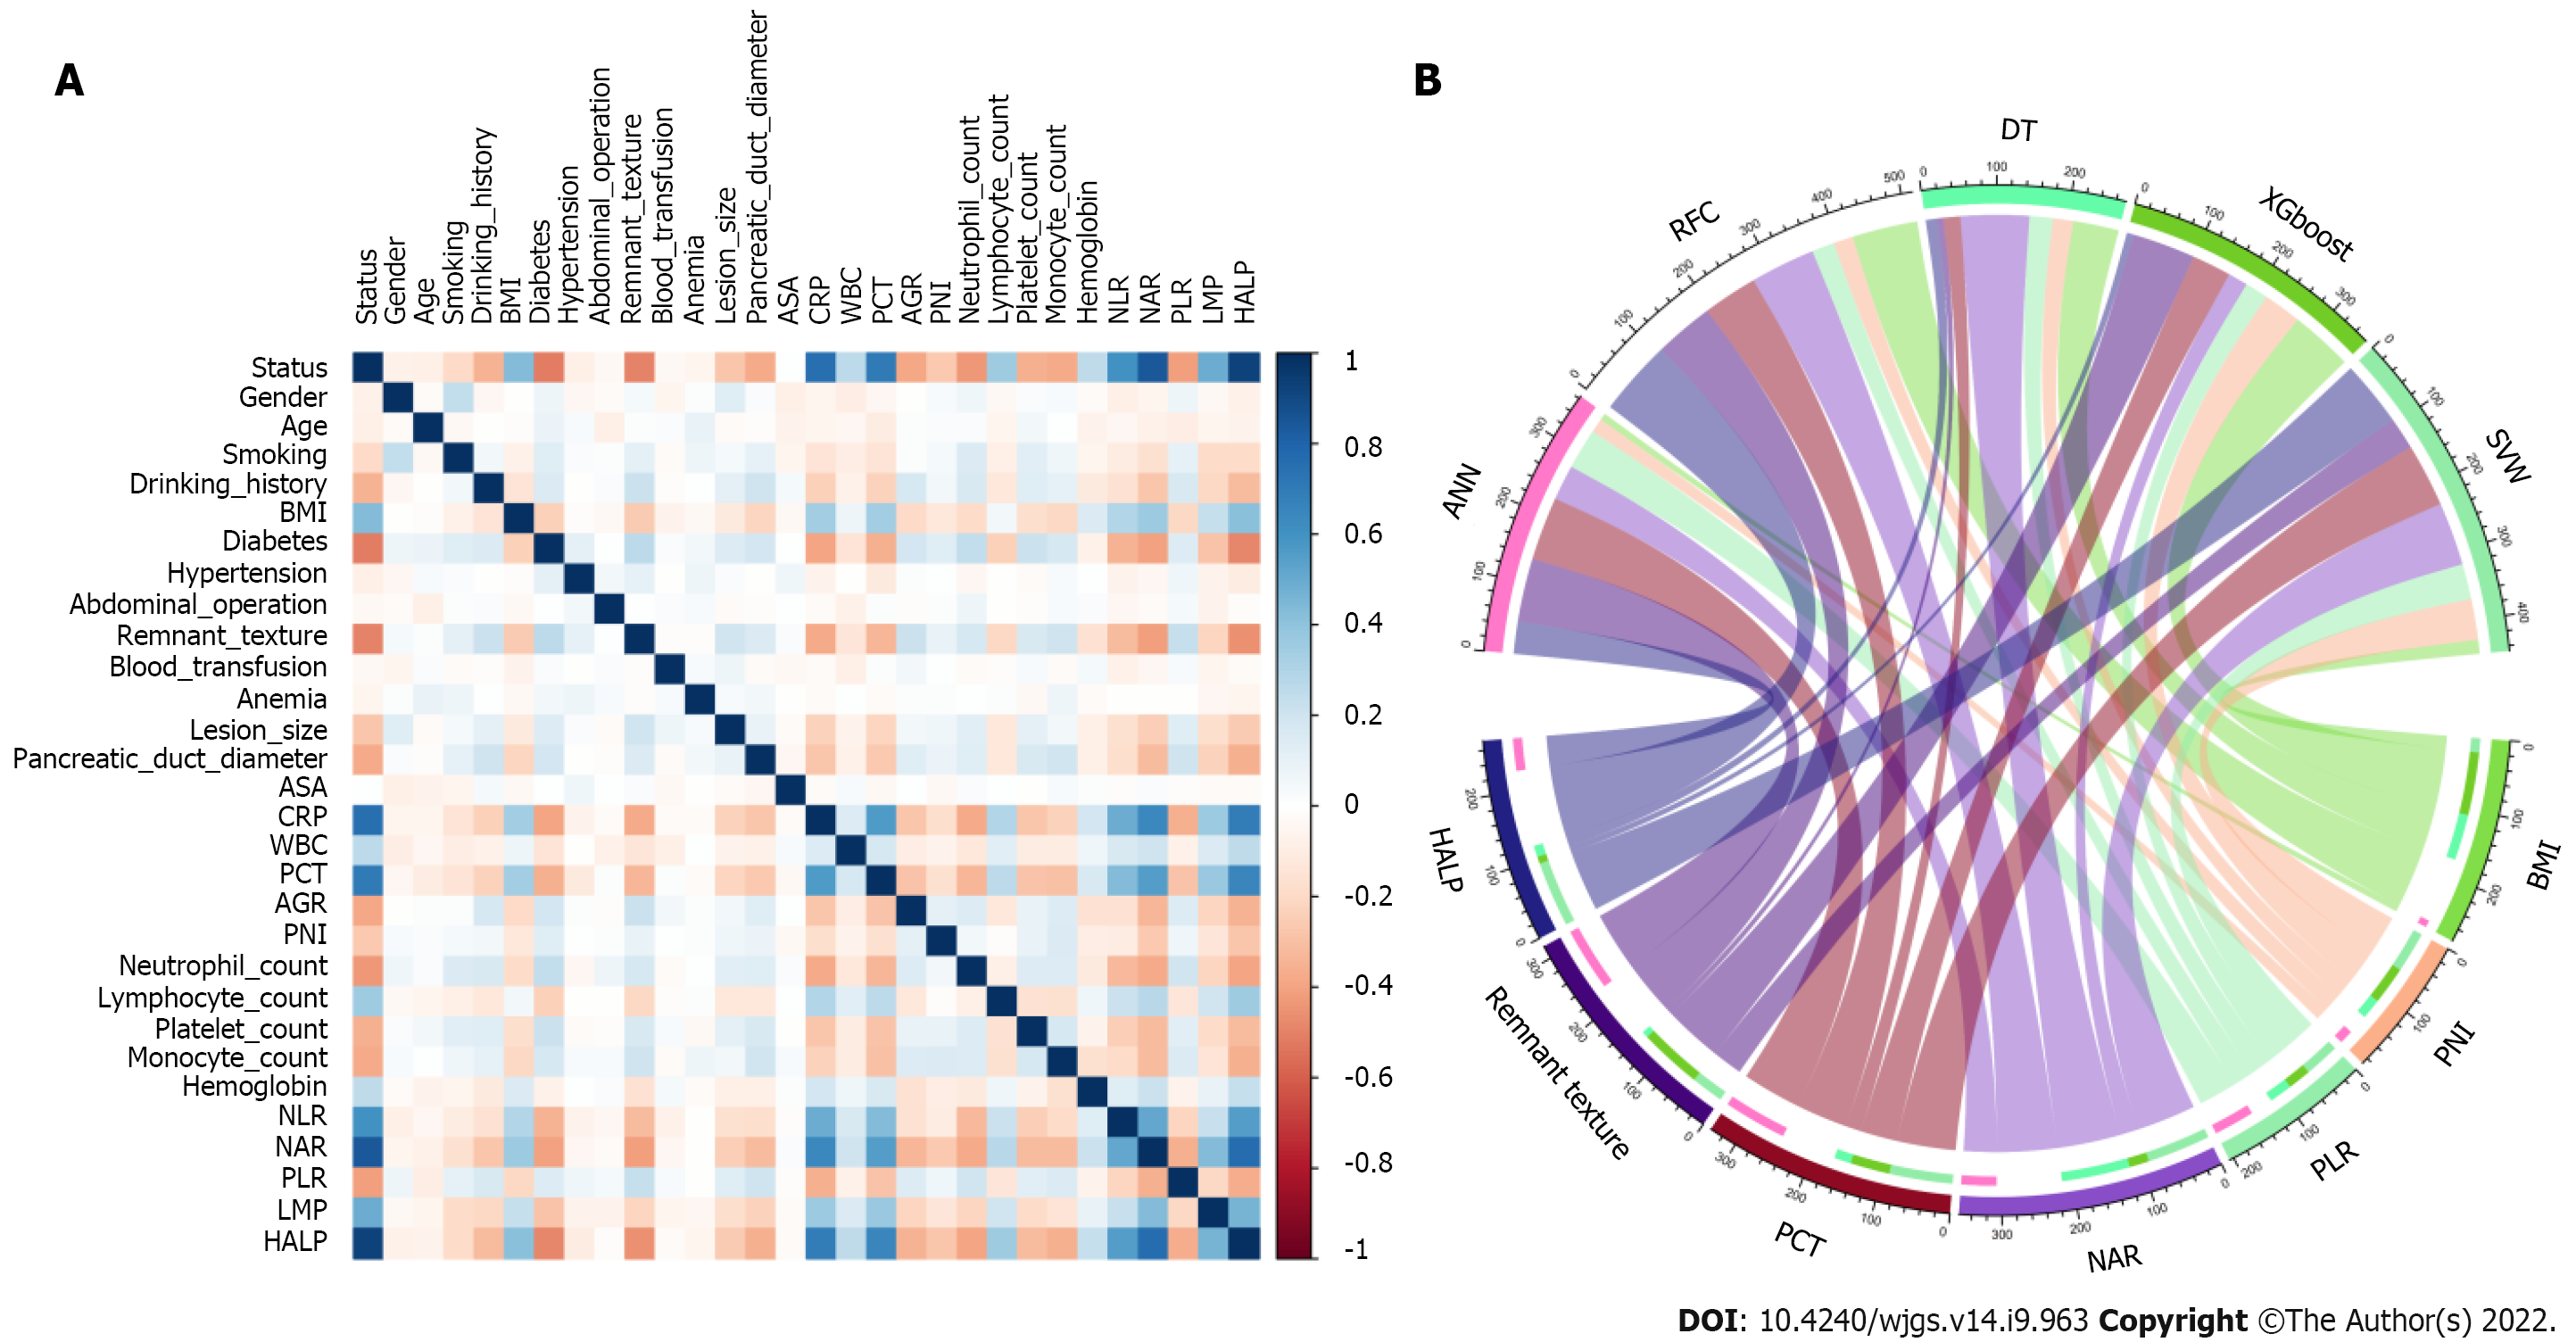
Figure 2 Variable filtering and weight allocation.
A: Correlation matrix analysis; B: Weight distribution of the candidate variables. BMI: Body mass index; ASA: American Society of Anesthesiologists; CRP: C-reactive protein; WBC: White blood cell; PCT: Procalcitonin; AGR: Albumin-to-globulin ratio; PNI: Prognostic nutrition index; NLR: Neutrophil-to-lymphocyte ratio; NAR: Neutrophil-to-albumin ratio; PLR: Platelet-to-lymphocyte ratio; LMR: Lymphocyte-to-monocyte ratio; HALP: Hemoglobin level × albumin level × lymphocyte count/platelet count ratio; RFC: Random forest classifier; SVM: Support vector machine; DT: Decision tree; ANN: Artificial neural network; XGboost: Extreme gradient boosting.
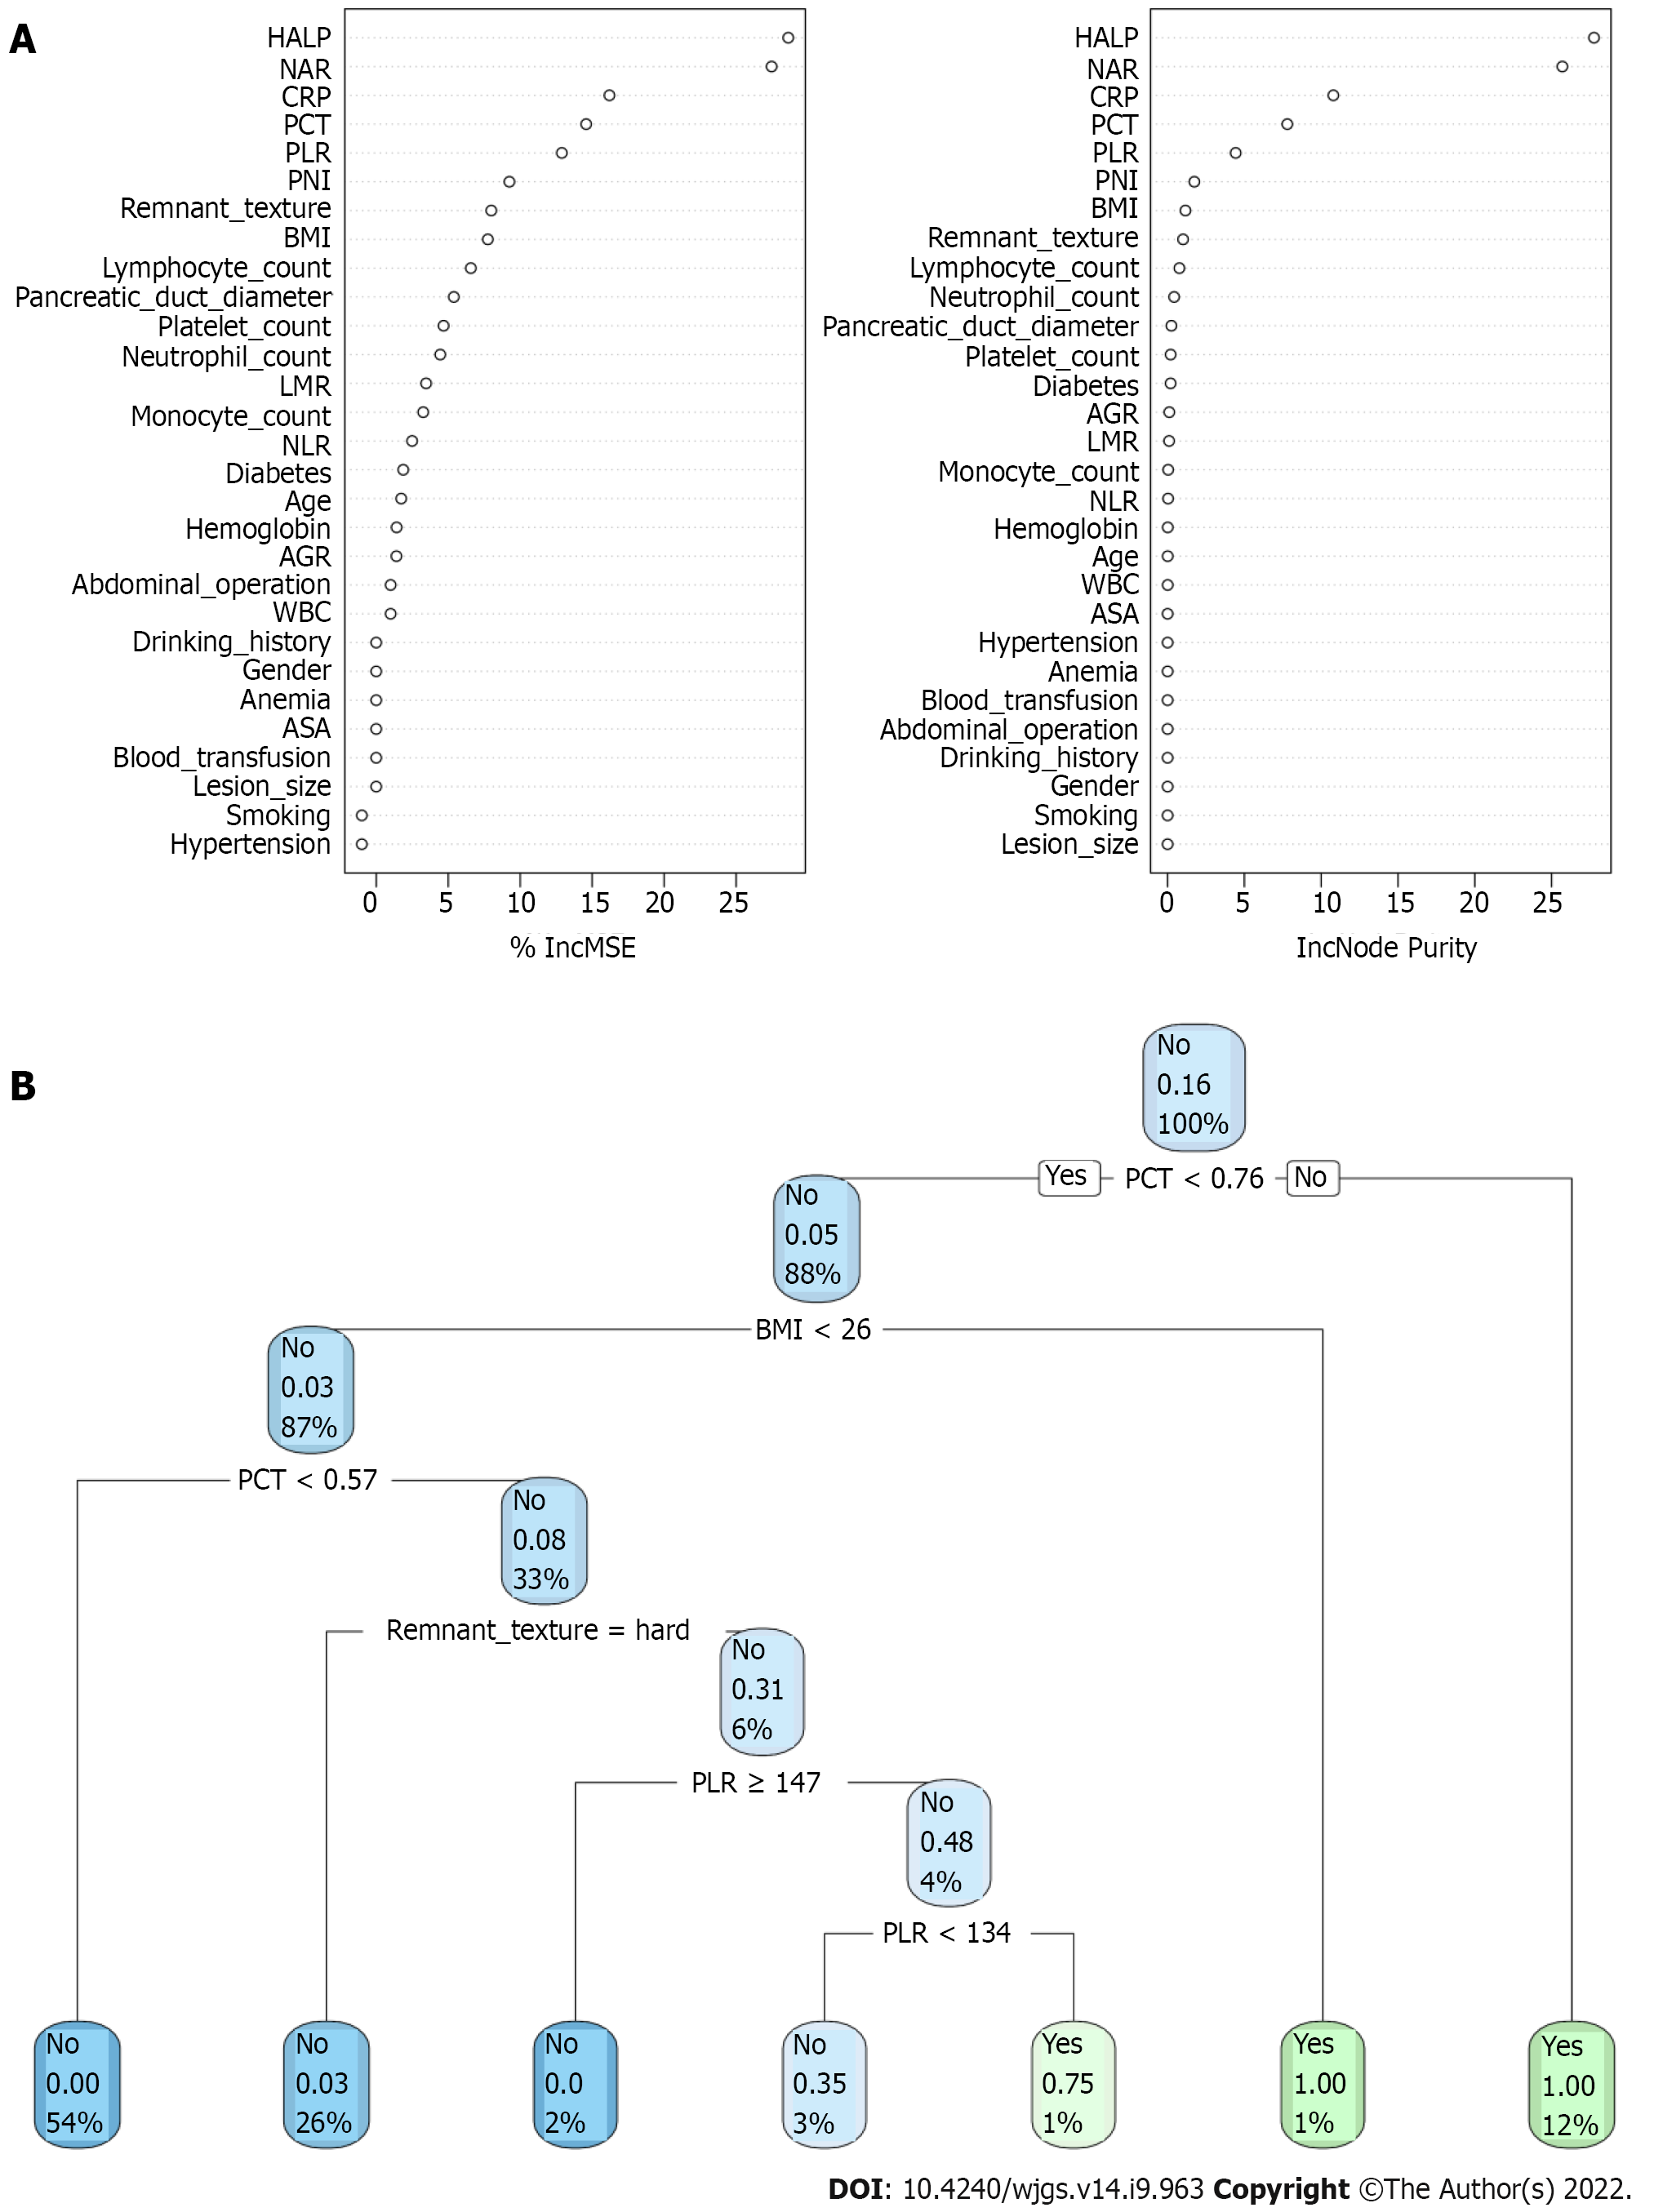
Figure 3 Visualization of predictive model based on machine learning algorithm.
A: Random forest classifier model; B: Decision tree (DT) model. The candidate factors associated with postoperative pancreatic fistula were ordered via RFC algorithm (A) and (B) prediction node and weight were allocated via DT algorithm. BMI: Body mass index; ASA: American Society of Anesthesiologists; CRP: C-reactive protein; WBC: White blood cell; PCT: Procalcitonin; AGR: Albumin-to-globulin ratio; PNI: Prognostic nutrition index; NLR: Neutrophil-to-lymphocyte ratio; NAR: Neutrophil-to-albumin ratio; PLR: Platelet-to-lymphocyte ratio; LMR: Lymphocyte-to-monocyte ratio; HALP: Hemoglobin level × albumin level × lymphocyte count/platelet count ratio; RFC: Random forest classifier; SVM: Support vector machine; DT: Decision tree; ANN: Artificial neural network.
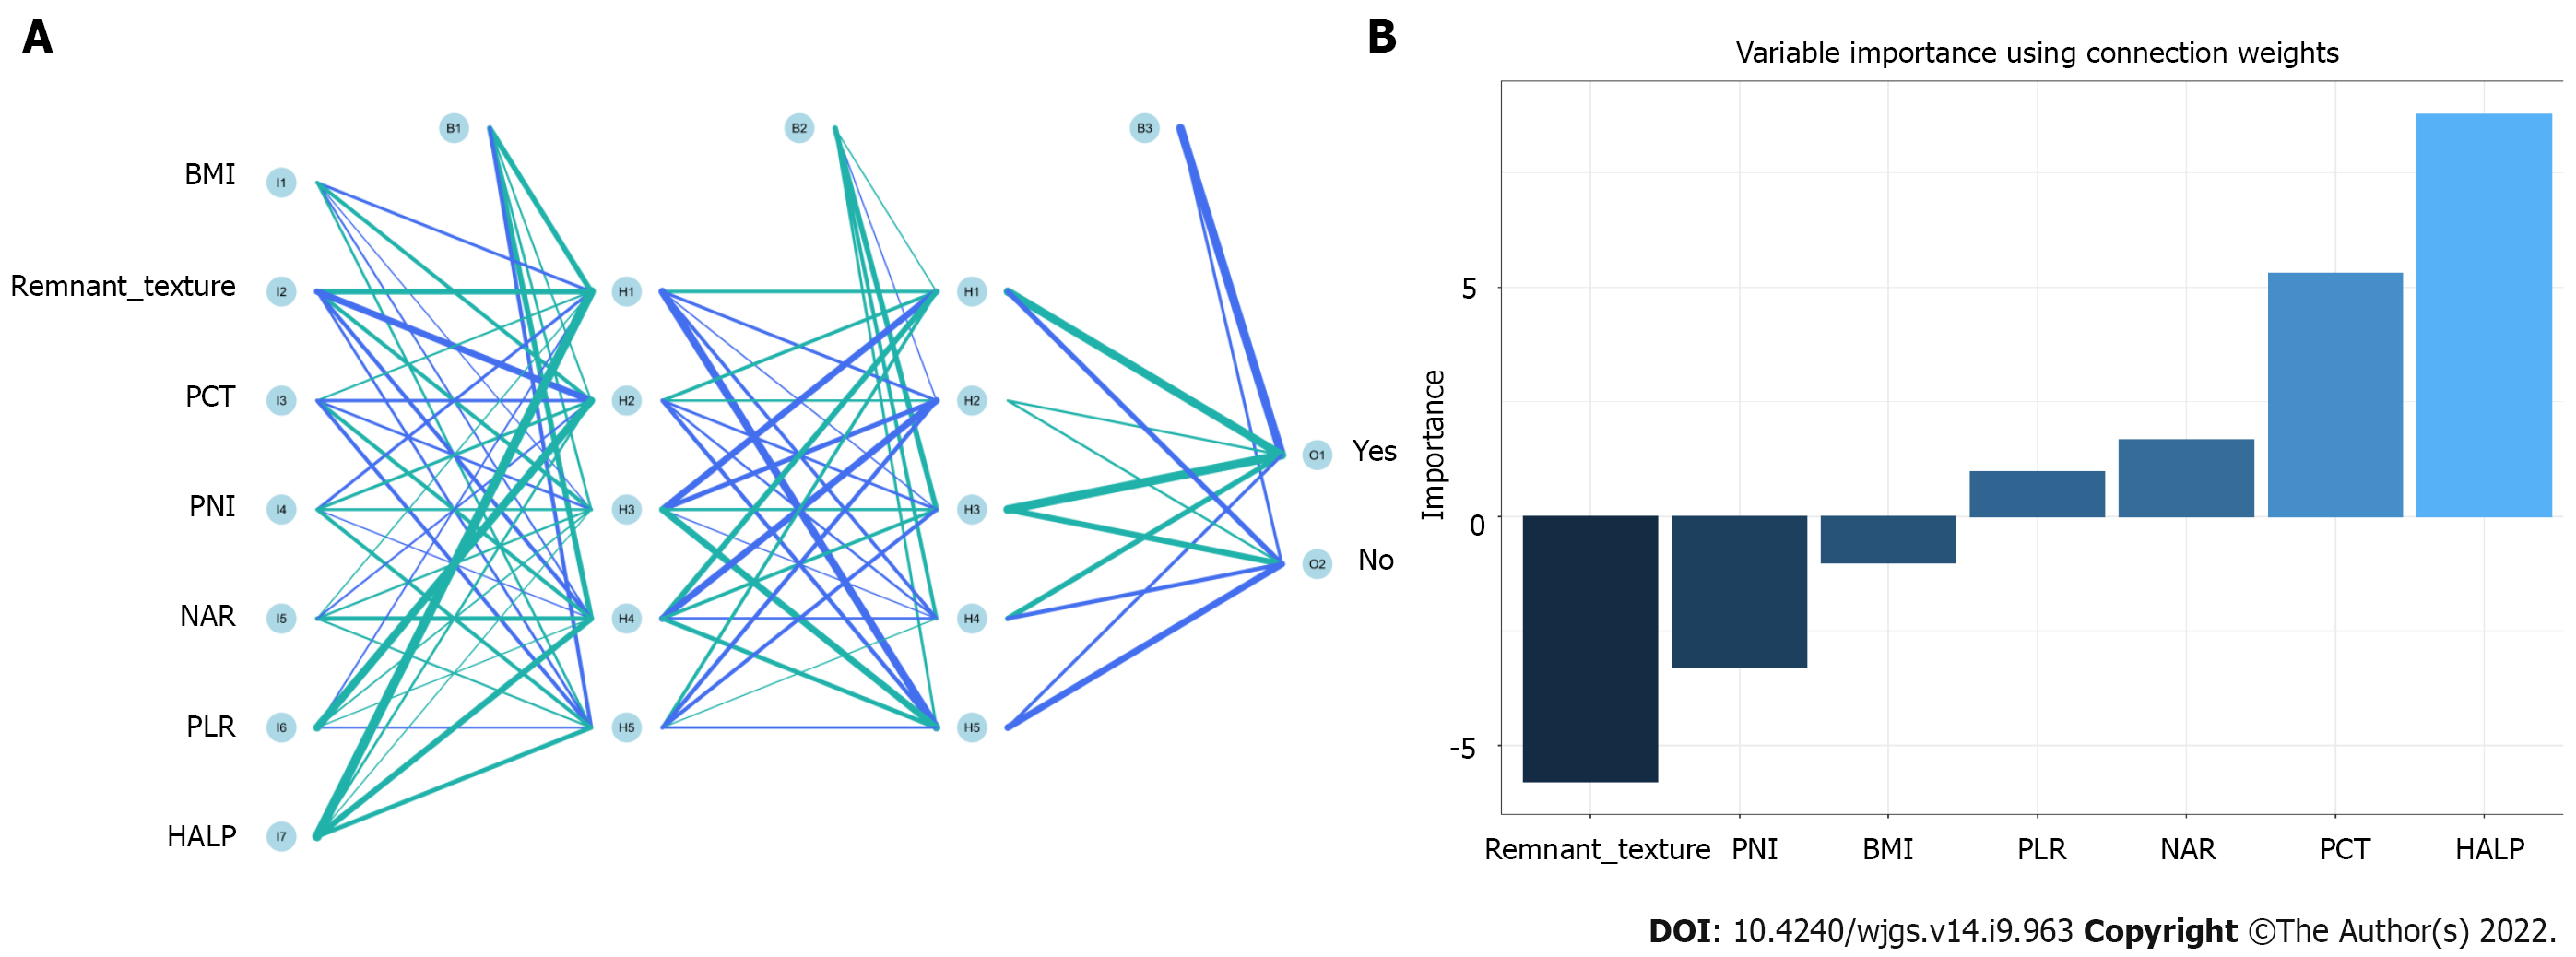
Figure 4 Visualization of predictive model based on artificial neural network algorithm.
A: Artificial neural network model; B: Variable importance using connection weight. BMI: Body mass index; PCT: Procalcitonin; PNI: Prognostic nutrition index; NAR: Neutrophil-to-albumin ratio; PLR: Platelet-to-lymphocyte ratio; HALP: Hemoglobin level × albumin level × lymphocyte count/platelet count ratio.
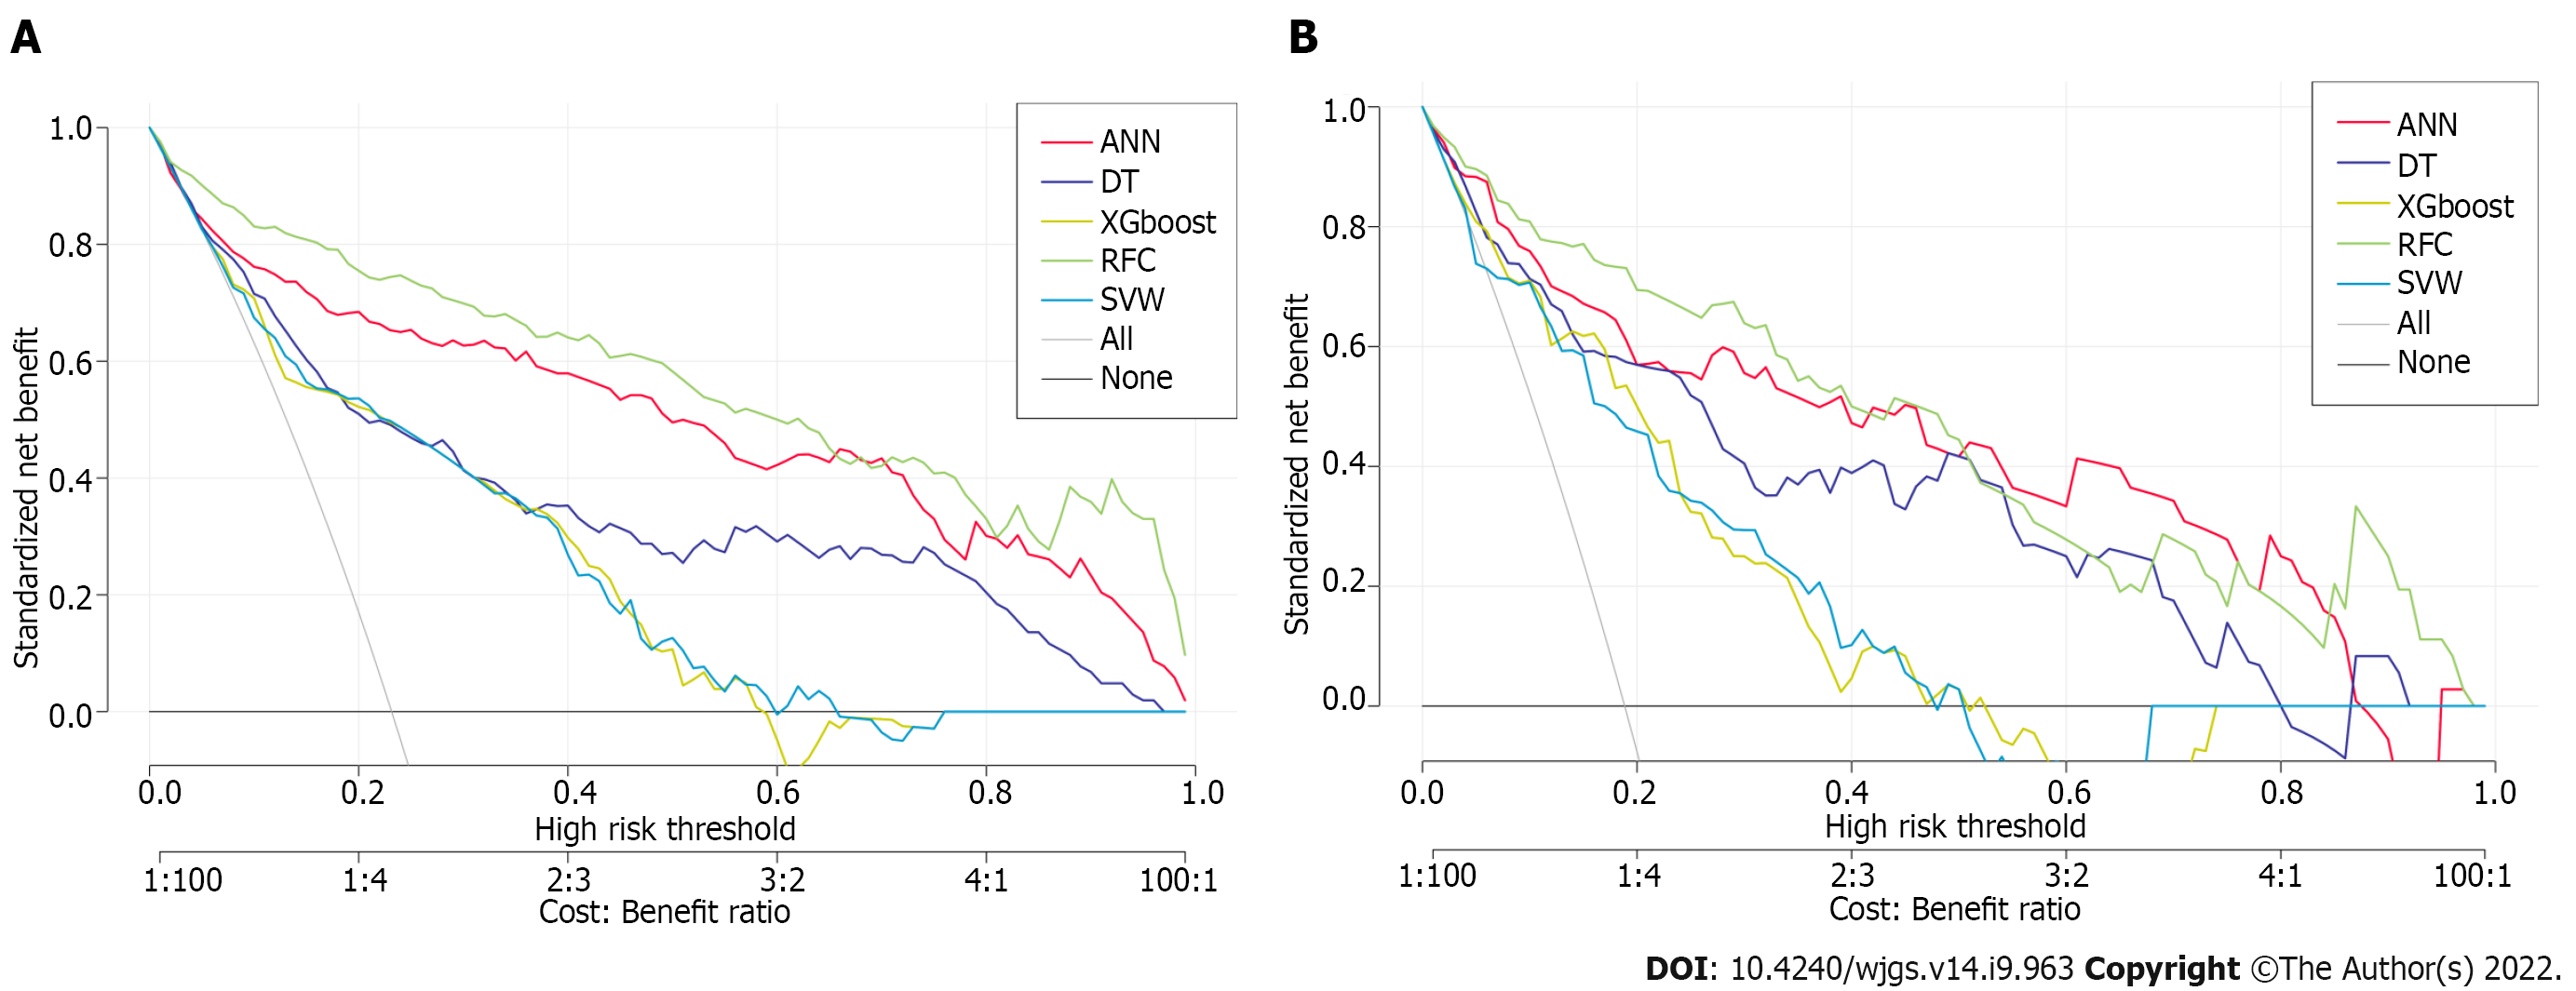
Figure 5 Efficiency evaluation of machine learning-based prediction model.
A: Decision curve analysis (DCA) of training set; B: DCA of testing set. SVM: Support vector machine; DT: Decision tree; ANN: Artificial neural network; RFC: Random forest classifier; XGboost: Extreme gradient boosting.
- Citation: Long ZD, Lu C, Xia XG, Chen B, Xing ZX, Bie L, Zhou P, Ma ZL, Wang R. Personal predictive model based on systemic inflammation markers for estimation of postoperative pancreatic fistula following pancreaticoduodenectomy. World J Gastrointest Surg 2022; 14(9): 963-975
- URL: https://www.wjgnet.com/1948-9366/full/v14/i9/963.htm
- DOI: https://dx.doi.org/10.4240/wjgs.v14.i9.963


