Copyright
©The Author(s) 2022.
World J Gastrointest Surg. Feb 27, 2022; 14(2): 161-173
Published online Feb 27, 2022. doi: 10.4240/wjgs.v14.i2.161
Published online Feb 27, 2022. doi: 10.4240/wjgs.v14.i2.161
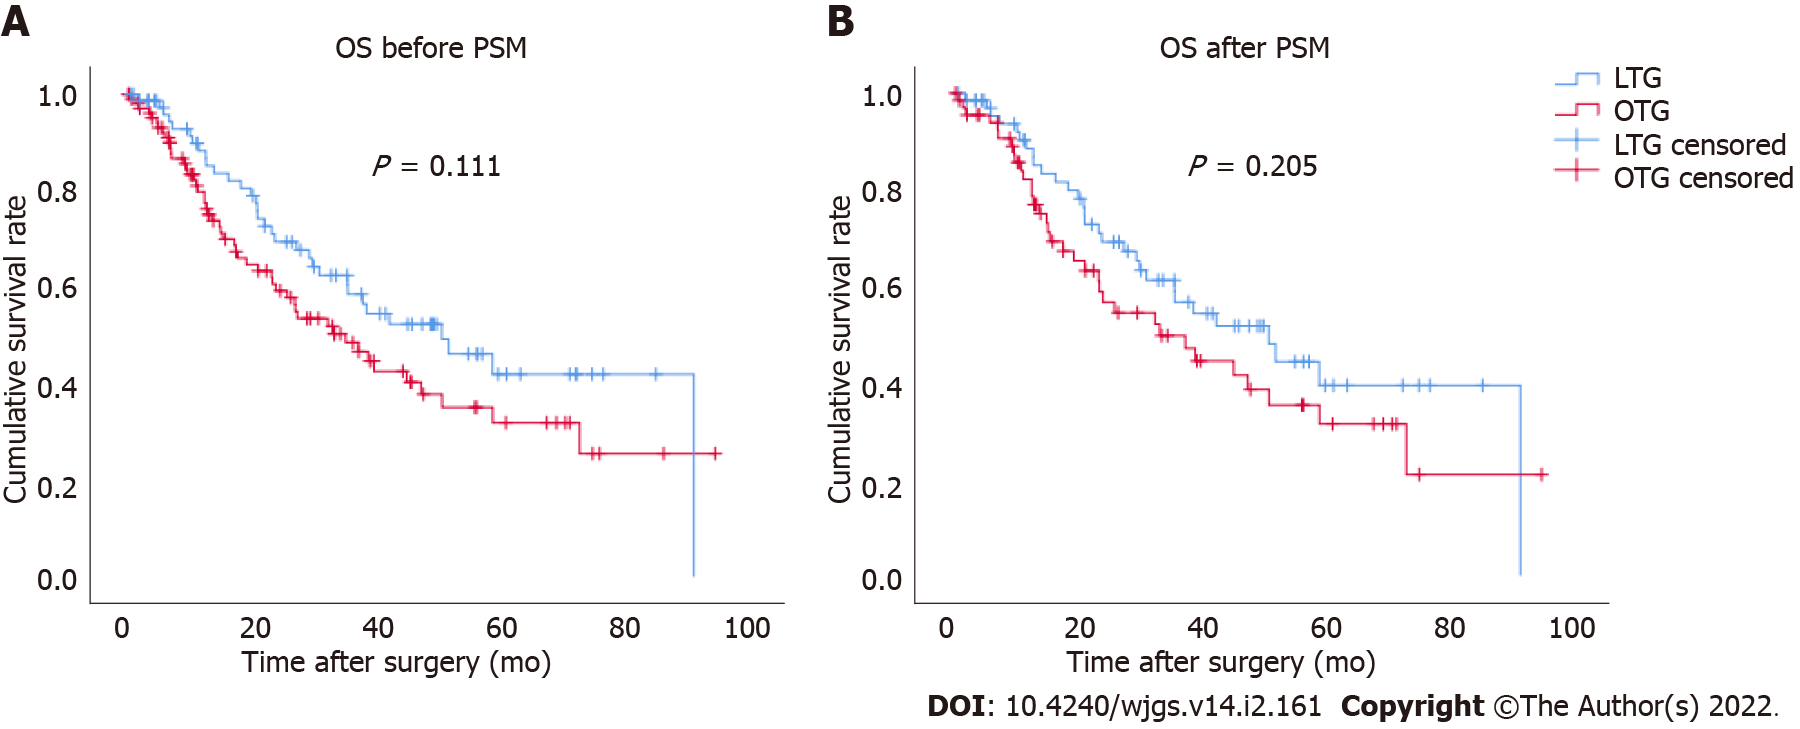
Figure 1 Comparison of cumulative survival rates between laparoscopic total gastrectomy and open total gastrectomy.
A: Before propensity score matching (PSM); B: After PSM. There was no statistically significant difference in overall survival between the two groups before (P = 0.111) and after PSM (P = 0.205). LTG: Laparoscopic total gastrectomy; OTG: Open total gastrectomy; OS: Overall survival; PSM: Propensity score matching.
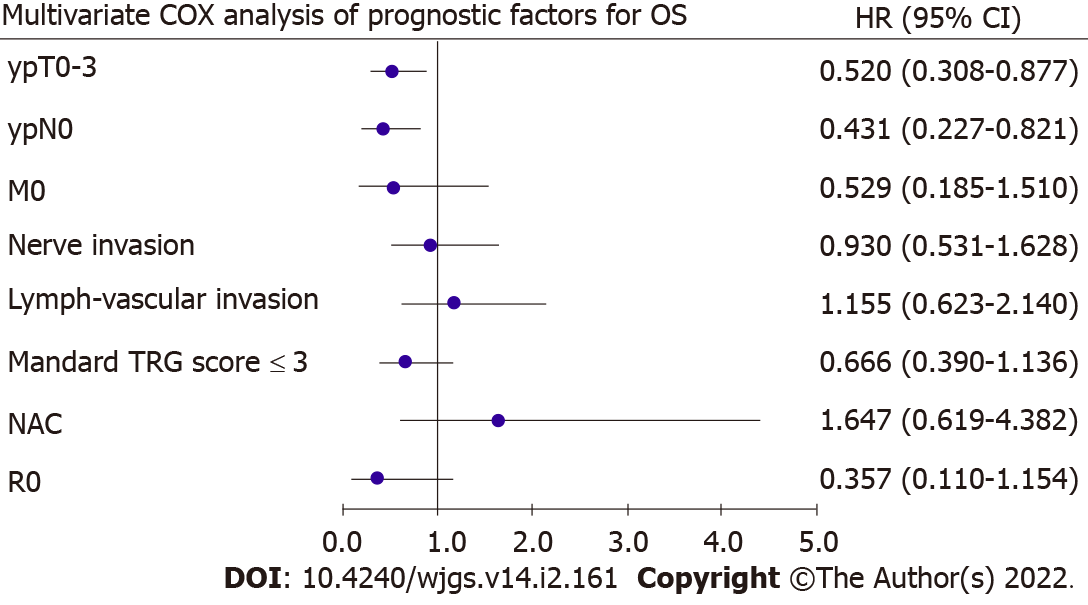
Figure 2 Forest graph of multivariate COX analysis of prognostic factors for overall survival.
Pathological T stage and N stage were found as independent risk factors for overall survival. OS: Overall survival; HR: Hazard ratio; CI: Confidence interval; TRG: Tumor regression grading; NAC: Neoadjuvant chemotherapy.
- Citation: Hu HT, Ma FH, Xiong JP, Li Y, Jin P, Liu H, Ma S, Kang WZ, Tian YT. Laparoscopic vs open total gastrectomy for advanced gastric cancer following neoadjuvant therapy: A propensity score matching analysis. World J Gastrointest Surg 2022; 14(2): 161-173
- URL: https://www.wjgnet.com/1948-9366/full/v14/i2/161.htm
- DOI: https://dx.doi.org/10.4240/wjgs.v14.i2.161


