Copyright
©The Author(s) 2024.
World J Diabetes. Aug 15, 2024; 15(8): 1778-1792
Published online Aug 15, 2024. doi: 10.4239/wjd.v15.i8.1778
Published online Aug 15, 2024. doi: 10.4239/wjd.v15.i8.1778
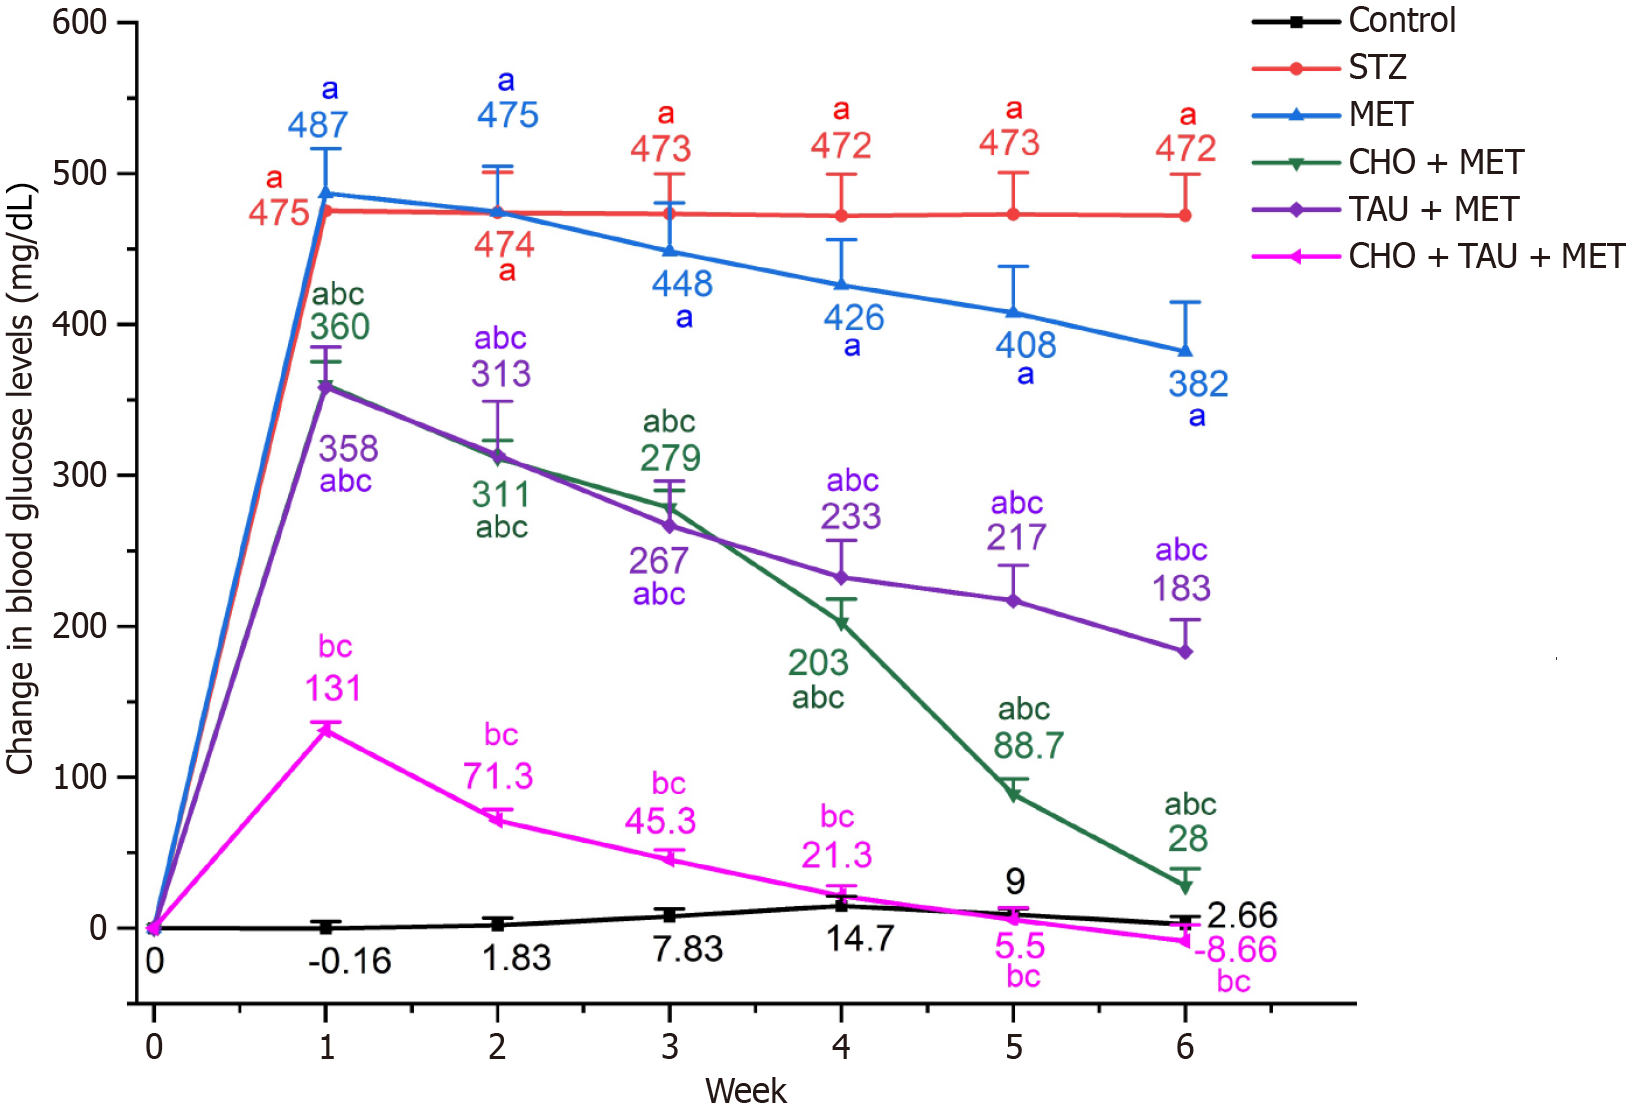
Figure 1 Changes in blood glucose levels in the control and experimental groups.
STZ: Streptozotocin; MET: Metformin; CHO: Cholecalciferol; TAU: Taurine. aSignificance compared to the control group. bSignificance compared to the Streptozotocin diabetic group. CSignificance compared to the metformin-treated group.
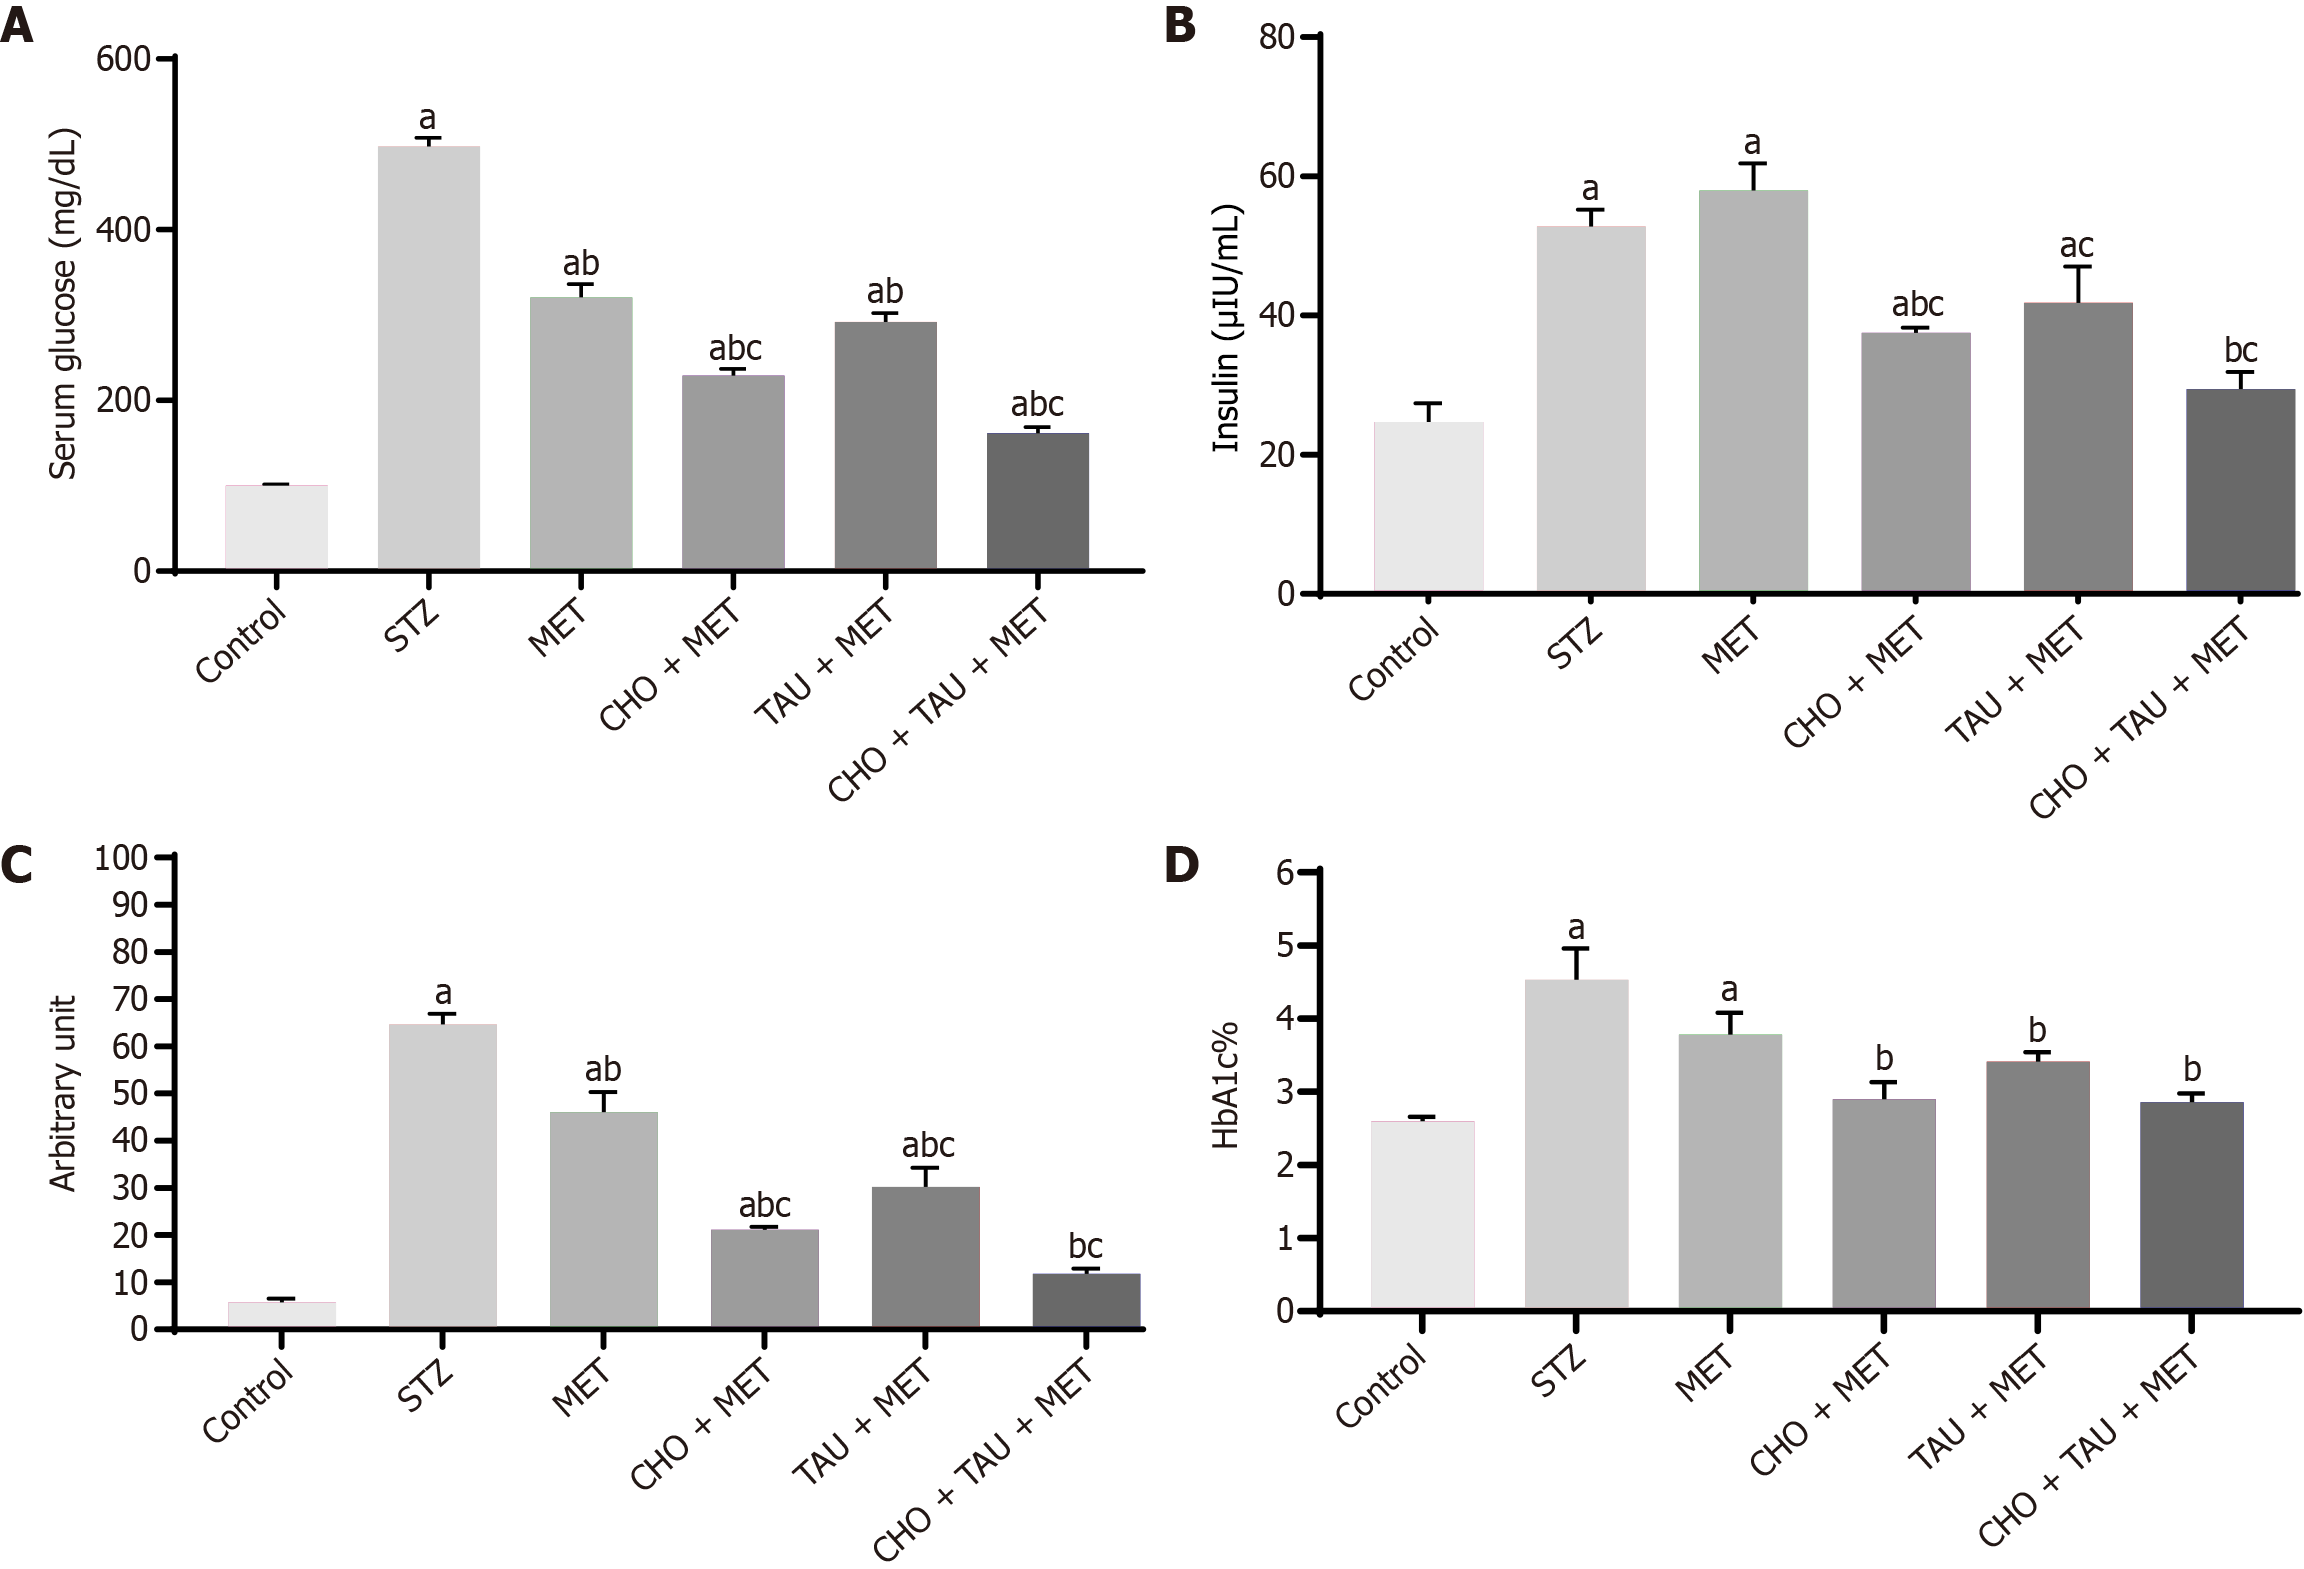
Figure 2 Assessment of glycemic profiles.
A-D: Measurement of serum glucose level (A), insulin level (B), Homeostasis Model Assessment of Insulin Resistance levels (C), glycated hemoglobin% (D) in the control group and other experimental groups. The data, presented as means ± SE (n = 6), indicate significant differences at P < 0.05. STZ: Streptozotocin; MET: Metformin; CHO: Cholecalciferol; TAU: Taurine; HbA1c: Glycated hemoglobin. aSignificance compared to the control group. bSignificance compared to the Streptozotocin diabetic group. cSignificance compared to the metformin-treated group.
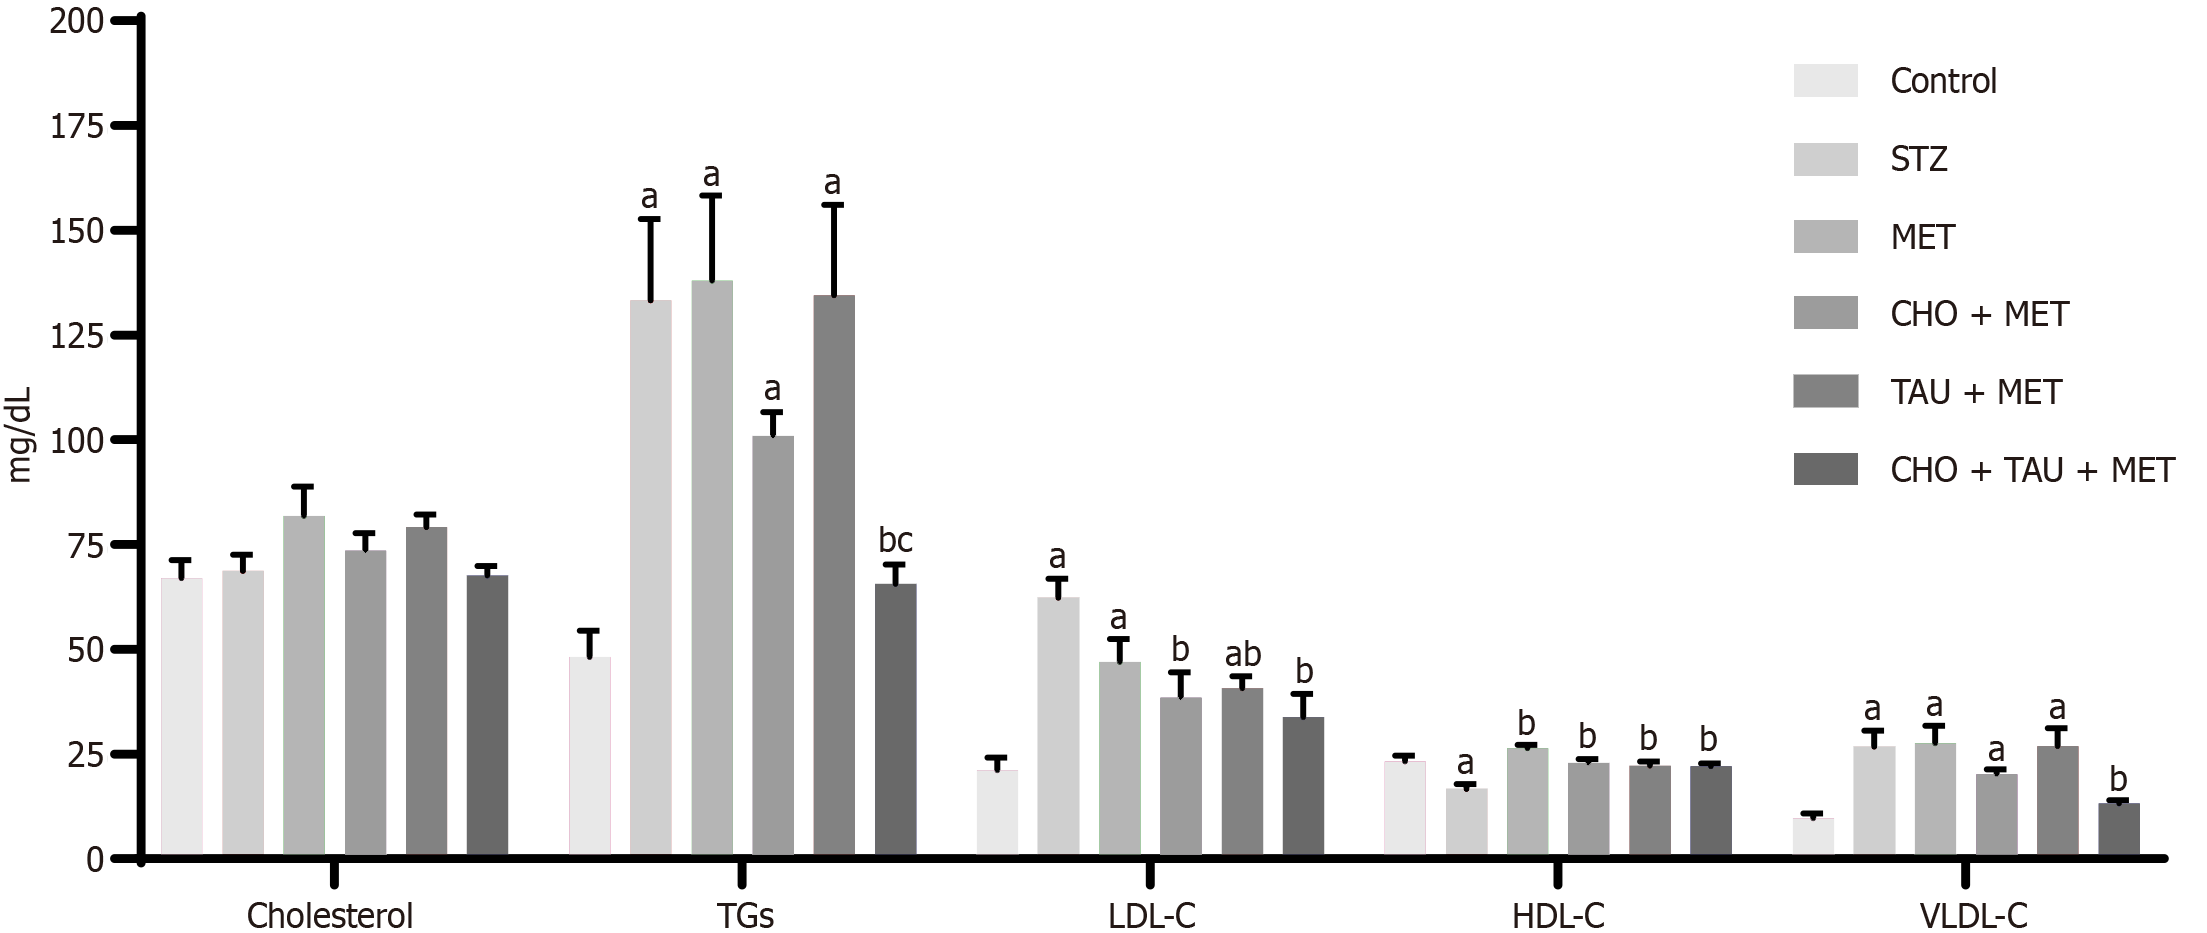
Figure 3 Lipid markers measurements in the control group and other experimental groups.
The data, presented as means ± SE (n = 6), indicate significant differences at P < 0.05. STZ: Streptozotocin; MET: Metformin; CHO: Cholecalciferol; TAU: Taurine; TGs: Triglycerides; LDL-C: Low-density lipoprotein cholesterol; HDL-C: High-density lipoprotein cholesterol; VLVL-C: Very low-density lipoprotein cholesterol. aSignificance compared to the control group. bSignificance compared to the Streptozotocin diabetic group. cSignificance compared to the metformin-treated group.
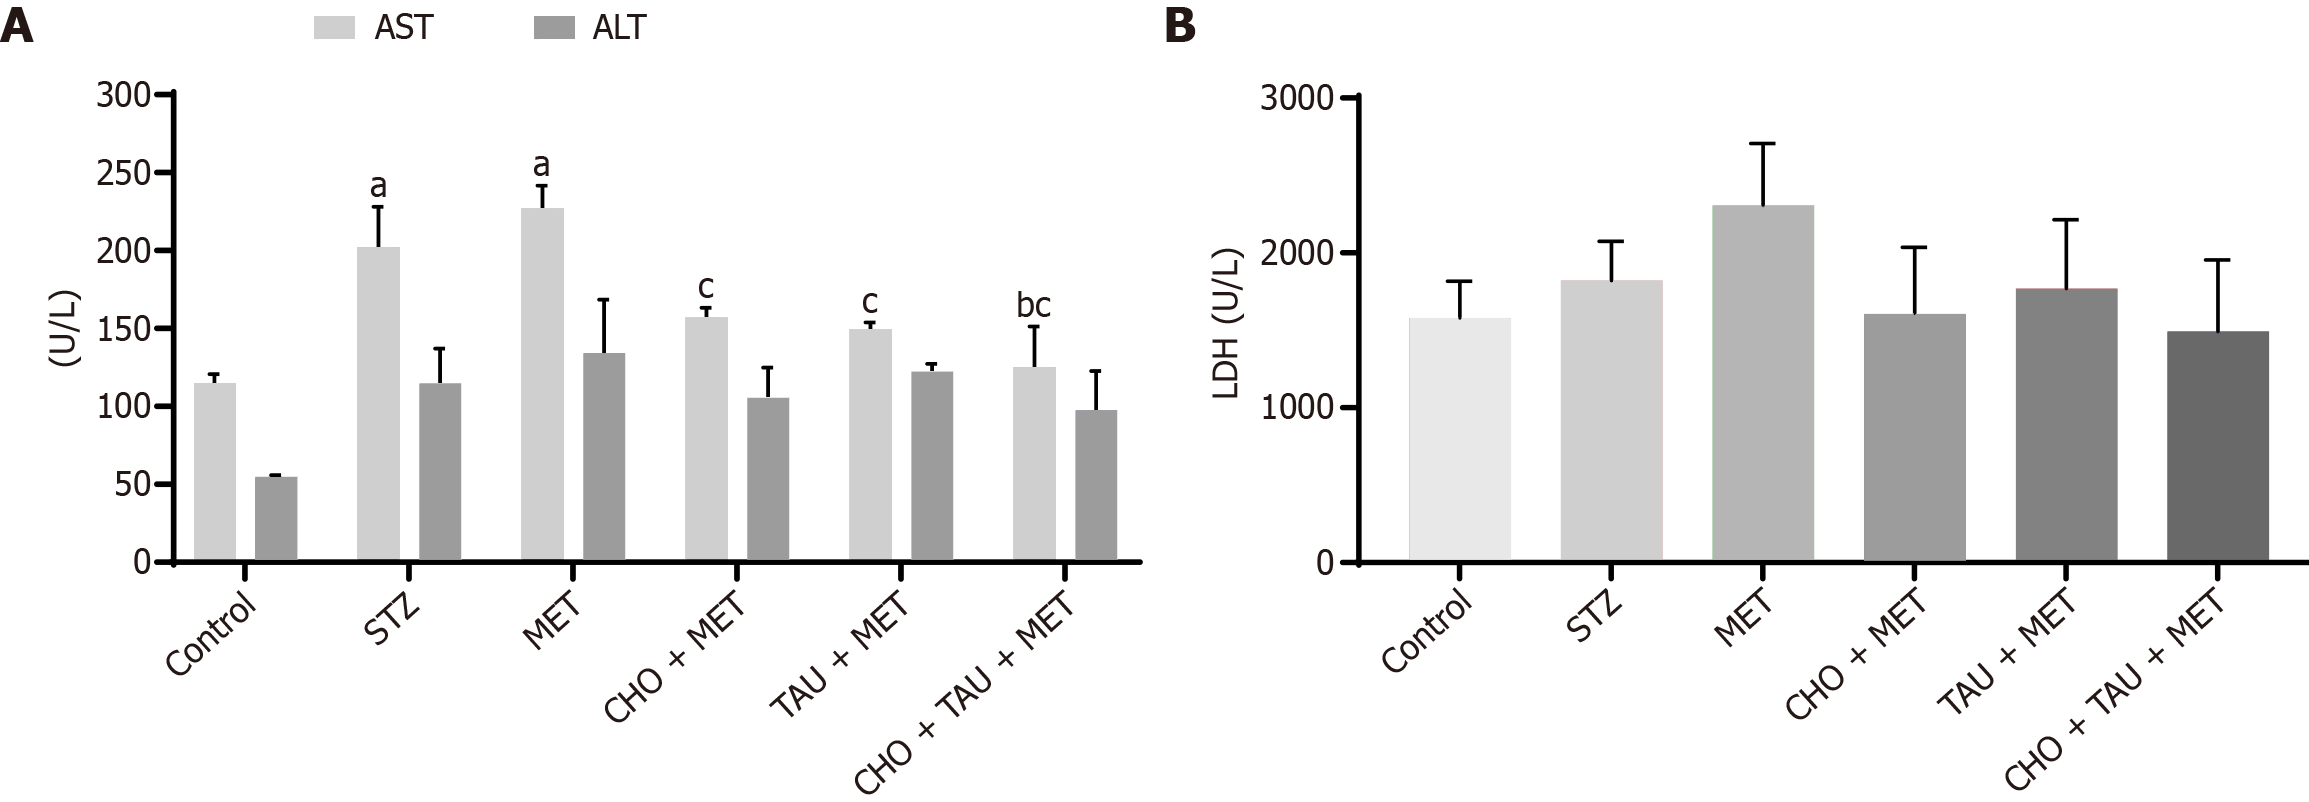
Figure 4 Measurement of liver enzymes.
A and B: Serum aminotransferase enzymes (aspartate aminotransferase, alanine aminotransferase; A) and Serum lactate dehydrogenase (LDH; B) levels in the control group and other experimental groups. The data, presented as means ± SE (n = 6), indicate significant differences at P < 0.05. STZ: Streptozotocin; MET: Metformin; CHO: Cholecalciferol; TAU: Taurine; TGs: Triglycerides; LDH: Lactate dehydrogenase; AST: Aspartate aminotransferase; ALT: Alanine aminotransferase. aSignificance compared to the control group. bSignificance compared to the Streptozotocin diabetic group. cSignificance compared to the metformin-treated group.
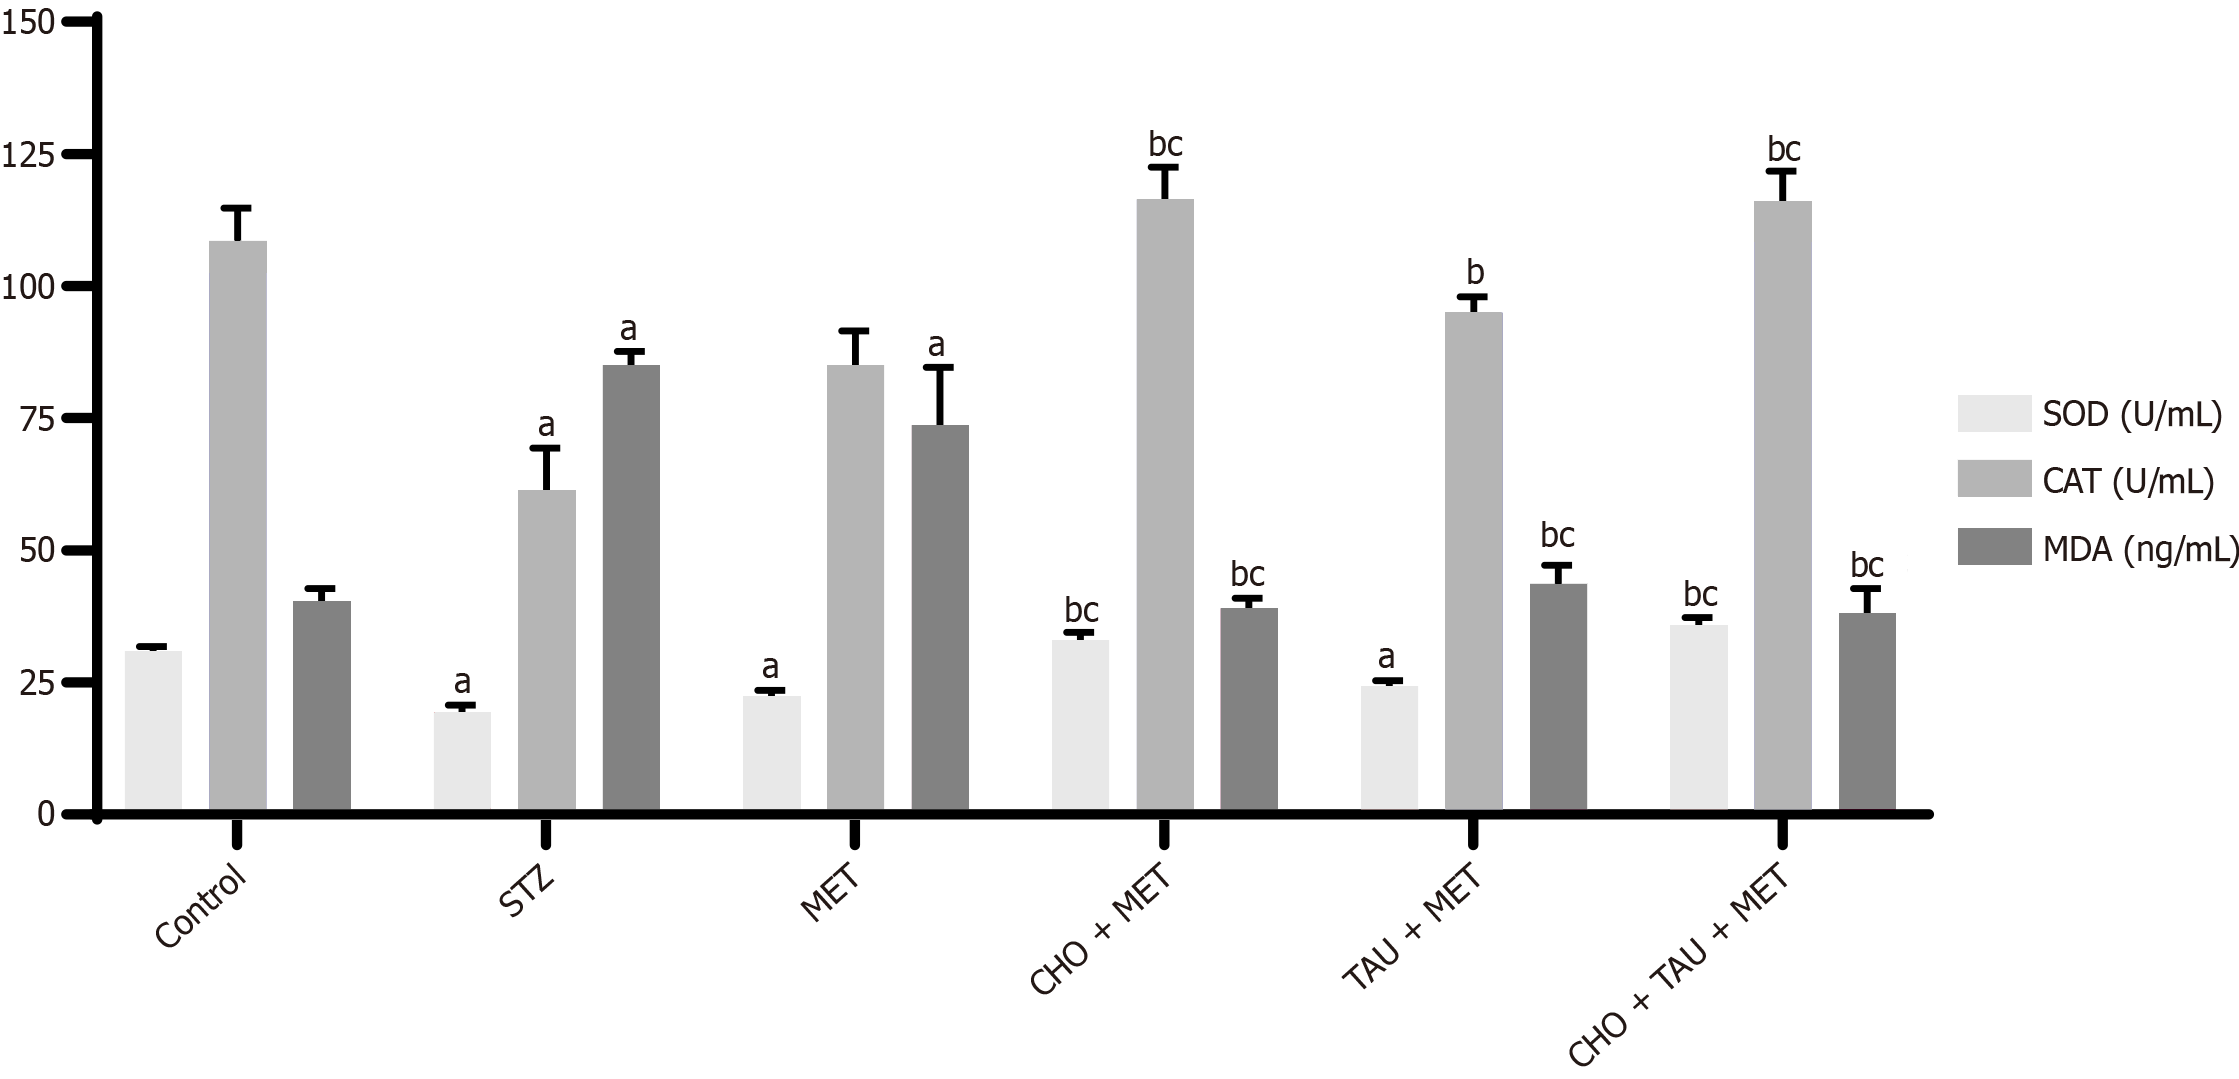
Figure 5 Measurement of antioxidant biomarkers in the control group and other experimental animals.
The data, presented as means ± SE (n = 6), indicate significant differences at P < 0.05. STZ: Streptozotocin; MET: Metformin; CHO: Cholecalciferol; TAU: Taurine; SOD: Superoxide dismutase; CAT: Catalase; MDA: Malondialdehyde. aSignificance compared to the control group. bSignificance compared to the Streptozotocin diabetic group. cSignificance compared to the metformin-treated group.
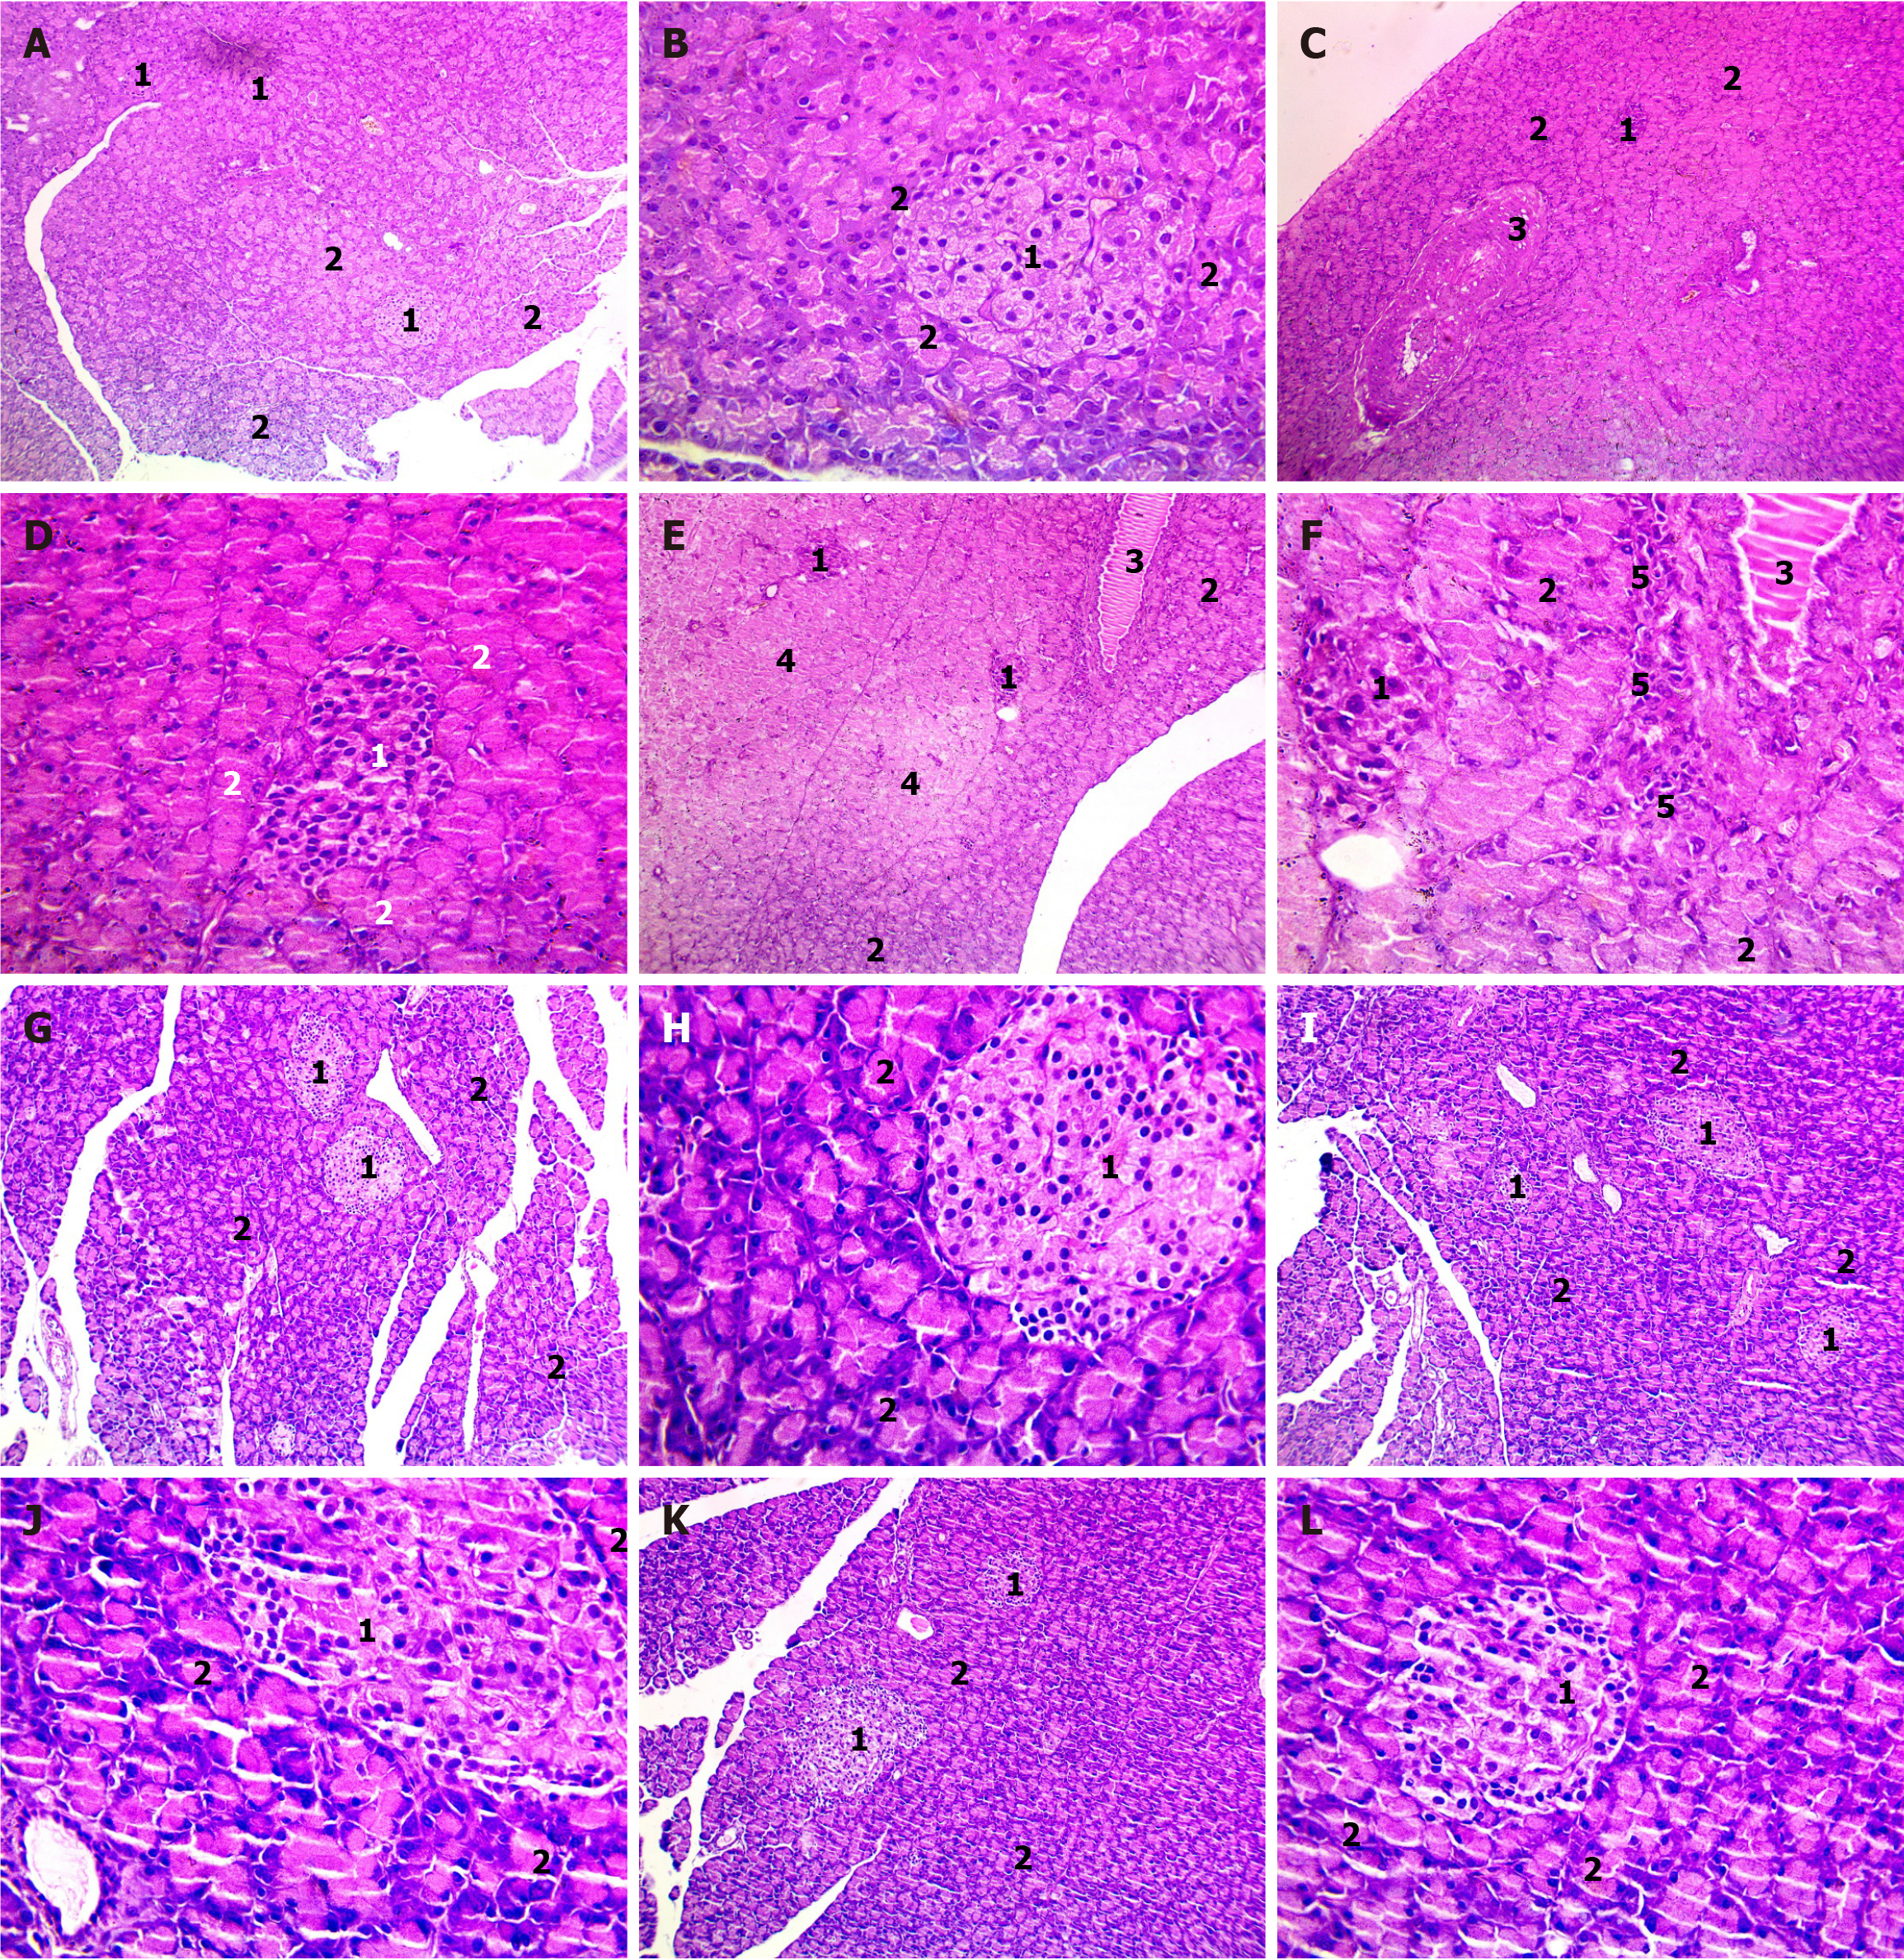
Figure 6 Examination of histopathological changes in rat pancreatic sections using HandE staining.
A-I: Photomicrographs of different magnifications showing pancreatic sections of control group (A and B), Streptozotocin diabetic group (C and D), metformin (MET)-treated group (E and F), cholecalciferol (CHO) + MET-treated group (G and H), taurine (TAU) + MET-treated group (I and J), and TAU + CHO + MET-treated group (K and L). 1Normal structure of the islet of Langerhans. 2Normal structure of acinar cells. 3Normal structure of a thickened blood vessel. 4Normal structure of areas of degenerative changes in acinar cells. 5Normal structure of perivascular inflammation.
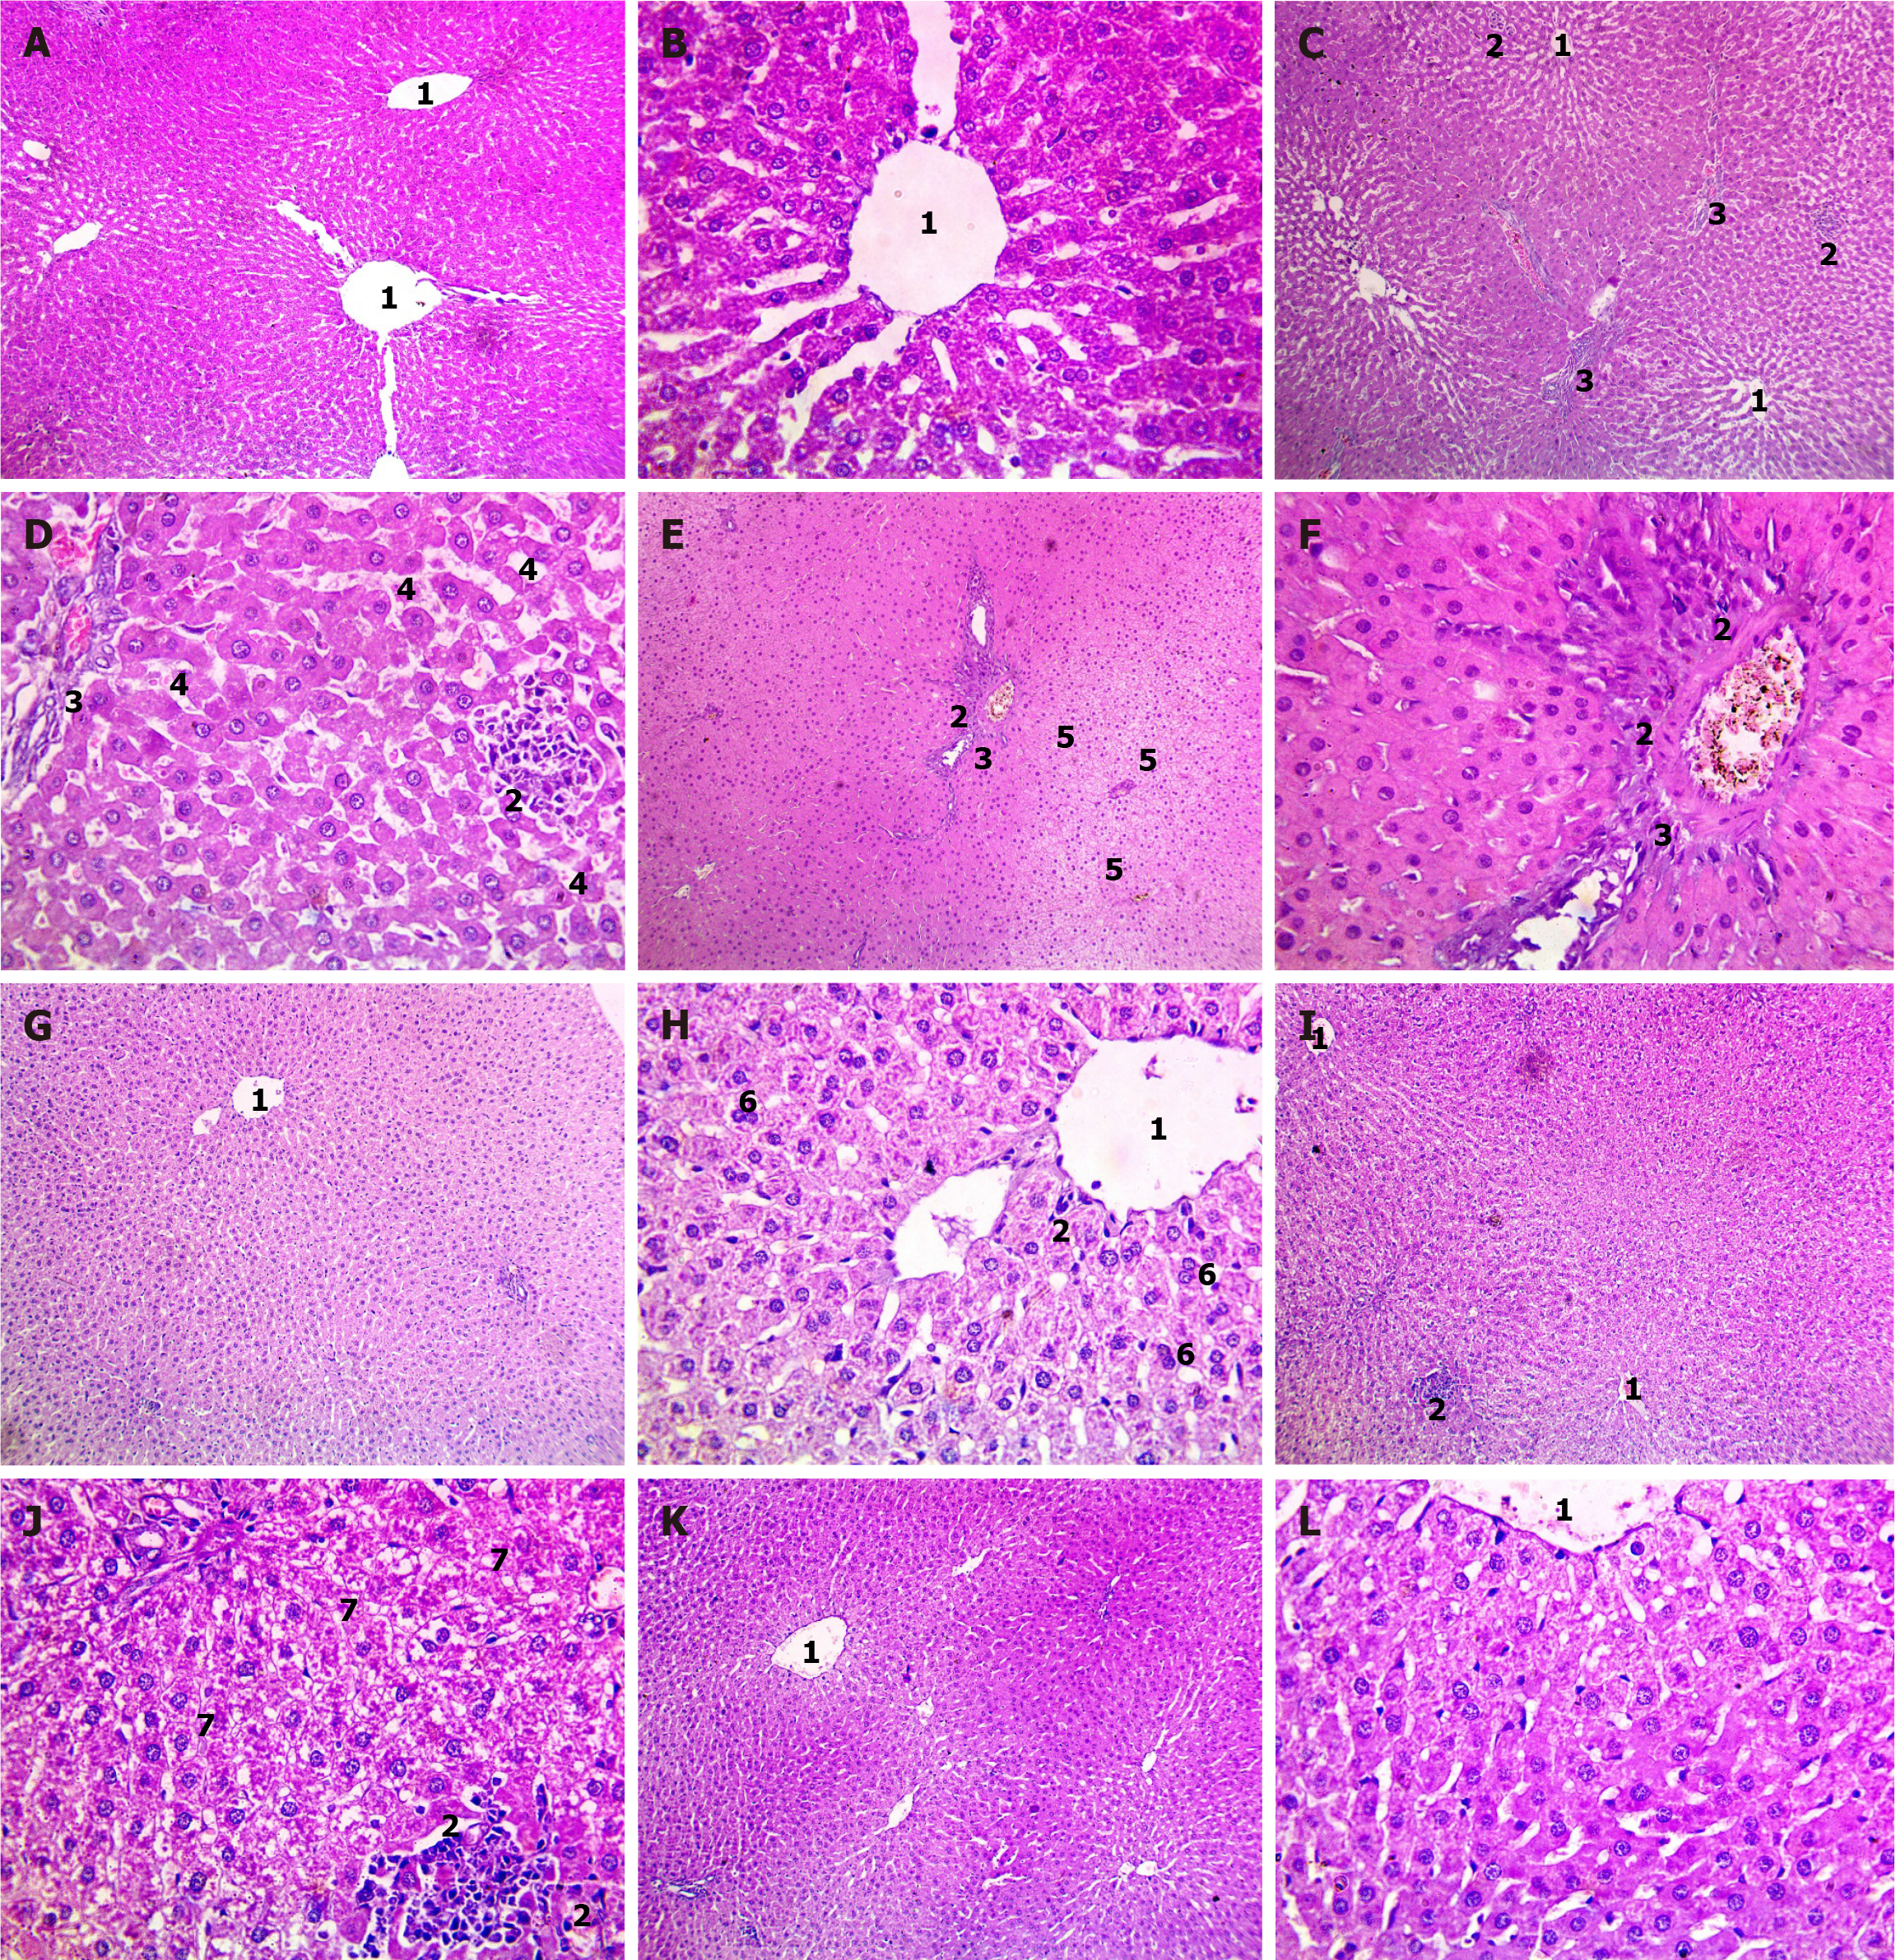
Figure 7 Examination of histopathological changes in rat liver sections using HE staining.
Photomicrographs of different magnifications showing pancreatic sections of the control group (A and B), Streptozotocin diabetic group (C and D), metformin (MET)-treated group (E and F), cholecalciferol (CHO) + MET-treated group (G and H), taurine (TAU) + MET-treated group (I and J), and TAU + CHO + MET-treated group (K and L). 1The central vein. 2Lobular inflammation. 3Fibrous portal expansion. 4Sinusoidal dilatation. 5Hydropic degeneration. 6Preserved hepatocyte arrangement with binucleation of some hepatocytes. 7Hydropic degeneration of hepatocytes with areas of necrosis indicated by lost nuclei.
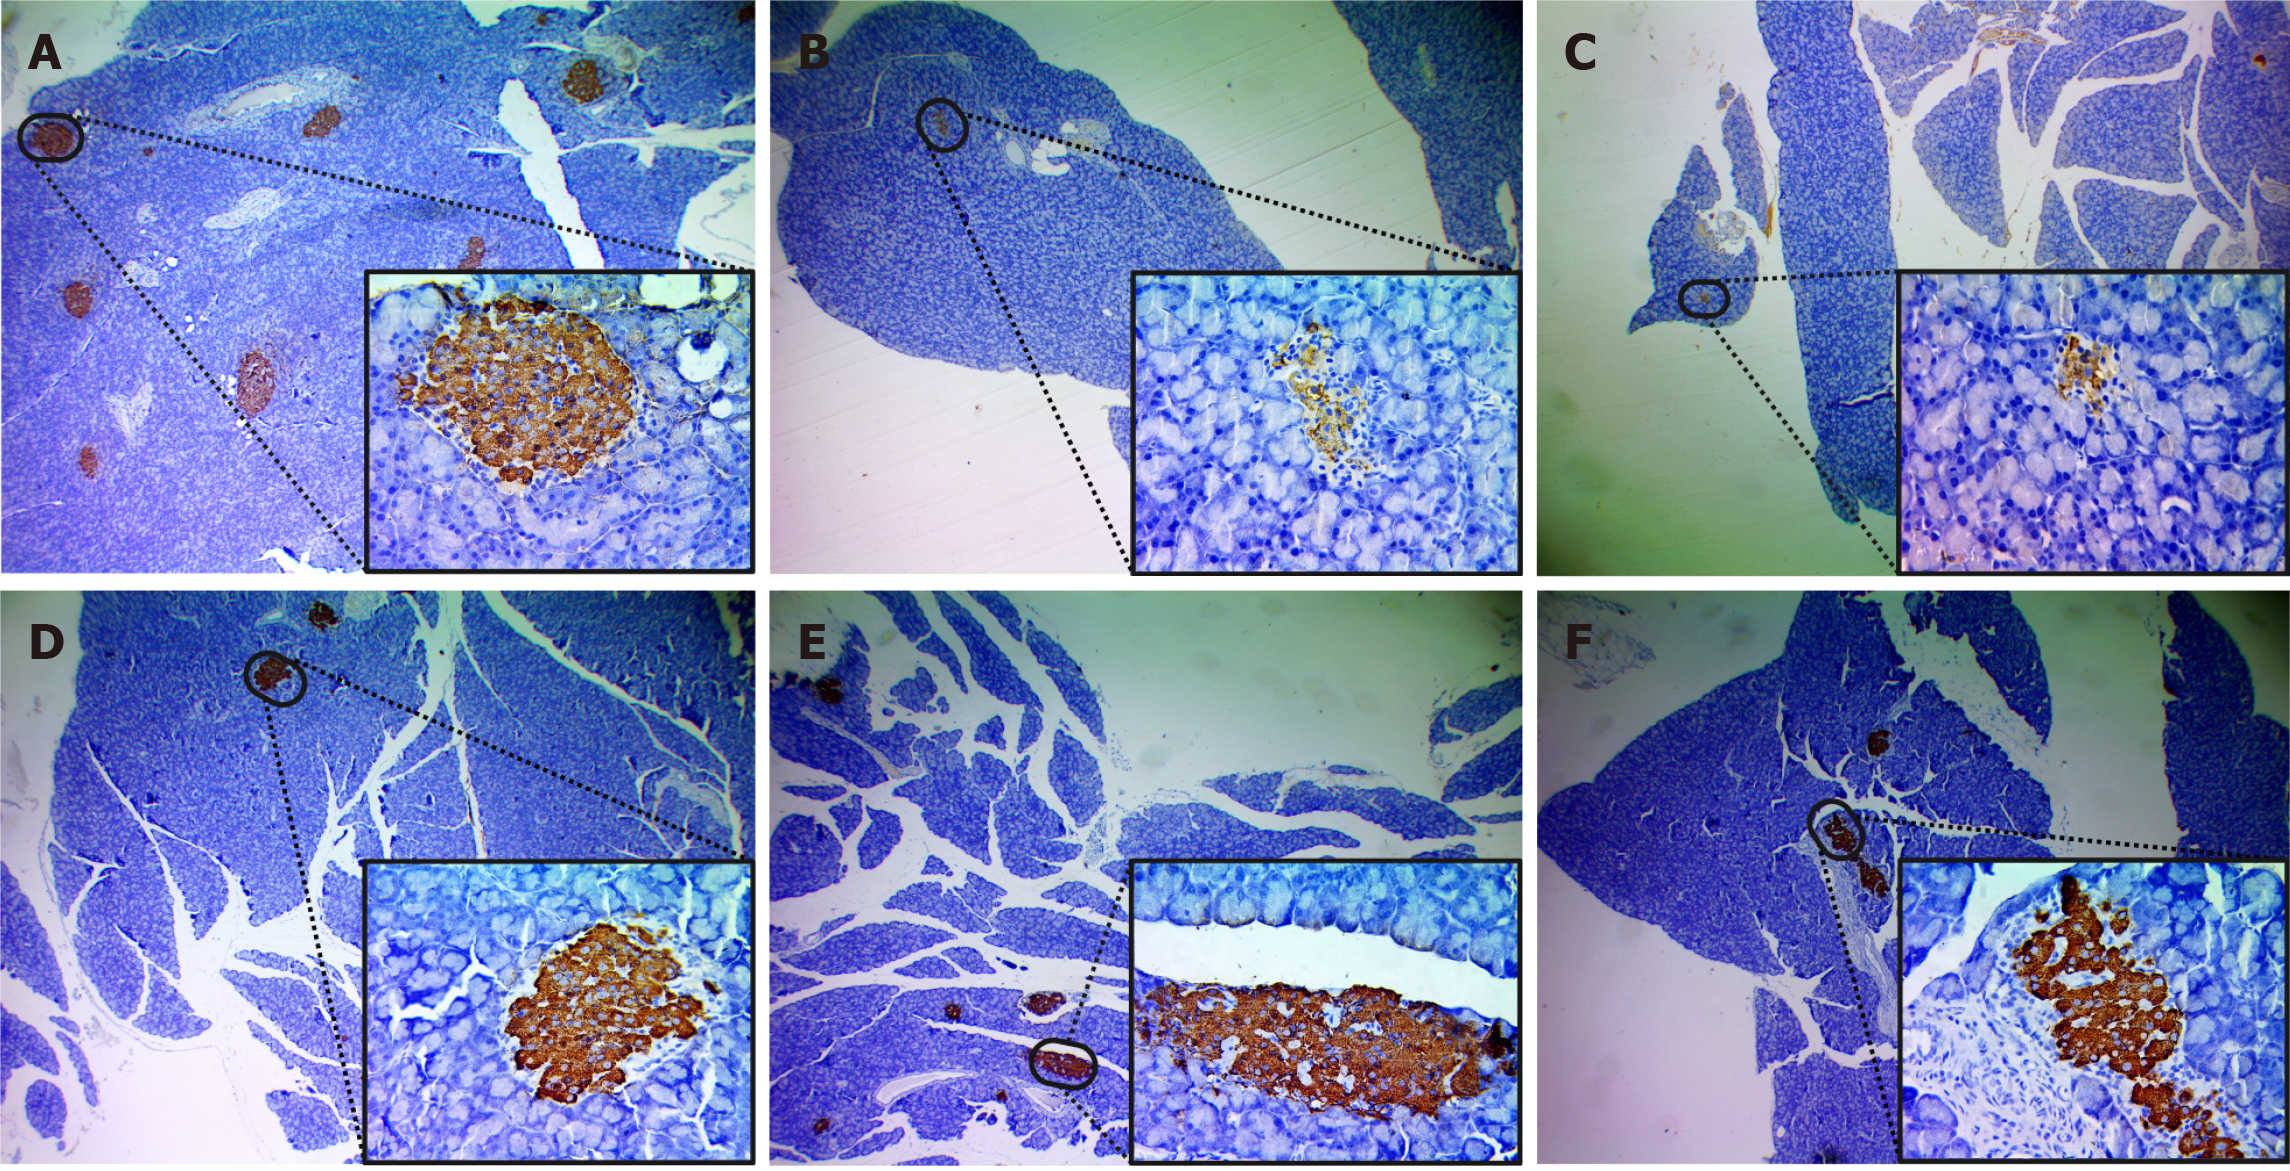
Figure 8 Photomicrographs from immunohistochemistry assays of insulin staining for the pancreas in the six study groups at a Magnification power of × 400.
A: Control group; B: Streptozotocin group; C: metformin (MET)-treated group; D: Cholecalciferol (CHO)+ MET- treated group; E: Taurine (TAU)+ MET- treated group; F: CHO + TAU + MET-treated group. The brown color indicates positive insulin staining (diaminobenzidine).
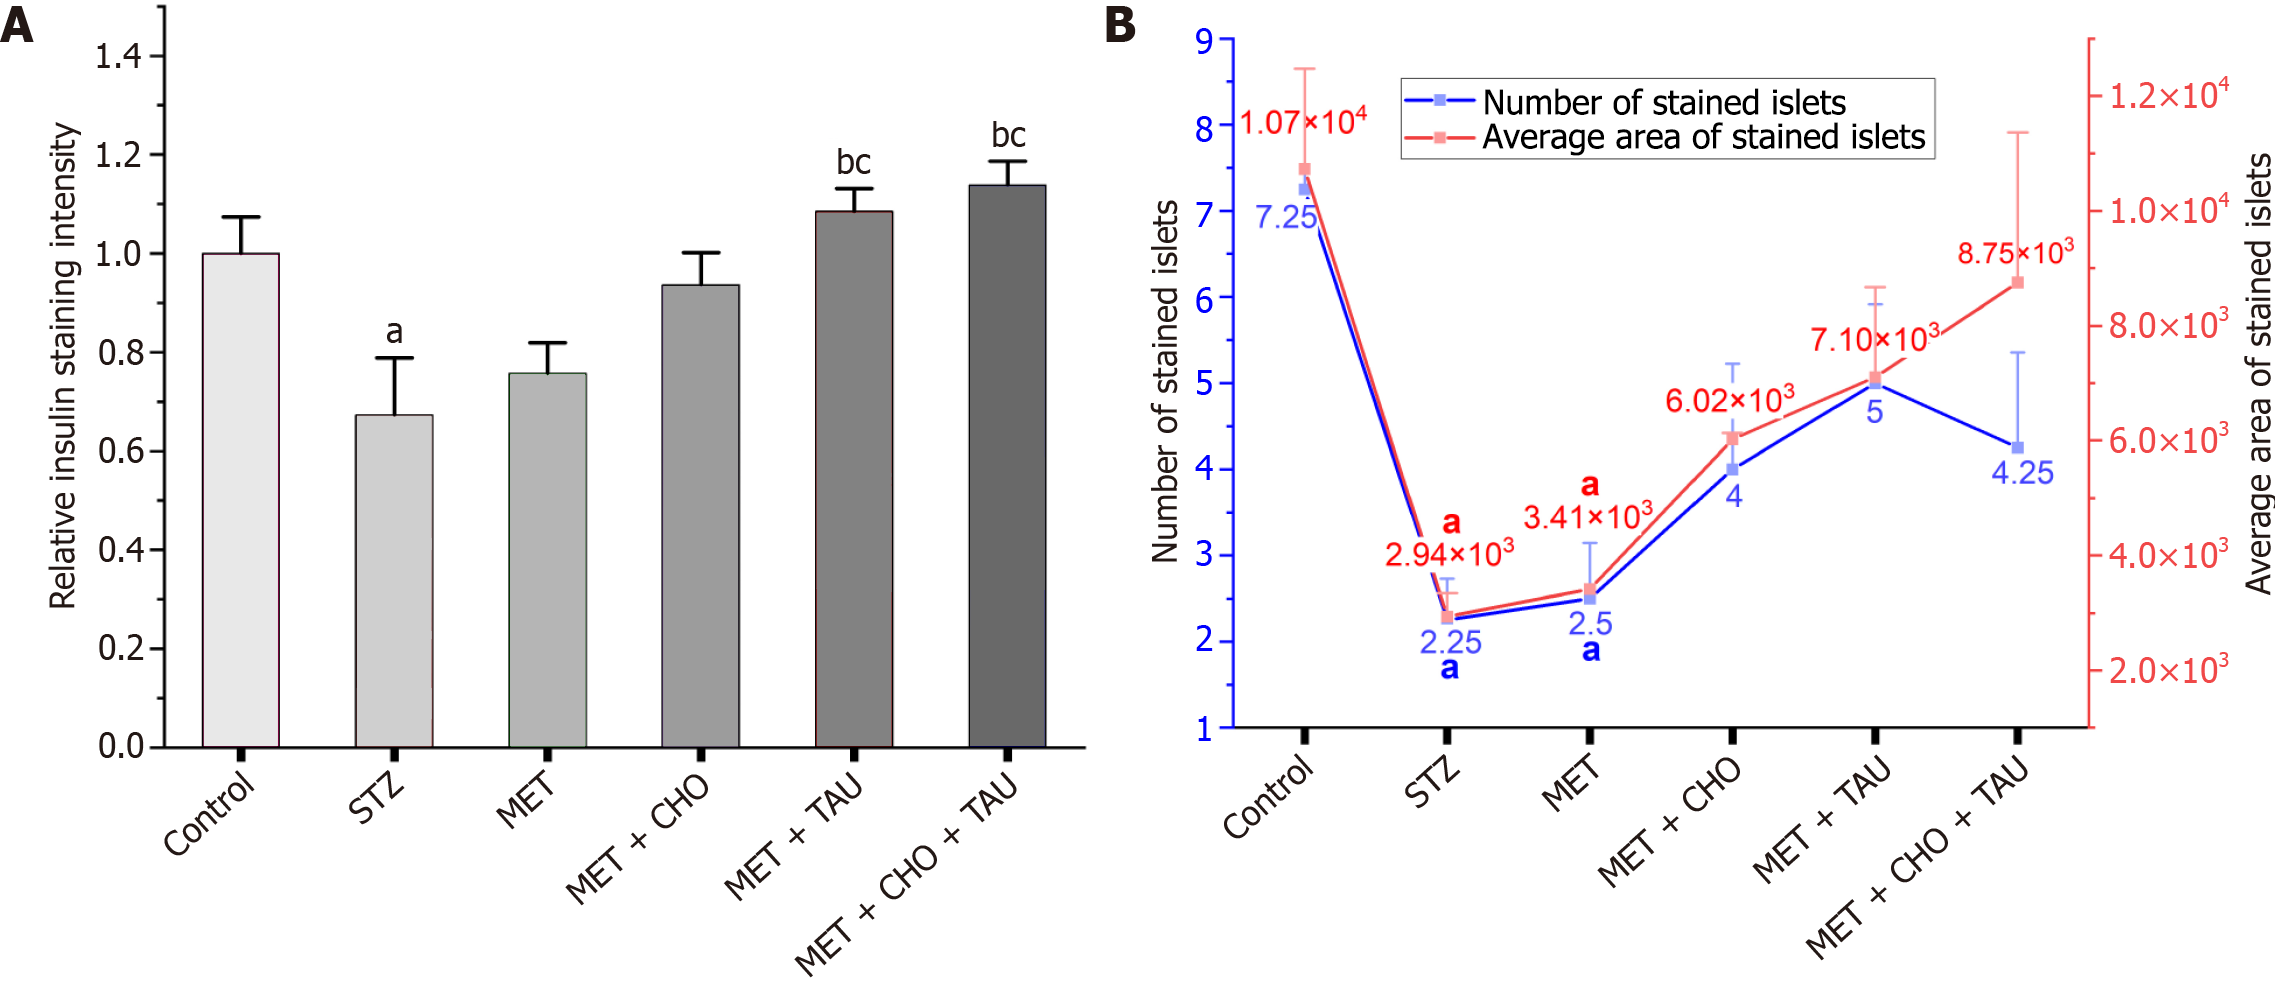
Figure 9 Analysis of immunohistochemical results.
A: The relative islet staining intensity of stained islets; B: The number and area of the stained islets. The data, presented as means ± SE (n = 6), indicate significant differences at P < 0.05. STZ: Streptozotocin; MET: Metformin; CHO: Cholecalciferol; aSignificance compared to the control group. bSignificance compared to the Streptozotocin diabetic group. cSignificance compared to the metformin-treated group.
- Citation: Attia MS, Ayman F, Attia MS, Yahya G, Zahra MH, Khalil MMI, Diab AAA. Mitigating diabetes-related complications: Empowering metformin with cholecalciferol and taurine supplementation in type 2 diabetic rats. World J Diabetes 2024; 15(8): 1778-1792
- URL: https://www.wjgnet.com/1948-9358/full/v15/i8/1778.htm
- DOI: https://dx.doi.org/10.4239/wjd.v15.i8.1778


