Copyright
©The Author(s) 2023.
World J Diabetes. Dec 15, 2023; 14(12): 1766-1783
Published online Dec 15, 2023. doi: 10.4239/wjd.v14.i12.1766
Published online Dec 15, 2023. doi: 10.4239/wjd.v14.i12.1766
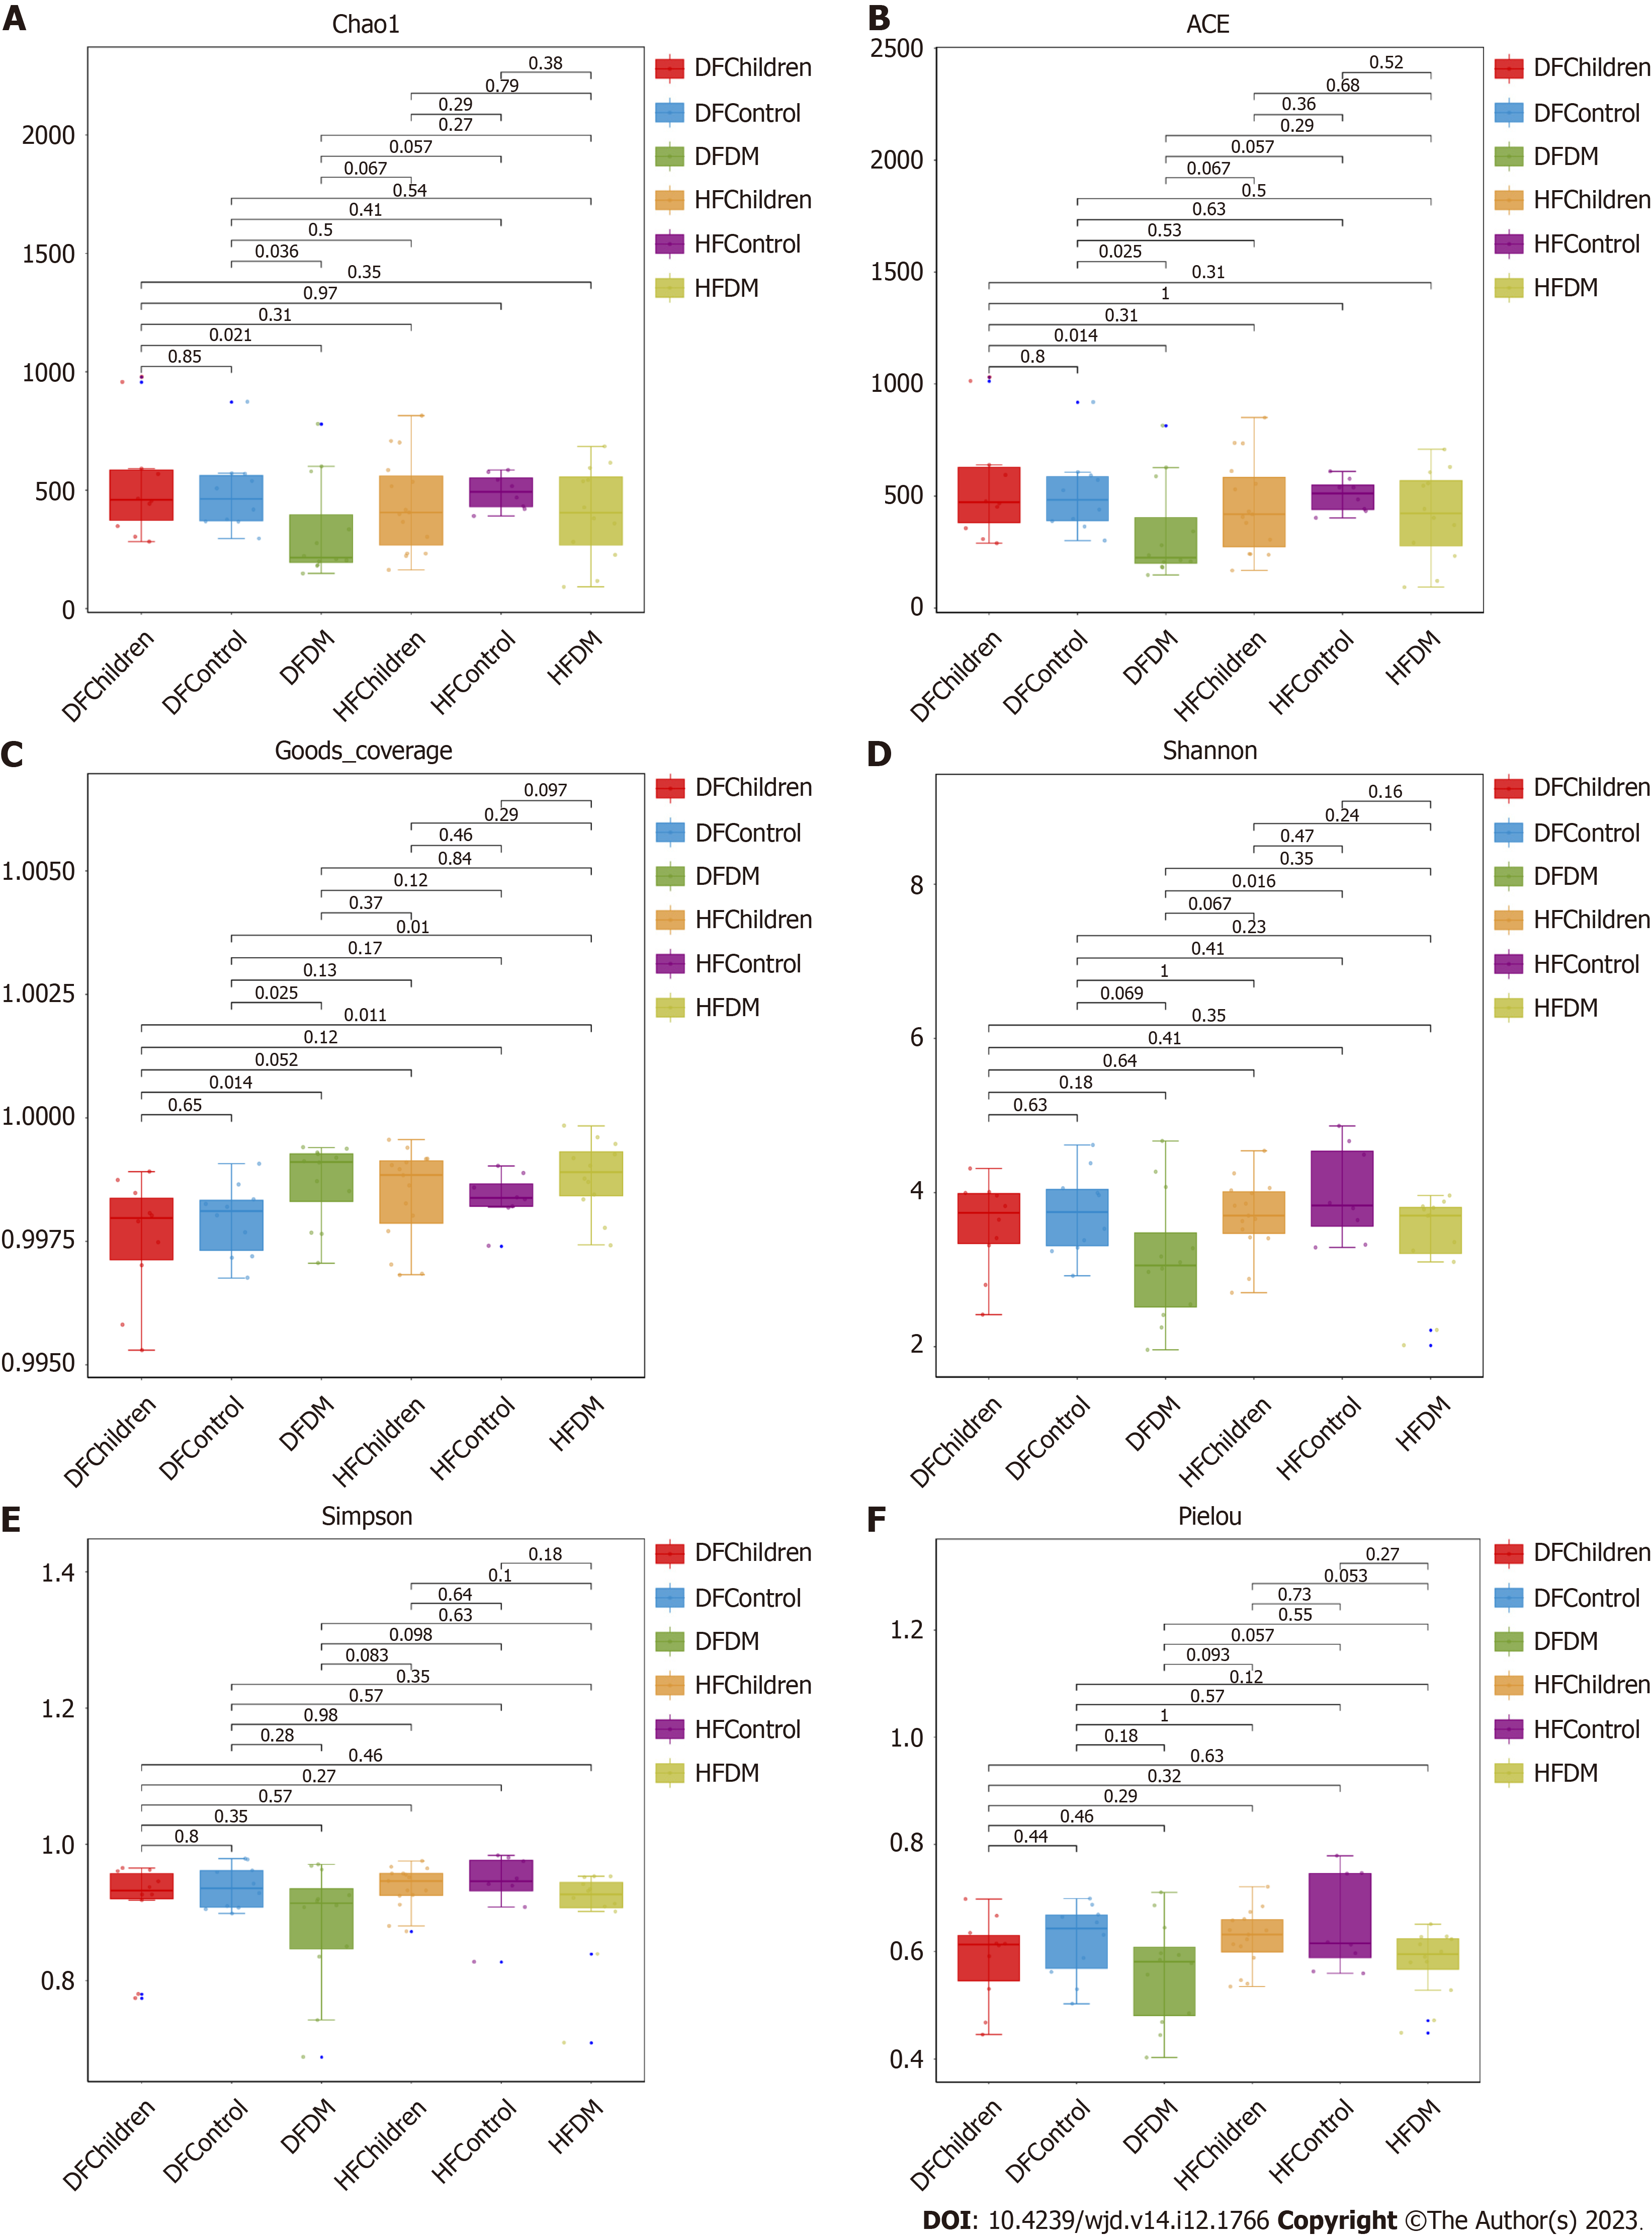
Figure 1 Analysis of alpha diversity in the gut microbiota.
We evaluated and compared six indices of alpha diversity. A: Chao1 index; B: Abundance-based coverage estimator index; C: Good’s coverage index; D: Shannon index; E: Simpson index; F: Pielou index. There were no significant differences observed in the population groups among the six indices (P > 0.05). ACE: Abundance-based coverage estimator; DFChildren: Healthy children from the Dai population; DFControl: Healthy adults from the Dai population; DFDM: Adult type 2 diabetes mellitus patients from the Dai population; HFChildren: Healthy children from the Han population; HFControl: Healthy adults from the Han population; HFDM: Adult type 2 diabetes mellitus patients from the Han population.
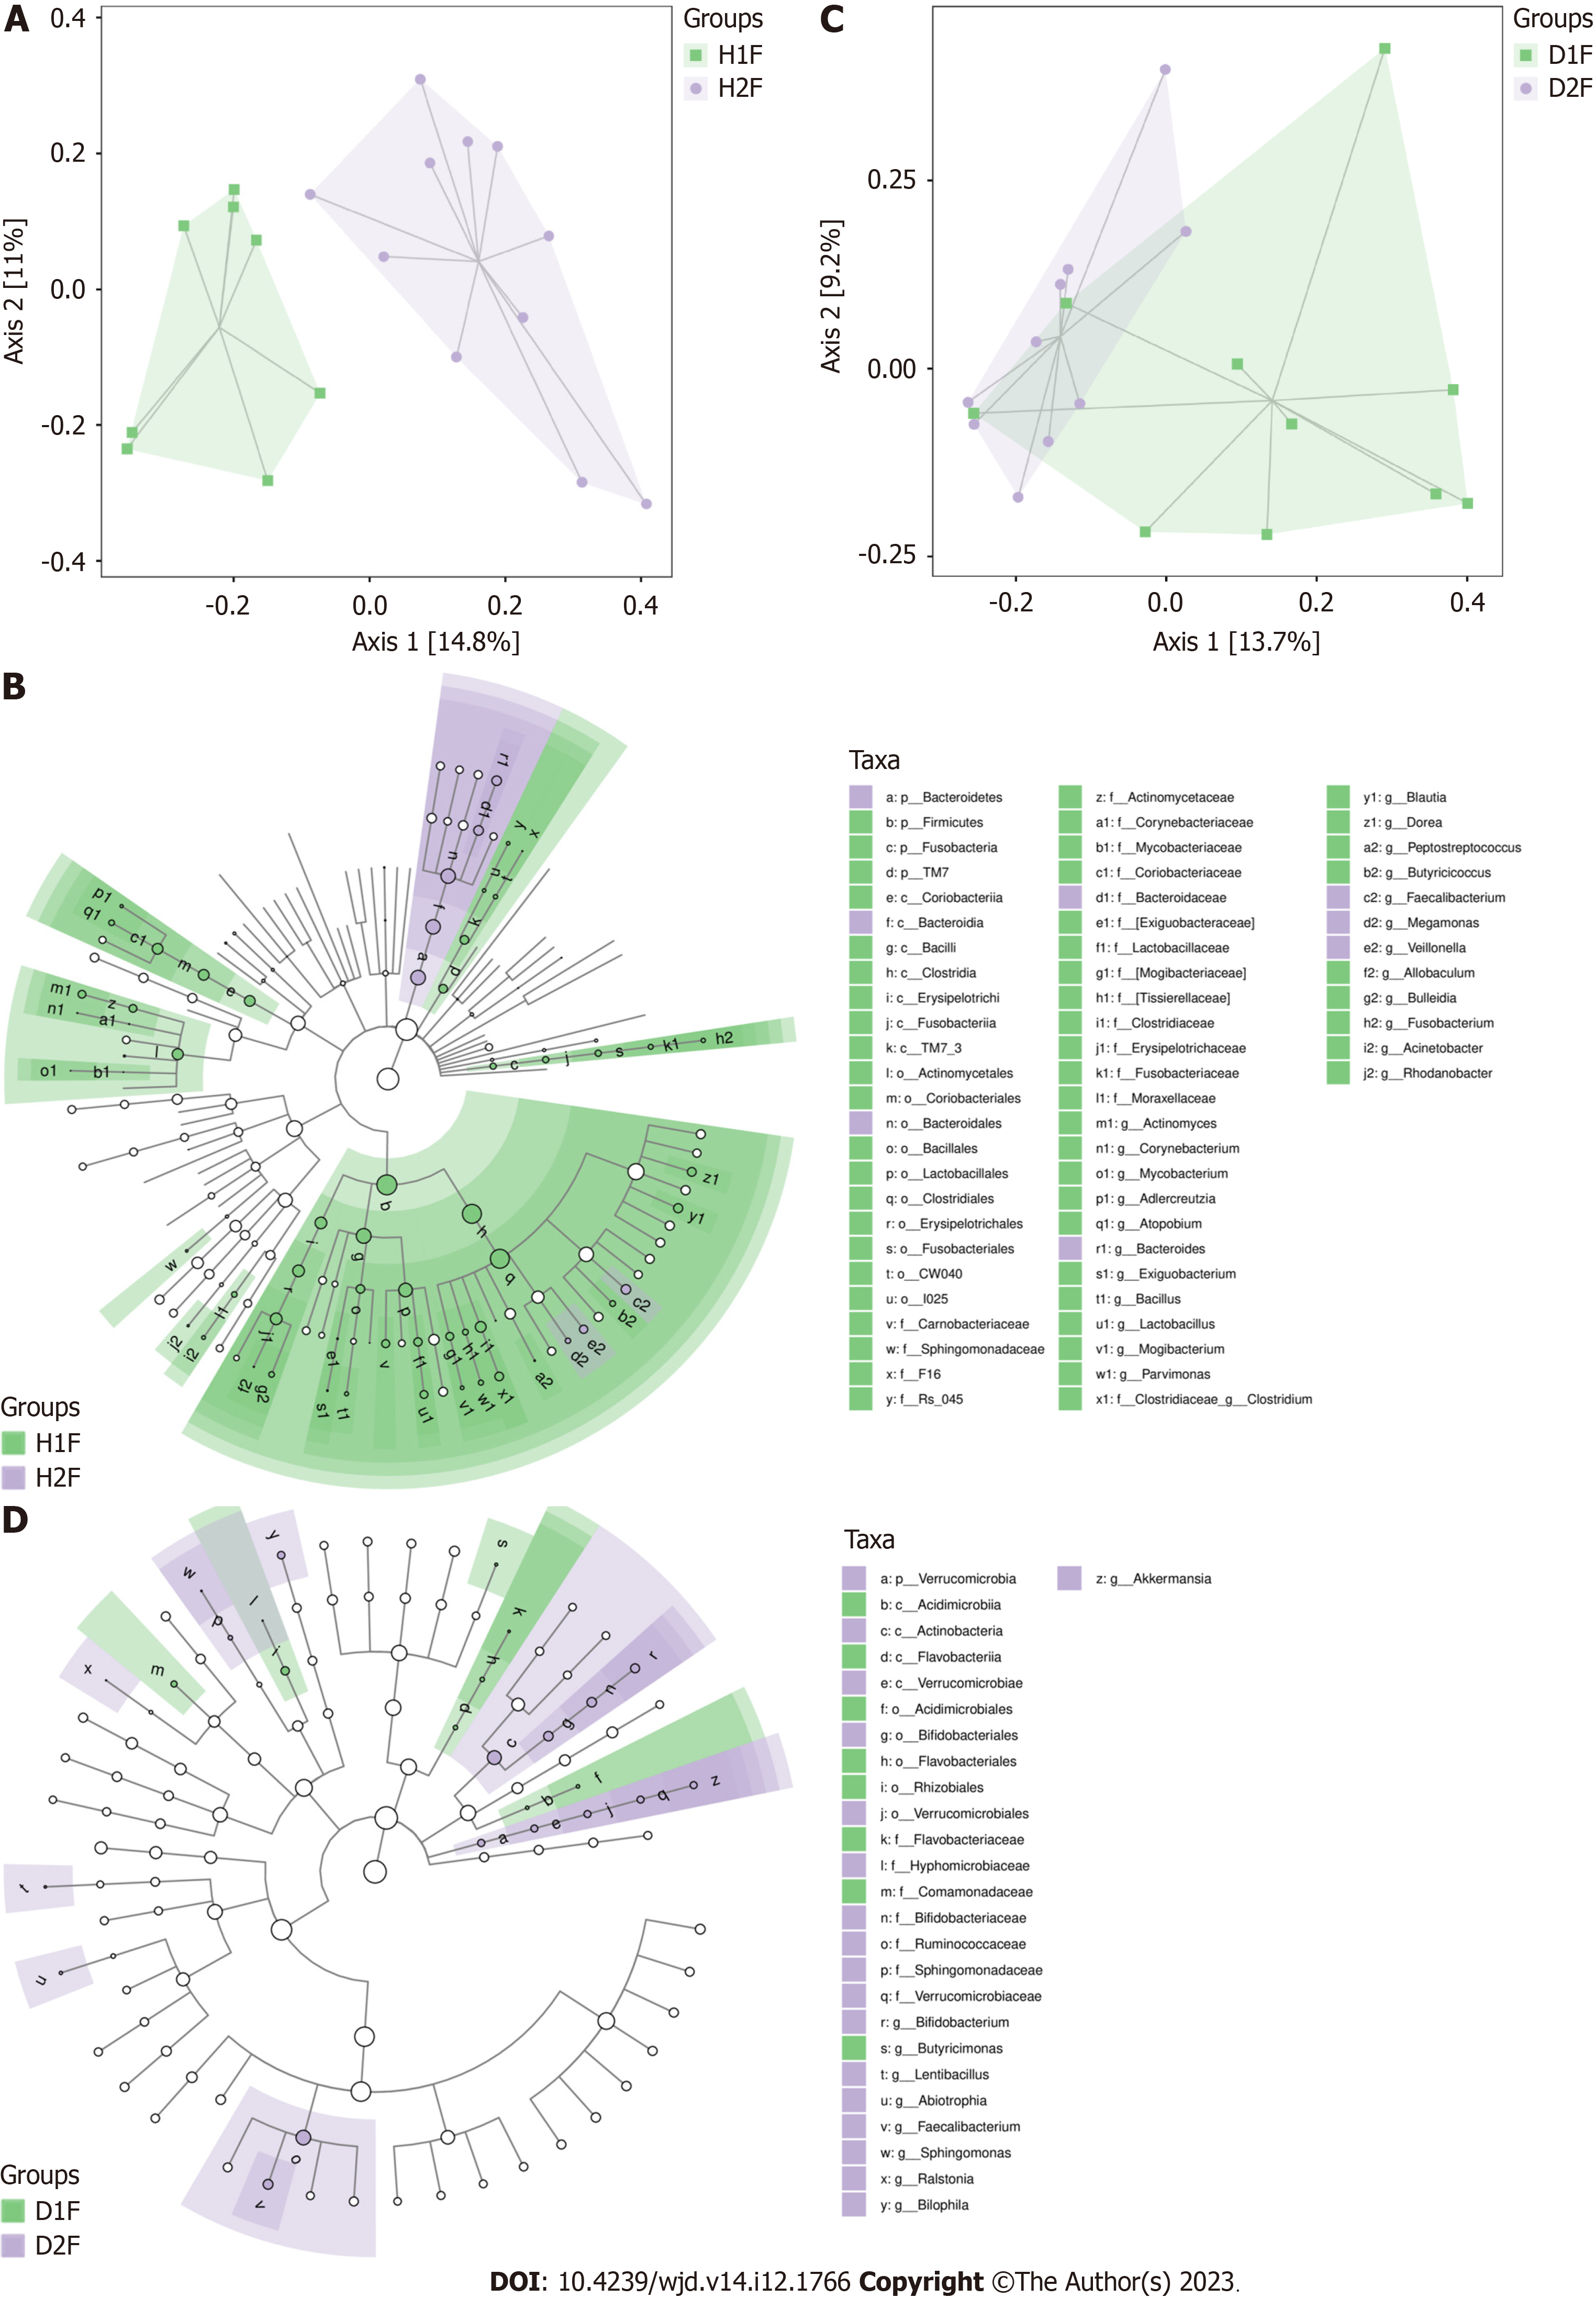
Figure 2 Comparison of gut microbiota between healthy children and healthy adults in the Han and Dai populations.
A: Clustering of gut microbiota composition between the healthy children and healthy adults in the Han population. There was a significant difference and clear distinction between the groups (P < 0.05); B: Gut microbiota composition analysis between healthy children and healthy adults in the Han population; C: Clustering of gut microbiota composition between healthy children and adults in the Dai population. There was no significant difference between the groups (P > 0.05); D: Gut microbiota composition analysis between healthy children and healthy adults in the Dai population. H1F: Healthy adults in the Han population; H2F: Healthy children in the Han population; D1F: Healthy adults in the Dai population; D2F: Healthy children in the Dai population.
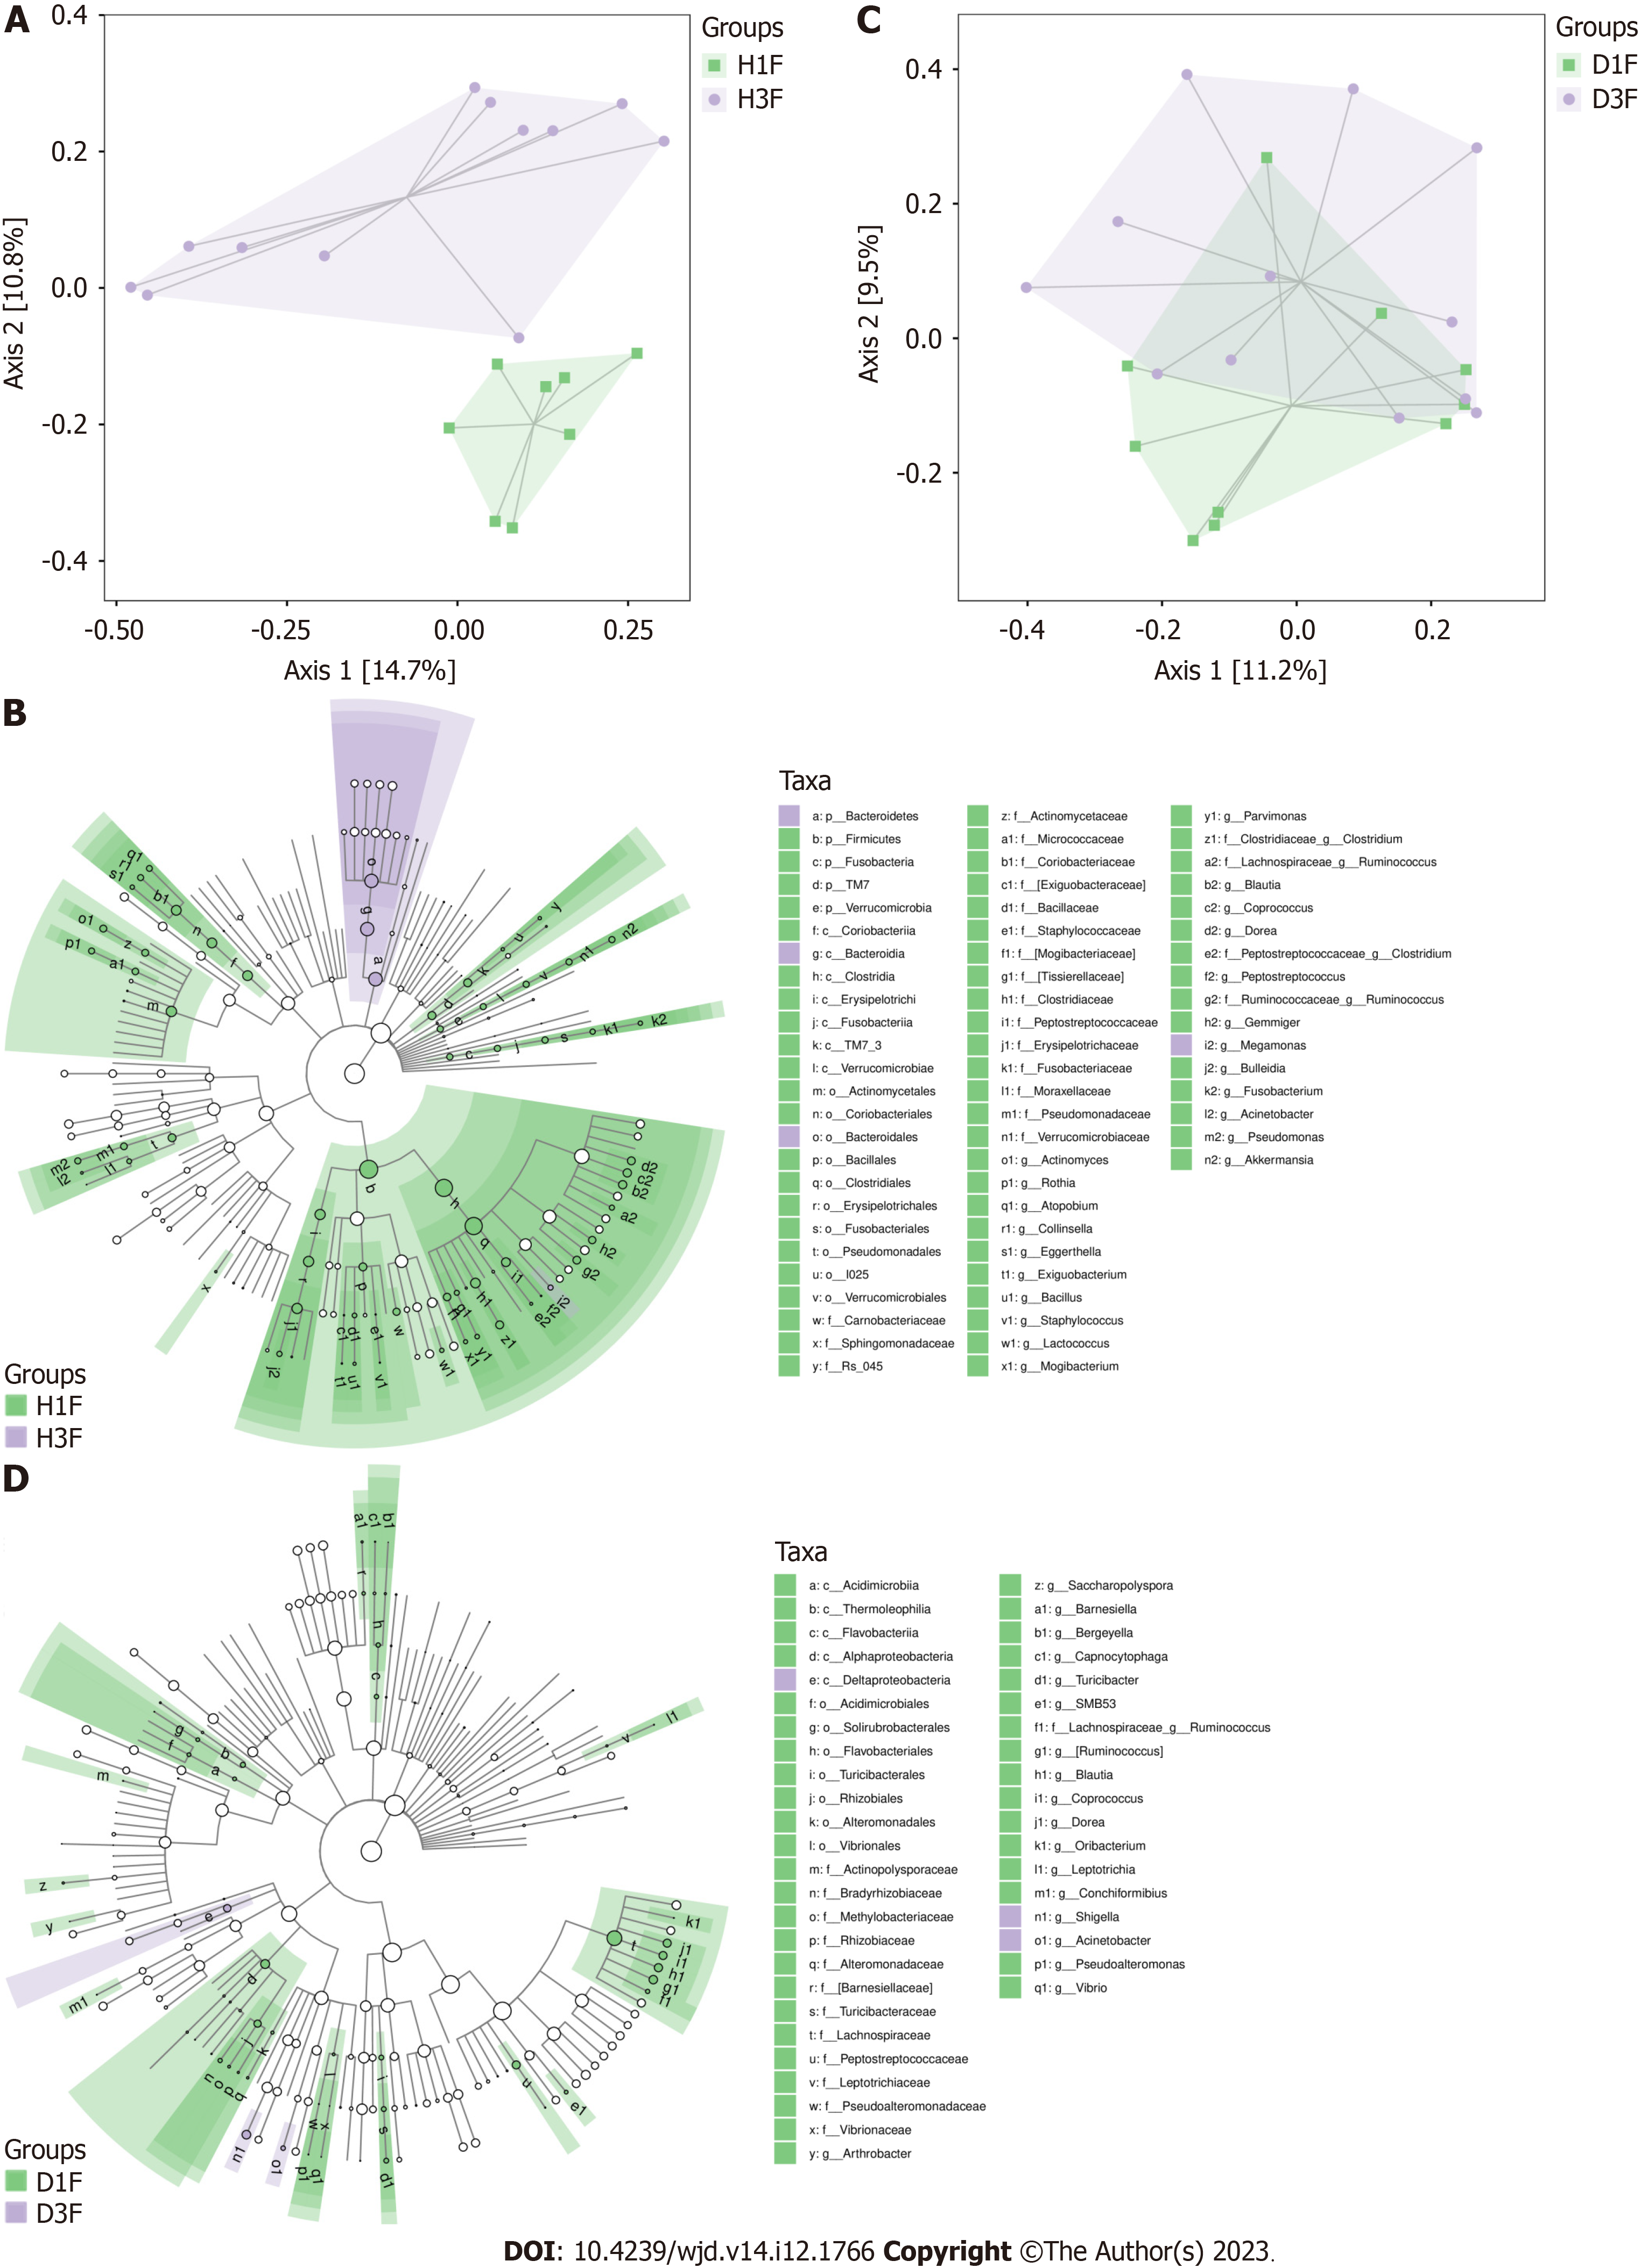
Figure 3 Comparison of gut microbiota between healthy adults and type 2 diabetes mellitus patients in the Han and Dai populations.
A: Clustering of gut microbiota composition between the healthy adults and type 2 diabetes mellitus (T2DM) patients in the Han population. There was a significant difference between the two groups (P < 0.05); B: Gut microbiota composition analysis between the healthy adults and T2DM patients in the Han population. There was an increased abundance of Bacteroidetes, Bacteroidales, Megamonas and Bacteroidia in the T2DM patients (P < 0.05); C: Clustering of gut microbiota composition between the healthy adults and T2DM patients in the Dai population. There were no significant differences between two groups (P > 0.05); D: Gut microbiota composition analysis between the healthy adults and T2DM patients in the Dai population. There was an increased abundance of Deltaproteobacteria, Shigella, and Acinetobacter (P < 0.05). D1F: Healthy adults in the Dai population; D3F: Type 2 diabetes mellitus patients in the Dai population; H1F: Healthy adults in the Han population; H3F: Type 2 diabetes mellitus patients in the Han population.
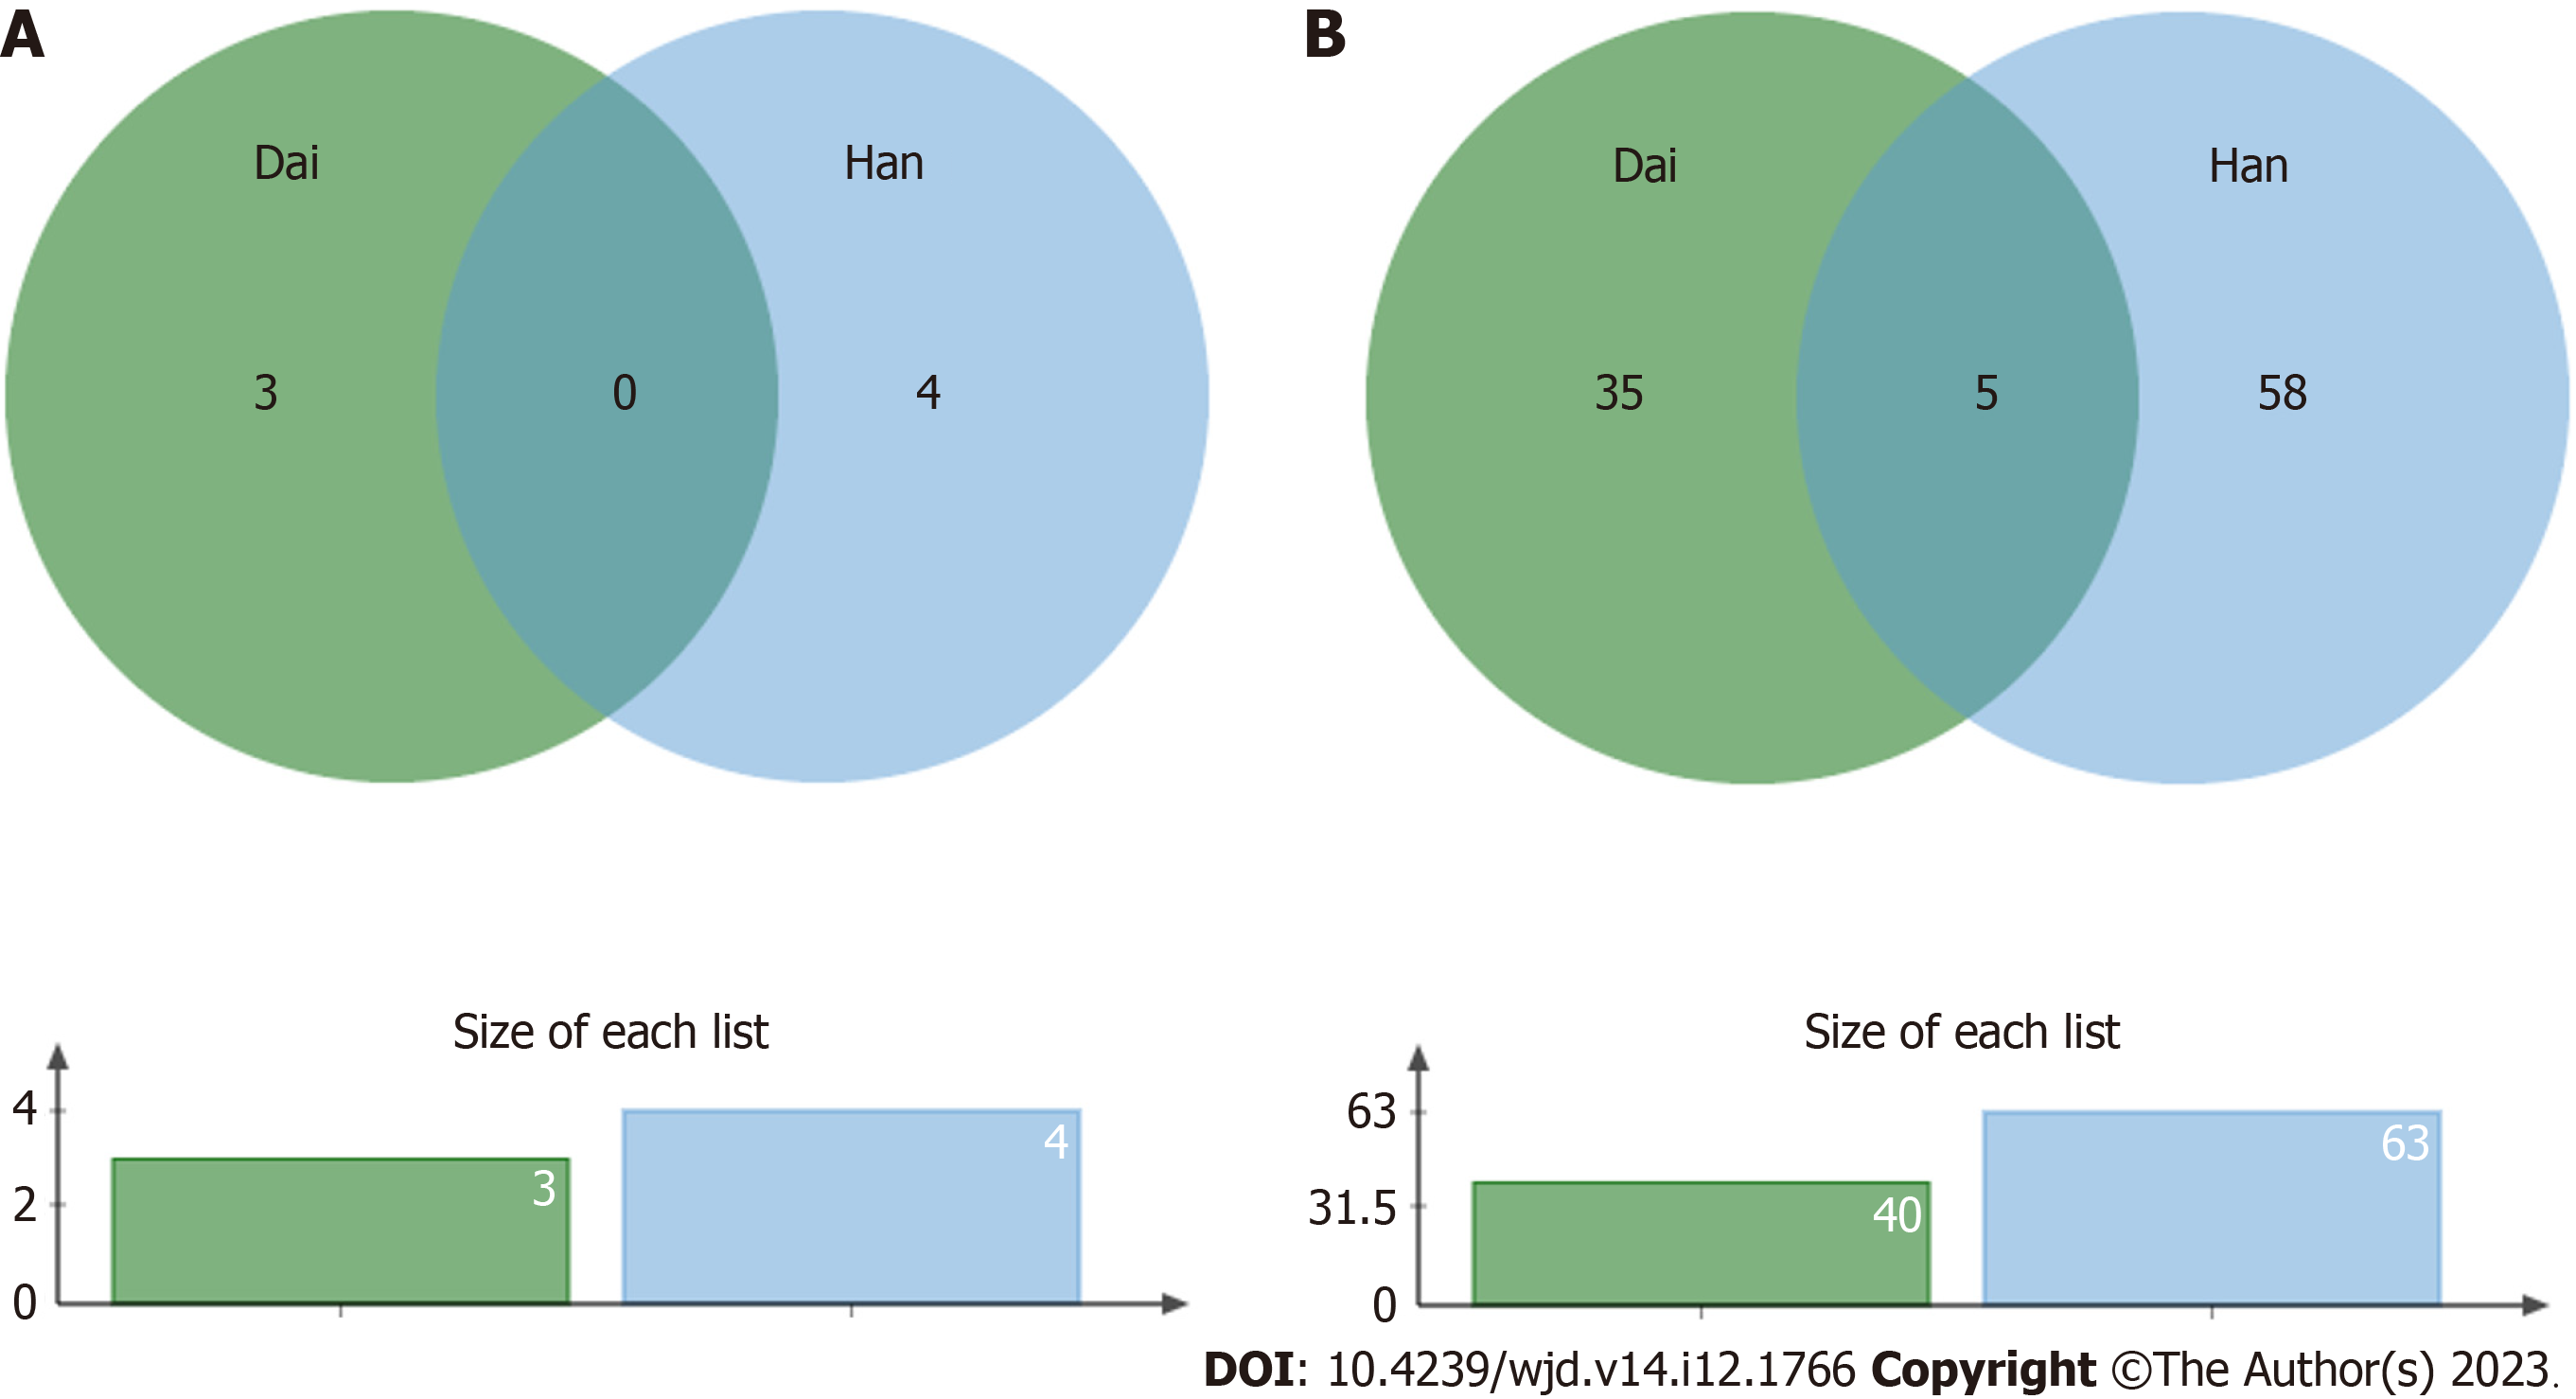
Figure 4 Venn diagram of the unique and shared bacteria in type 2 diabetes mellitus patients in the Han and Dai populations.
A: Bacteria with increased abundance; B: Bacteria with decreased abundance. The five bacteria that were decreased in both the Han and Dai populations were Dorea, Peptostreptococcaceae, Blautia, Ruminococcus, and Coprococcus.
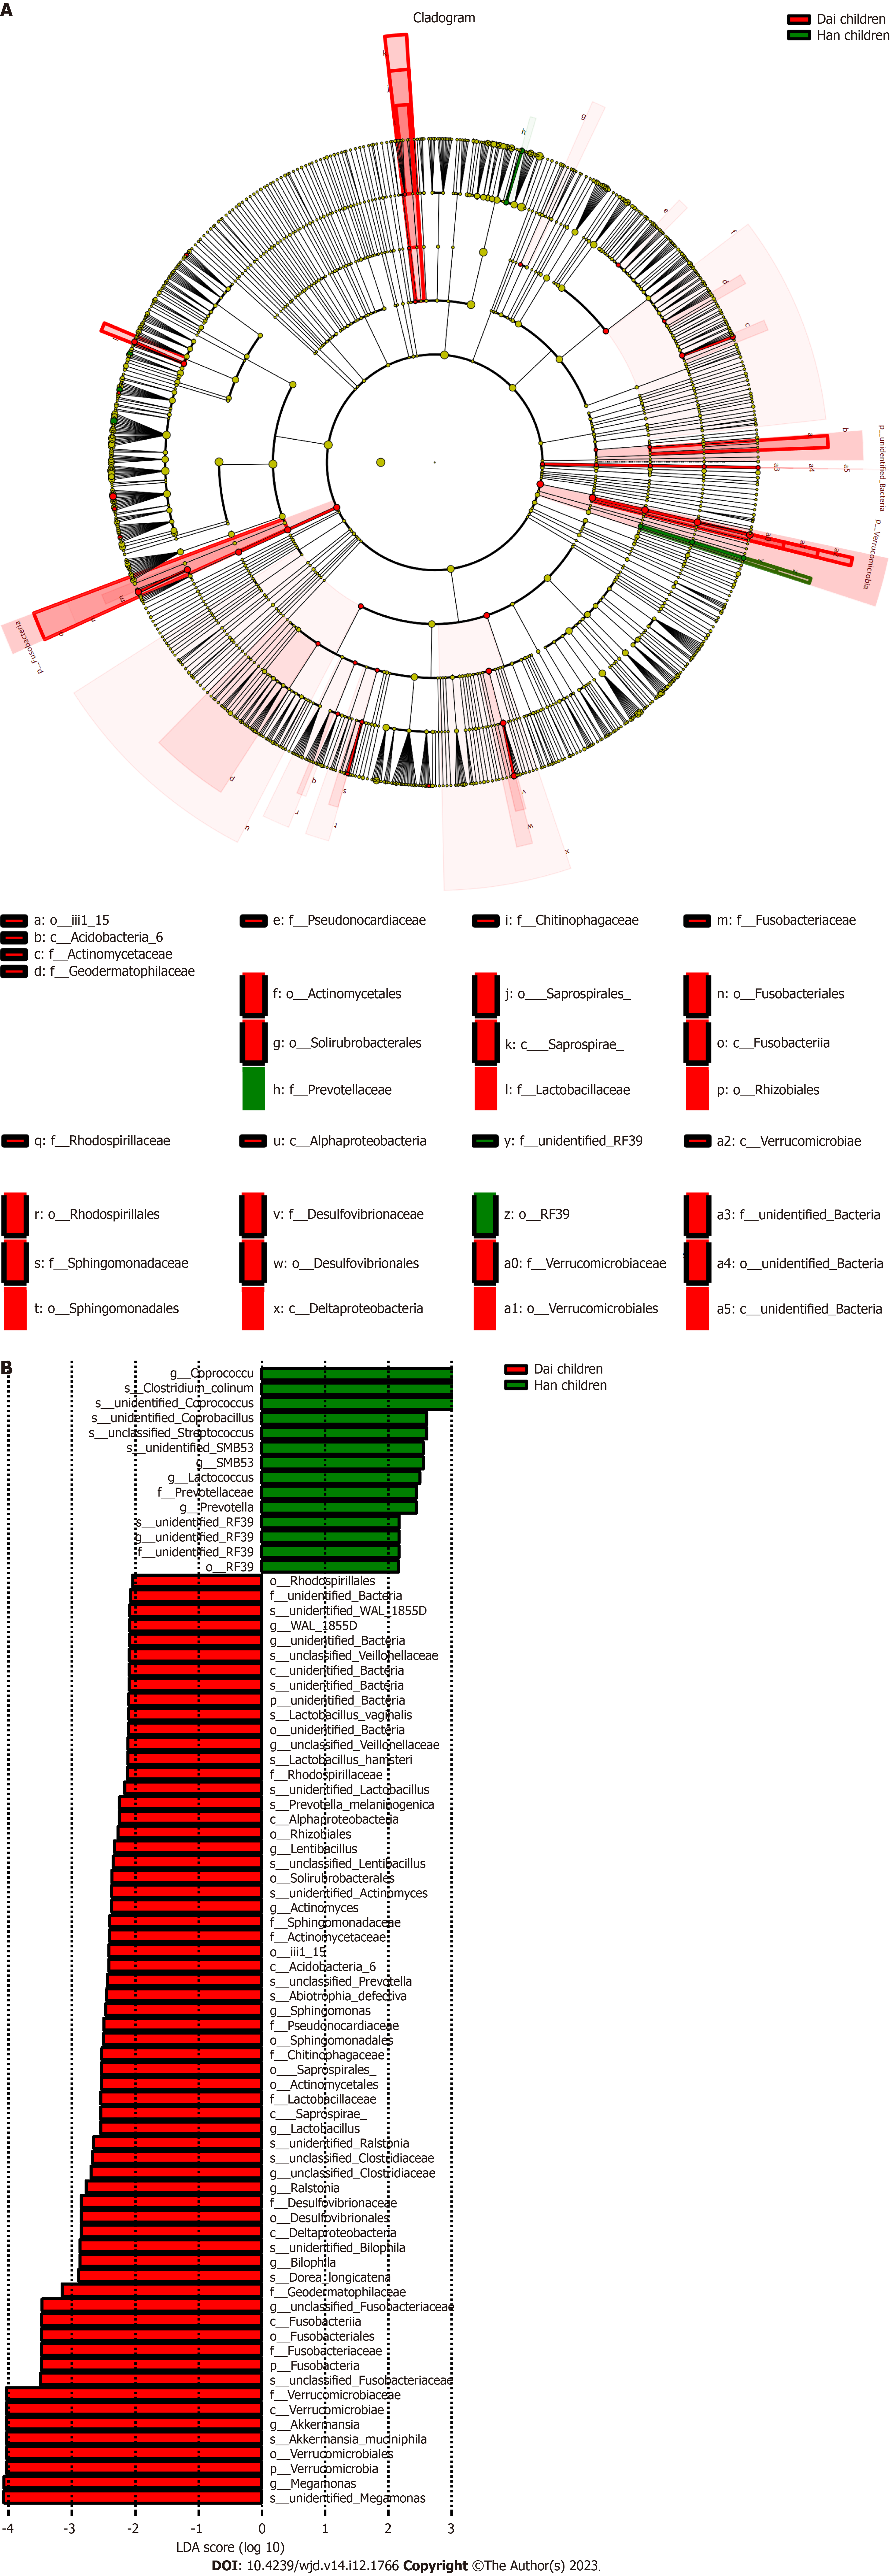
Figure 5 Cladogram of the Linear discriminant analysis Effect Size analysis in healthy children.
A: Taxonomic representation of statistically and biologically consistent differences between the healthy children in the Han and Dai populations. Differences are represented in the color of the most abundant class (red indicates the Dai population, and green indicates the Han population). The diameter of each circle is proportional to the abundance of the taxon; B The Linear discriminant analysis Effect Size analysis provided a list of features that were statistically and biologically different (ranked by the effect size). T2DM: Type 2 diabetes mellitus.
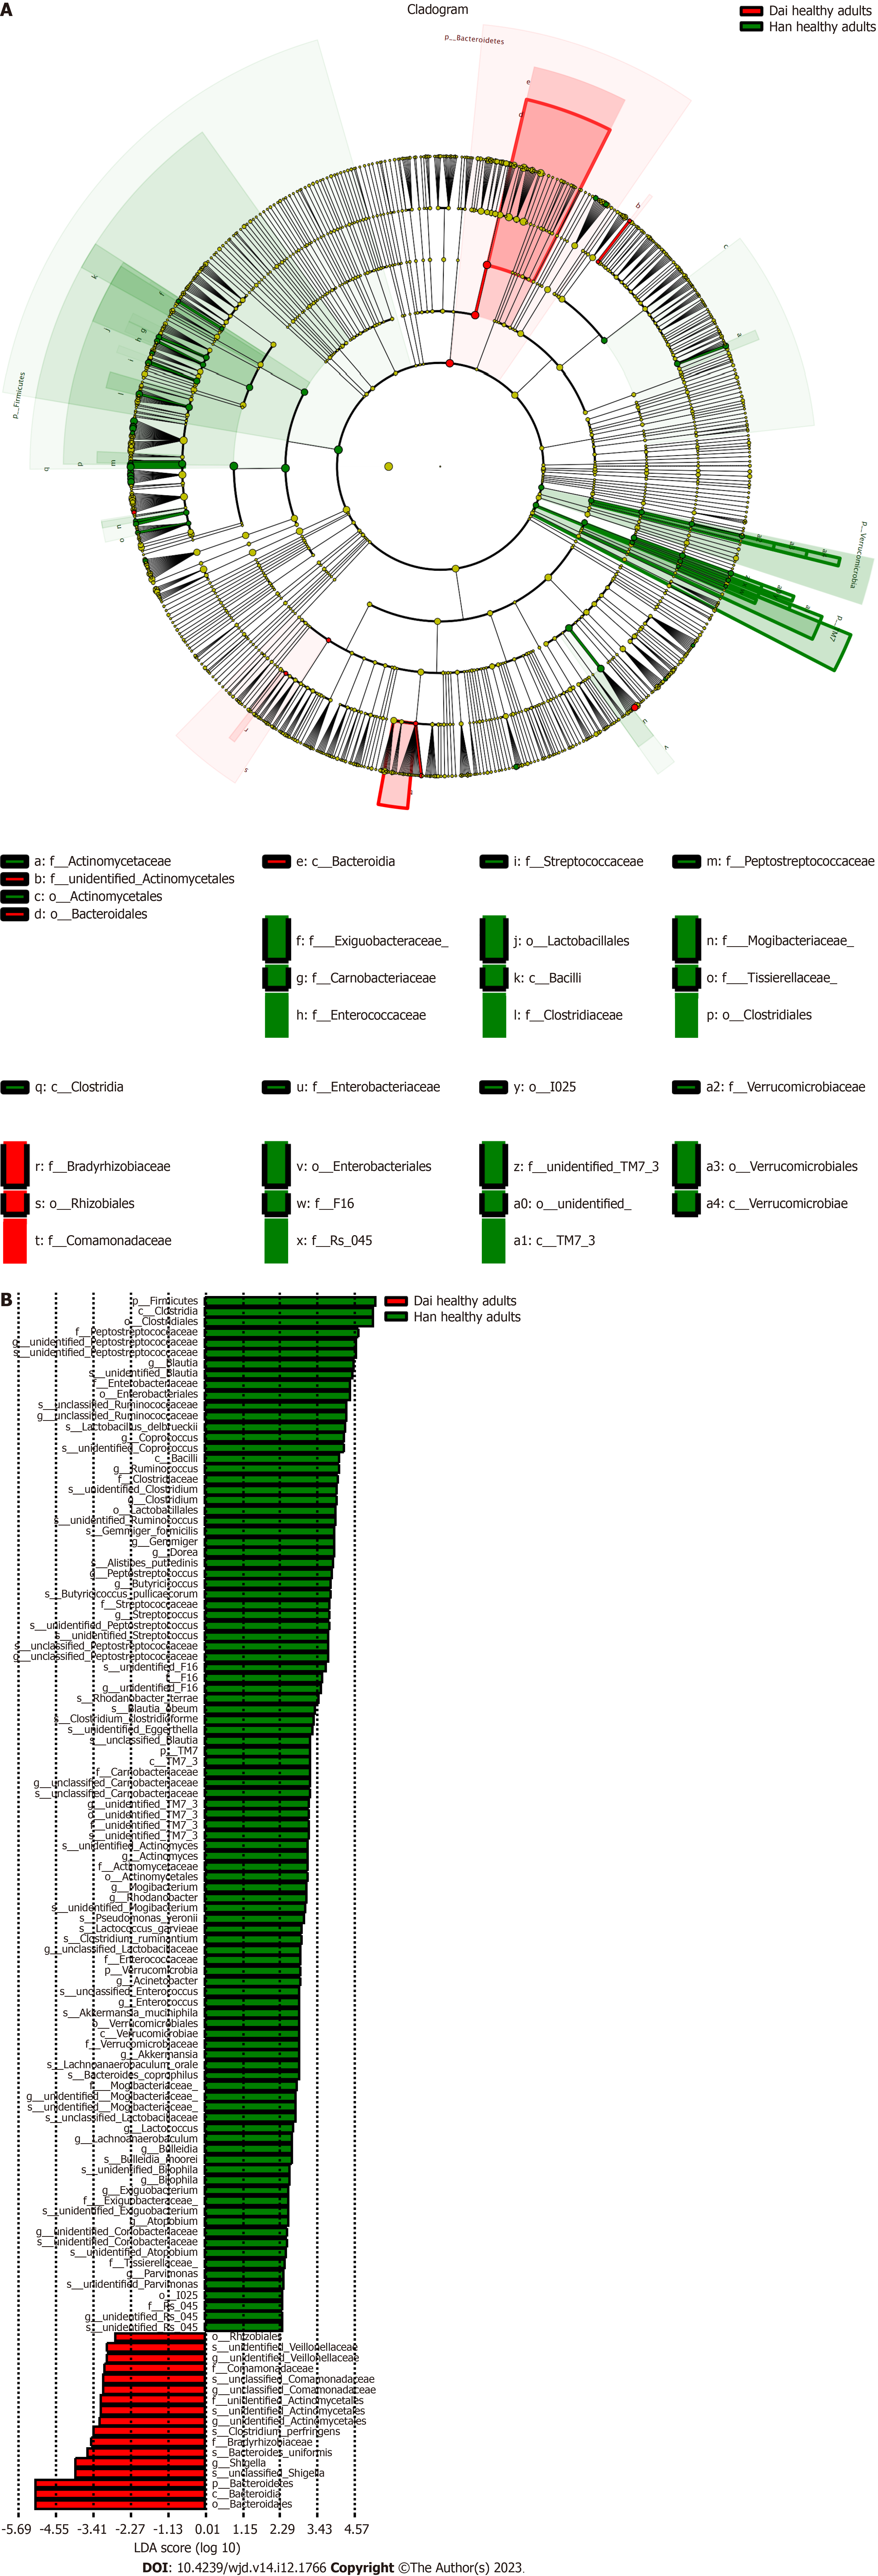
Figure 6 Cladogram of the Linear discriminant analysis Effect Size analysis in healthy adults.
A: Taxonomic representation of statistically and biologically consistent differences between the healthy adults in the Han and Dai populations. Differences are represented in the color of the most abundant class (red indicates the Dai population, and green indicates the Han population). The diameter of each circle is proportional to the abundance of the taxon; B The Linear discriminant analysis Effect Size analysis provided a list of features that were statistically and biologically different (ranked by the effect size). T2DM: Type 2 diabetes mellitus.
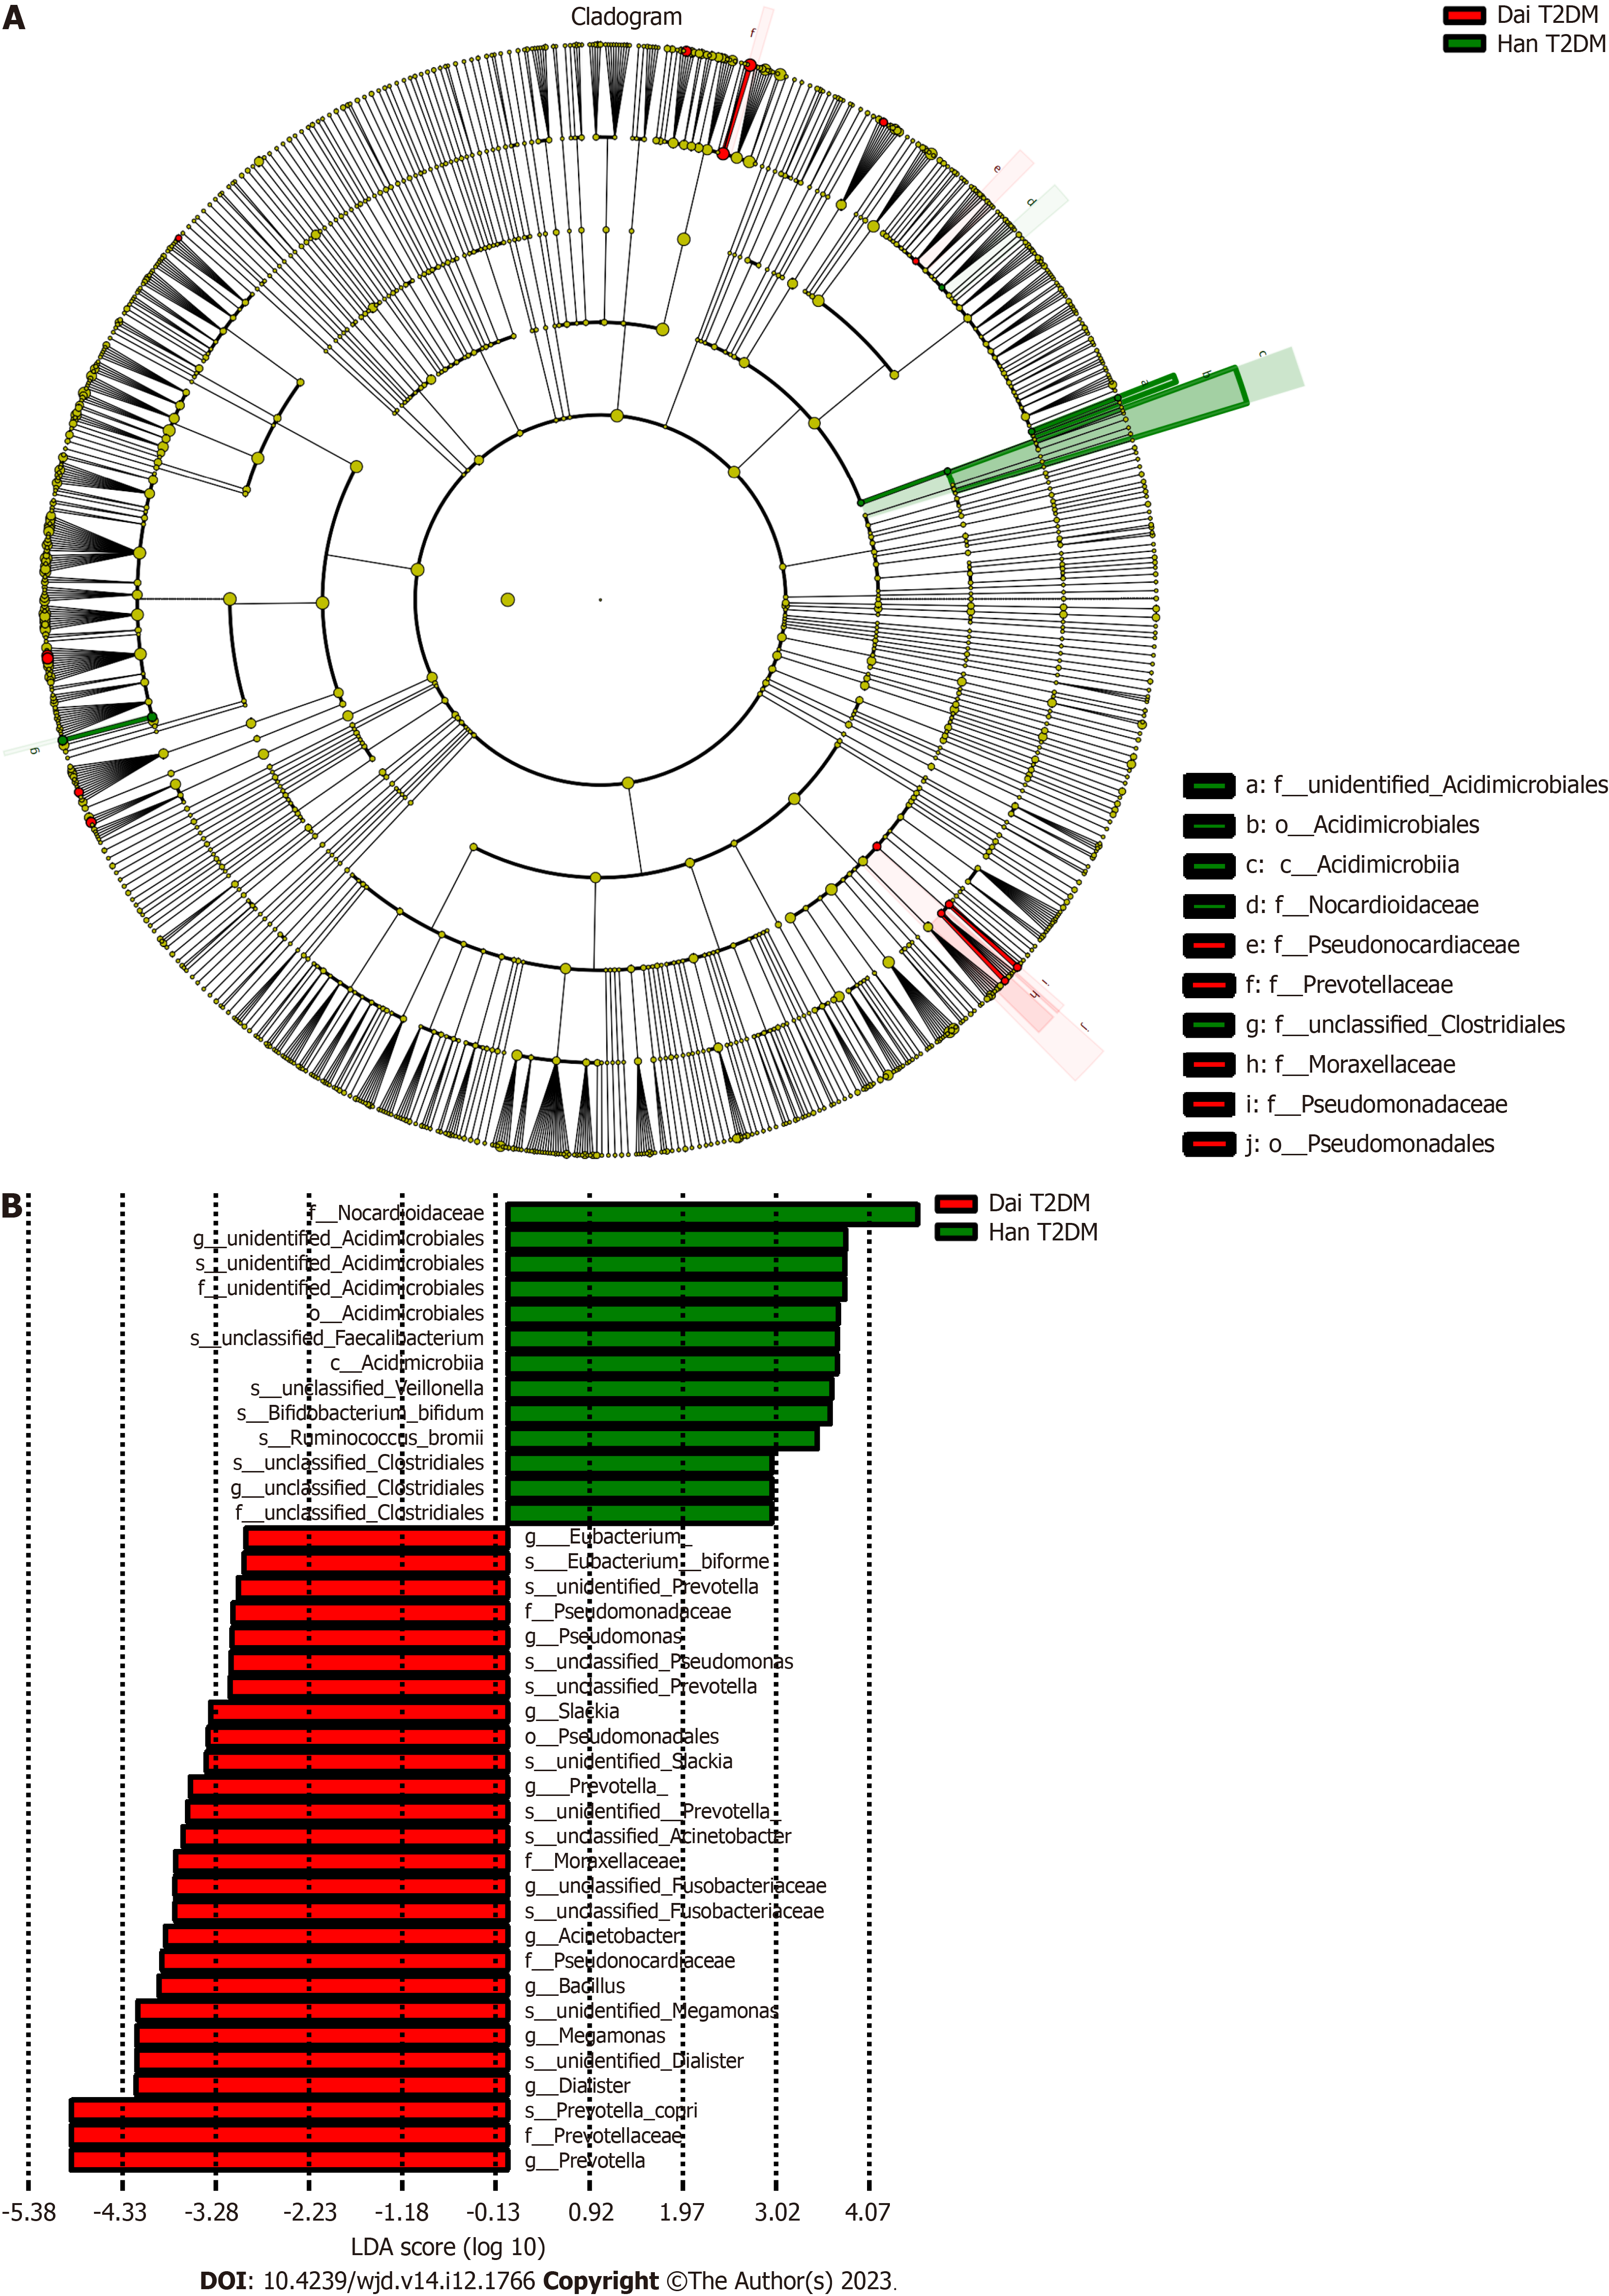
Figure 7 Cladogram of the Linear discriminant analysis Effect Size analysis in type 2 diabetes mellitus patients.
A: Taxonomic representation of statistically and biologically consistent differences between the type 2 diabetes mellitus patients in the Han and Dai populations. Differences are represented in the color of the most abundant class (red indicates the Dai population, and green indicates the Han population). The diameter of each circle is proportional to the abundance of the taxon; B The Linear discriminant analysis Effect Size analysis provided a list of features that were statistically and biologically different (ranked by the effect size). T2DM: Type 2 diabetes mellitus.
- Citation: Tang LT, Feng L, Cao HY, Shi R, Luo BB, Zhang YB, Liu YM, Zhang J, Li SY. Comparative study of type 2 diabetes mellitus-associated gut microbiota between the Dai and Han populations. World J Diabetes 2023; 14(12): 1766-1783
- URL: https://www.wjgnet.com/1948-9358/full/v14/i12/1766.htm
- DOI: https://dx.doi.org/10.4239/wjd.v14.i12.1766


