Published online Jul 15, 2014. doi: 10.4251/wjgo.v6.i7.225
Revised: April 4, 2014
Accepted: June 18, 2014
Published online: July 15, 2014
Processing time: 269 Days and 5 Hours
AIM: To investigate the close parallels between our novel diet-related mouse model of colon cancer and human colon cancer.
METHODS: Twenty-two wild-type female mice (ages 6-8 wk) were fed the standard control diet (AIN-93G) and an additional 22 female mice (ages 6-8 wk) were fed the control diet supplemented with 0.2% deoxycholic acid [diet + deoxycholic acid (DOC)] for 10 mo. Tumors occurred in the colons of mice fed diet + DOC and showed progression to colon cancer [adenocarcinoma (AC)]. This progression is through the stages of tubular adenoma (TA), TA with high grade dysplasia or adenoma with sessile serrated morphology, intramucosal AC, AC stage T1, and AC stage T2. The mouse tumors were compared to human tumors at the same stages by histopathological analysis. Sections of the small and large intestines of mice and humans were evaluated for glandular architecture, cellular and nuclear morphology including cellular orientation, cellular and nuclear atypia, pleomorphism, mitotic activity, frequency of goblet cells, crypt architecture, ulceration, penetration of crypts through the muscularis mucosa and presence of malignant crypts in the muscularis propria. In addition, preserved colonic tissues from genetically similar male mice, obtained from a prior experiment, were analyzed by immunohistochemistry. The male mice had been fed the control diet or diet + DOC. Four molecular markers were evaluated: 8-OH-dG, DNA repair protein ERCC1, autophagy protein beclin-1 and the nuclear location of beta-catenin in the stem cell region of crypts. Also, male mice fed diet + DOC plus 0.007% chlorogenic acid (diet + DOC + CGA) were evaluated for ERCC1, beclin-1 and nuclear location of beta-catenin.
RESULTS: Humans with high levels of diet-related DOC in their colons are at a substantially increased risk of developing colon cancer. The mice fed diet + DOC had levels of DOC in their colons comparable to that of humans on a high fat diet. The 22 mice without added DOC in their diet had no colonic tumors while 20 of the 22 mice (91%) fed diet + DOC developed colonic tumors. Furthermore, the tumors in 10 of these mice (45% of mice) included an adenocarcinoma. All mice were free of cancers of the small intestine. Histopathologically, the colonic tumor types in the mice were virtually identical to those in humans. In humans, characteristic aberrant changes in molecular markers can be detected both in field defects surrounding cancers (from which cancers arise) and within cancers. In the colonic tissues of mice fed diet + DOC similar changes in biomarkers appeared to occur. Thus, 8-OH-dG was increased, DNA repair protein ERCC1 was decreased, autophagy protein beclin-1 was increased and, in the stem cell region at the base of crypts there was substantial nuclear localization of beta-catenin as well as increased cytoplasmic beta-catenin. However, in mice fed diet + DOC + CGA (with reduced frequency of cancer) and evaluated for ERCC1, beclin-1, and beta-catenin in the stem cell region of crypts, mouse tissue showed amelioration of the aberrancies, suggesting that chlorogenic acid is protective at the molecular level against colon cancer. This is the first diet-related model of colon cancer that closely parallels human progression to colon cancer, both at the histomorphological level as well as in its molecular profile.
CONCLUSION: The diet-related mouse model of colon cancer parallels progression to colon cancer in humans, and should be uniquely useful in model studies of prevention and therapeutics.
Core tip: Mouse models of colon carcinogenesis are essential as platforms for trials of prevention and therapy. However, most previous rodent models of colon carcinogenesis lack an invasive phenotype and/or do not share several significant genetic events and histopathological features of human colon cancer. This new diet-related mouse model of colon cancer is unique in being closely parallel to human progression to sporadic colon cancer by measures of its histomorphology and its molecular profile. It also has a natural basis, using dietary deoxycholic acid, long thought to be a central causative agent in colon carcinogenesis.
- Citation: Prasad AR, Prasad S, Nguyen H, Facista A, Lewis C, Zaitlin B, Bernstein H, Bernstein C. Novel diet-related mouse model of colon cancer parallels human colon cancer. World J Gastrointest Oncol 2014; 6(7): 225-243
- URL: https://www.wjgnet.com/1948-5204/full/v6/i7/225.htm
- DOI: https://dx.doi.org/10.4251/wjgo.v6.i7.225
Epidemiological studies show that rates of colon cancer incidence and mortality vary substantially across regions of the world. The rate of colon cancer incidence differs between countries by more than 10-fold[1]. More dramatically, Native Africans in South Africa have a colon cancer rate of < 1:100000[2] compared to the incidence rate for male African Americans of 72:100000[3]. In populations migrating from low-incidence to high-incidence countries rates change rapidly, and within one generation may reach the rate in the high-incidence country. This has been observed, for instance, in the colon cancer incidence of migrants from Japan to Hawaii[4]. These changes in colon cancer rates are thought to be largely due to changes in diet. Large increases in both meat and fat in the diet correlate with large increases in rate of colon cancer, graphed on an exponential scale[5].
In populations with a high incidence of colorectal cancer, fecal concentrations of bile acids are increased[6,7], suggesting that increased exposure of the colonic lumen to high levels of bile acids plays a role in the natural course of development of colon cancer. For example, the concentration of deoxycholic acid (DOC) in the feces of Native Africans in South Africa is 7.30 nmol/g wet weight stool while that of African Americans is 37.51 nmol/g wet weight stool, so that there is 5.14 fold higher concentration of DOC in stools of African Americans than in Native Africans[8]. As indicated above, there is a more than 72-fold greater rate of colon cancer in African American males than in Native Africans of South Africa. The hydrophobic bile acids, DOC and lithocholic acid, appear to be the most significant bile acids with respect to human colorectal cancer[6].
Since the bile acid DOC was implicated as important in colon cancer etiology in humans, we previously investigated whether DOC, at a high human physiologic level, could be a colon carcinogen in an experimental mouse model[9], and found that a high human physiologic level of DOC in the mouse colon does indeed cause colon cancer. We investigate, in the current study, whether the progression to colon cancer due to high physiologic levels of DOC in the mouse, by the gold standard histomorphologic analysis[10], is closely parallel to progression to colon cancer in humans. Other studies indicate that preneoplastic areas (field defects) are altered in molecular markers in human progression to colon cancer. We evaluate four of these markers: 8-OH-dG, ERCC1, beclin-1 and beta-catenin in the mouse colon progressing to colon cancer.
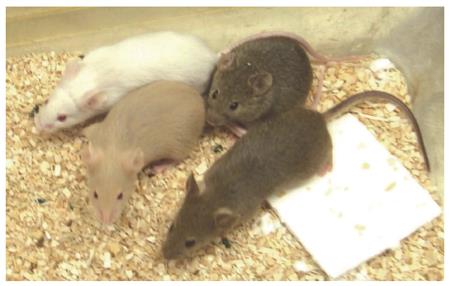
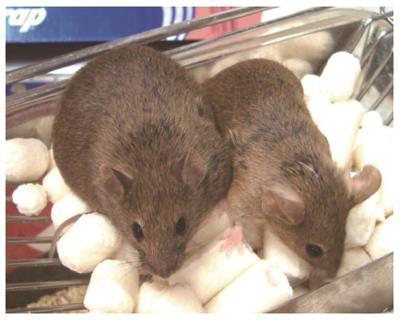
Wild-type female B6.129PF2/J mice, ages 6-8 wk old, were obtained from Jackson Laboratories (Bar Harbor, ME). The mice were the second generation (F2) of a cross between two well-established, inbred, wild-type strains: C57BL/6J and 129S1/SvlmJ (one of which carried a recessive albino mutation). The phenotypes of these F2 wild-type mice is expected to be varied, since the contribution of the two parental wild-type strains will be different in each F2 offspring, as illustrated by the color variation in these mice (Figure 1). It was intended that these mice be similar to a normal healthy human population in their genetic variation. Mice were maintained at the University of Arizona’s Animal Care Facility. All animals were raised, starting with 4 mice in each pan, in cages under nonsterile microisolator conditions and in compliance with the regulations and NIH guidelines for Care and Use of Laboratory Animals. All mice were weighed and their weights recorded weekly.
The mice were free of murine viruses, pathogenic bacteria (including Helicobacter spp.), and endo- and ectoparasites by routine health evaluations. The mice were maintained on a 12-h light-dark cycle with water ad libitum and fed the control AIN-93G diet (Table 1), either unsupplemented or supplemented with 0.2% DOC. Purified diets were prepared as needed by Harlan Teklad, Madison, WI (including the DOC-containing diet). DOC was supplied by Sigma-Aldrich Corp, St. Louis, MO. Mice were first fed the control diet for 2 wk for acclimation. Then half the mice were fed with diet + DOC and half with control diet alone. Ten months after being switched to their experimental diets the mice were sacrificed, using CO2. At the time of being placed on the experimental diets, 24 mice fed the control diet and 24 mice fed diet + DOC each consisted of 6 mice 6 wk old, 15 mice 7 wk old, and 1 mouse 8 wk old. During the succeeding 10 mo, 2 mice from each group died of unknown causes so that 22 mice in each group completed the experiment.
| Ingredients | Percentage |
| Corn starch | 39.75% |
| Casein vitamin free | 20% |
| Maltodextrin | 13.20% |
| Sucrose | 10% |
| Soybean oil | 7% |
| Powdered cellulose | 5% |
| AIN 93G mineral mix | 3.50% |
| AIN 93 vitamin mix | 1% |
| L-cystine | 0.30% |
| Choline bitartrate | 0.25% |
| t-butylhydroquinone | 0.0014% |
Before any biopsy tissue samples were obtained during colonoscopy, informed consent was given by the patient, using a form approved by the University of Arizona Institutional Review Board. Biopsy specimens were completely fixed in 10% buffered formalin for 6 to 12 h, followed by routine processing through graded alcohols and subsequent embedding into paraffin blocks. Tissue samples from colonic resections were obtained after informed consent before surgery. Colonic segments were cut open and gross photographic images of colonic tumors and polyps were obtained. Adequate representative tissue samples were obtained from areas of tumors and adjacent colonic mucosa. Similar to the biopsy specimens, these tissue samples were fixed in 10% buffered formalin for 24 to 36 h, transferred to graded alcohols, followed by paraffin embedment.
Three 4-micron tissue sections were cut from all retained paraffin-embedded tissues. The tissues were then placed on glass slides, stained with hematoxylin and eosin, and subjected to histopathologic analyses. Morphologic evaluation was performed using a brightfield digital light microscope (Motic BA300).
The gastrointestinal (GI) tracts of mice, including rectum, colon, cecum, small intestine, stomach and lower esophagus, were removed, opened longitudinally, rinsed with phosphate-buffered saline (PBS) and divided into sections that could fit into paraffin blocks. All parts of the lower GI tract including rectum, colon and cecum were retained for fixation and paraffin embedment and any parts of the small intestine, stomach and esophagus that had a visible protrusion were retained. In addition, other organs including liver, pancreas, spleen, breasts and lymph nodes near breasts were examined, and if there were any potentially aberrant areas observed, sections of these organs were also retained. All retained sections were placed flat on Matricel membranes for good orientation. Segments of intestine with grossly visible mucosal nodules were photographed with a Sony Cybershot 7.2 megapixel camera. Sections were subsequently fixed in 10% formalin overnight at 4 °C, then transferred to 70% alcohol, and embedded in paraffin.
Three to six 4-micron tissue sections were cut (multiple sections were cut to ensure any tumors or aberrant areas were included in the sections) from all retained tissues. The tissues were then placed on slides, stained with hematoxylin and eosin, and assessed for histopathologic characteristics. Morphologic evaluation was made on all the tissues on slides, using a brightfield digital microscope (Motic BA300). There is currently no accurate substitute for histopathologic determination of colonic neoplasia[10].
Anil R Prasad, MD, a surgical and cytopathologist with years of experience in GI pathology and immunohistochemistry diagnosed all of the tumors detected on the basis of histopathologic criteria. The mouse tumors were compared to human tumors at the same stages by histopathological analysis. Sections of the small and large intestines of mice and humans were evaluated for glandular architecture, cellular and nuclear morphology including cellular orientation, cellular and nuclear atypia, nuclear enlargement, hyperchromasia, chromatin clearing, pleomorphism, presence of nucleoli, atypical mitotic activity, frequency of goblet cells, crypt architecture, ulceration, invasion of malignant glands through the muscularis mucosa and submucosa and presence of infiltrating malignant glandular crypts within the muscularis propria. Digital photomicrographs of representative sections were obtained using Motic Images Plus 2.0 software.
Protein expression was assessed using standard immunohistochemical methods[11,12], with variations as needed, described here. Briefly, formalin-fixed and paraffin-embedded tissues were cut into 4 μm sections and floated on water, the tissue sections were picked up onto slides, deparaffinized, and then rehydrated.
Antigen retrieval for 8-OH-dG was performed by immersing slides in 4 mol/L HCl for 20 min at room temperature, rinsing in distilled water four times, transferring slides to 0.1 mol/L Borax for 5 min at room temperature, rinsing four times in distilled water and placing slides, twice, in PBS, pH 7.4, for 5 min.
For ERCC1, antigen retrieval was performed in citrate buffer (2.1 g citric acid + approximately 5 mL 5 mol/L NaOH + 1 L water, pH 6.1) brought to a boil in a microwave and then kept at high temperature for 6 min in the microwave followed by cooling on ice for 20 min. The slides were then washed with PBS for three minutes followed by a distilled water wash for three minutes.
Antigen retrieval for beclin-1 was performed by heating in a microwave in 0.1 mol/L citrate buffer (pH 6.1) and then cooling to room temperature.
For beta-catenin, antigen retrieval was performed in citrate buffer at pH 6.0, the slides were brought to a boil in a microwave and then kept at high temperature (not boiling) in the microwave for 10 min, followed by cooling on ice for 20 min. The slides were then washed with PBS for three minutes followed by a water wash for three minutes.
The slides were then rinsed with distilled water. Endogenous peroxidase activity was blocked by incubation in 3% hydrogen peroxide in methanol for 30 min, and then the tissue sections were rinsed with distilled water and PBS. Next, slides were placed in Sequenza staining racks (Shandon Sequenza Immunostaining System from Thermo Scientific, Thermo Fisher Scientific Inc., Waltham, MA) and rinsed with PBS.
For 8-OH-dG, a non-specific protein binding blocking step was used. For this, 150 μL 5% normal horse serum in PBS was added to each slide, which was allowed to stand at room temperature for 60 min. Next, without rinsing, 150 μL antibody against 8-OH-dG (QED 12501 from QED Bioscience Inc., San Diego, CA) diluted with 2% BSA in PBS to 2 μg/mL was added to each slide and the slides were kept in the refrigerator at 4 °C overnight, followed by rinsing three times with PBS. Then 100 μL biotinylated secondary rabbit anti-mouse antibody (DAKO 0413) was added at a 1:400 dilution in 2% BSA in PBS, followed by incubation for 30 min at room temperature. At this point, Vectastain ABC reagent was prepared according to the manufacturer’s instructions, and allowed to stand for 30 min before use. Then slides were rinsed with PBS three times, three drops of Vectastain ABC reagent were added and slides were incubated at room temperature for 30 min, followed by three rinses with PBS.
For ERCC1, 3 drops per slide of “Background Sniper” (from Biocare Mach 3 kit, Biocare Medical, Concord, CA) were added and left for 10 min at room temperature to reduce non-specific staining of background proteins. The ERCC1 slides were rinsed with PBS. Then a primary mouse monoclonal antibody was used (8F1 from Neomarkers, Freemont, CA). The mouse monoclonal antibody was added at 2 μg/mL in 2% BSA/PBS and left to incubate at room temperature for 45 min before three PBS washes. For the secondary antibody, the polyclonal rabbit anti-mouse Dako Biotinylated secondary antibody (E0413, DAKO Corp., Carpinteria, CA) was added at 120 μL/slide at a 1:300 dilution (in 2% BSA/PBS) and incubated for 30 min at room temperature before being rinsed 3 times with PBS. Vectastain Elite avidin-biotin complex method kit PK 6100 (Vector Laboratories, Inc., Burlingame, CA) was then used according to the manufacturer’s instructions at 3 drops per slide and incubated at room temperature for 30 min before 2 rinses with PBS.
For beclin-1, to prevent nonspecific binding, the slides were blocked with 1.5% goat serum (Vector Laboratories, Burlingame) and then immunostained using a polyclonal anti beclin-1 antibody from ProSci Inc. (Poway, Calif, United States) at a concentration of 1 μg/mL. Sections were then incubated using a biotinylated antirabbit secondary antibody (Vector Laboratories) and Vectastain Elite ABC (Avidin Biotin Complex) reagent (Vector Laboratories).
For beta-catenin, first blocking serum consisting of 1.5% normal rabbit serum was prepared by adding 30 μL of normal rabbit serum to 2 mL BSA/PBS (prepared as 500 μL 22% BSA in 5 mL PBS) and then 120 μL was added per slide for one hour. Diluted beta catenin antibody (beta-catenin 610153, BD Biosciences San Jose, CA) was prepared by using beta catenin antibody at 250 μg/mL and diluting 6 μL into 1194 μL of 2% BSA in PBS. Without rinsing the slides, this antibody was added at 120 μL per slide for one hour. At this point, Vectastain ABC reagent was prepared according to manufacturer’s instructions, and allowed to stand for 30 min before use. Then the secondary antibody was added. This was a 1:400 dilution of DAKO 0413 rabbit anti-mouse biotinylated IgG (5 μL DAKO per 1995 μL 2% BSA in PBS) (DAKO Corp., Carpinteria, CA), 120 μL per slide for 30 min, followed by three rinses with PBS. Then three drops of Vector ABC reagent was added per slide for 30 min, followed by two washes with PBS.
The slides were then removed from the Sequenzas, and color development was carried out by applying 0.025% diaminobenzidine tetrachloride (Sigma, St. Louis, MO) in PBS supplemented with 0.04% hydrogen peroxide. Sections were counterstained with 1:4 diluted hematoxylin (Sigma), dehydrated in a graded series of ethanols followed by xylene, and then mounted with coverslips using Cytoseal XYL (Richard Allen Scientific, Kalamazoo, MI). Brown staining indicates 8-OH-dG, ERCC1, beclin-1, or beta-catenin expression, and blue staining from hematoxylin identifies nucleoproteins in the nucleus.
Because the data was non-normally distributed, the nonparametric Mann-Whitney U test was performed to test for differences in occurrence of colonic and duodenal tumors and adenocarcinomas between mice fed diet + DOC and diet alone, and to determine if there were differences in the frequency of proximal and distal colonic tumors in the mice fed diet + DOC. To determine if there were correlations between mouse weight and number of tumors, a Pearson’s correlation coefficient was calculated. The statistical analysis package Systat version 12 was used to analyze the data.
Mice fed the control diet and mice fed diet + DOC each looked healthy and were active during the entire time they were on their diets, even though the mice fed diet + DOC were almost all carrying neoplastic lesions (tumors, some of which were cancers) by 10 mo on the diet. This is similar to humans who have colon cancers, who also show no external signs until the cancers are very large or have metastasized.
Twenty out of the 22 female mice fed diet + DOC (91%) developed large macroscopically visible mucosal nodules (likely colonic neoplastic lesions). Figure 2 shows opened proximal regions of colons, including the cecums, of two mice fed diet + DOC. Figure 2A shows about 3 cm of proximal colon plus cecum in which three large mucosal nodules can be seen by eye. Histopathological examination of tissue from this area revealed three tubular adenomas, two of them with ulceration and one with high grade dysplasia. Figure 2B shows about 2 cm of another proximal colon plus cecum, and no mucosal nodules are seen. The colon of this mouse, also fed diet + DOC, had no colonic neoplasia at all upon histological examination.
None of the mice fed the control diet alone developed any colorectal tumors, evaluated both macroscopically and by microscopic histopathological examination of all rectum, colon and cecum segments.
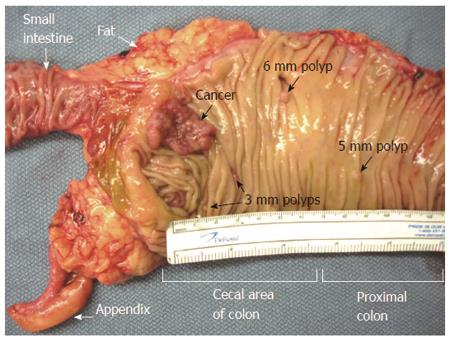
Multiple tumors found in one location of the mouse colon, as in Figure 2A, indicate the presence of a field defect. By comparison, in humans, we also found multiple tumors in some of their much larger colon resections, and one example, showing 13 cm of the longitudinally-opened colon, is shown in Figure 3.
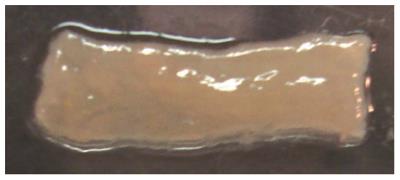
Most large mucosal nodules seen macroscopically in the large intestines of mice proved to be tumors upon histopathological examination. However, many small mucosal nodules were seen in the small intestine of each mouse, such as shown in Figure 4. Following microscopic examination, almost all were found to be benign Peyer’s patches similar to those found in the human small intestine (Peyer’s patches are gut-associated lymphoid tissue consisting of isolated or aggregated lymphoid follicles, and are the immune sensors of the intestine).
None of the small mucosal nodules in the small intestines of mice fed diet + DOC proved to be tumors. However, of the 22 mice fed control diet, 3 of the mice had small nodules that proved to be small adenomas. These small adenomas occurred near the Ampulla of Vater and Sphincter of Oddi (at the major duodenal papilla, in the second part of the duodenum), an area that experiences concentrated bile acids as they exit the common bile duct into the small intestine. This is the usual location of small intestinal tumors in humans, as well. These tumors were not cancers.
For each mouse fed diet + DOC, Table 2 lists data in 11 columns (Note that mice were 6 to 8 wk old when received, acclimated to the control diet for 2 wk, and then put on their diets for 10 mo, so that all mice, at termination, were 12 to 121/2 mo old). In column 1, all 22 mice are listed by ascending weights. Columns 2 and 3 give the total number and location (distal or proximal) of all neoplastic lesions in these mice. There were 13 distal and 44 proximal lesions, for a total of 57 lesions.
| Mouse weights (g) | Locations of tumors | Hyper-plastic polyp | Characteristics of polyps low and high grade dysplasia including those from which cancers arose | Stages of cancers found | ||||||
| Distal tumor | Proximal tumor | Tubular adenoma | Sessile serrated adenoma | Ulcerated adenoma | Adenoma with HGD | Intra-mucosal AC | Stage T1 AC | Stage T2 AC | ||
| 18.7 | 3 | 3 | ||||||||
| 24 | 3 | 2 | 1 | 1 | ||||||
| 25 | 2 | 2 | ||||||||
| 25.8 | 1 | 1 | 1 | 1 | ||||||
| 25.9 | 3 | 3 | 2 | 1 | ||||||
| 26.1 | 1 | 1 | 1 | 1 | ||||||
| 26.1 | 3 | 3 | 2 | 2 | ||||||
| 27.3 | 2 | 2 | 1 | 1 | ||||||
| 27.4 | 5 | 5 | 3 | 3 | ||||||
| 28.8 | 2 | 2 | ||||||||
| 35.4 | None | None | ||||||||
| 35.7 | 2 | 3 | 2 | 3 | ||||||
| 38.9 | 2 | 2 | 2 | 2 | ||||||
| 40 | 3 | 2 | 1 | |||||||
| 41.1 | 4 | 3 | 3 | 1 | 2 | |||||
| 43 | 2 | 2 | 1 | |||||||
| 43.1 | 1 | 1 | 1 | |||||||
| 45.2 | 1 | 1 | 1 | 1 | ||||||
| 45.2 | 2 | 2 | 1 | |||||||
| 49.2 | None | None | ||||||||
| 53.7 | 7 | 3 | 4 | 1 | 4 | |||||
| 78.6 | 3 | 3 | ||||||||
| Totals | 13 | 44 | 2 | 37 | 15 | 17 | 3 | 7 | 9 | 2 |
Columns 4-11 give characteristics associated with the tumors enumerated in columns 2 and 3. Since any particular tumor may have two or more distinguishing characteristics, the total number of characteristics listed is greater than the total number of tumors. Column 4 indicates that two of the tumors in mouse 12 were hyperplastic. Hyperplastic polyps do not exhibit dysplasia and hence do not have malignant potential. Columns 5-8 give the characteristics of polyps exhibiting low and high grade dysplasia. There were 37 with tubular adenoma characteristics (TAs) (column 5), 15 with sessile serrated adenoma characteristics (SSA) (column 6), 17 of these adenomas (TA or SSA) had ulceration (column 7) and 3 adenomas displayed high grade dysplasia (HGD) (column 8). Columns 9-11 indicate characteristics of tumors that contain, or are entirely, clearly malignant and are at an early or later stages. These include 7 intramucosal adenocarcinomas (ACs) (an early stage) (column 9), 9 ACs at stage T1 (column 10) and 2 ACs at stage T2 (a late stage) (column 11). In total, 18 tumors were all, or in part, ACs. The polyps with low and high grade dysplasia (including those with ACs) totaled 55, or an average of 2.5 colonic neoplastic polyps or AC per mouse. The ACs often appreared to arise from a polyp with high grade dysplasia. For example, the mouse weighing 53.7 g had 7 tumors in the proximal colon, and one of these tumors was an SSA from which an AC had arisen and the area of the AC was ulcerated. Overall, 55 tumors were observed displaying morphological characteristics comprised of low and high grade dysplasia, or invasive malignancy of various stages.
Ten of the 22 mice had ACs, with some mice having more than one AC. There were 6 mice having just one AC, 2 mice having two ACs, 1 mouse having 3 ACs and 1 mouse having 4 ACs. Thus 45% of these 22 mice had at least one colonic AC after 10 mo of being fed diet + DOC.
As shown in Table 3, after 10 mo on the diet, 20 out of 22 (91%) of mice fed diet + DOC developed tumors (cancers or adenomas) in their colons, and of these diet + DOC fed mice, 10 (45%) had developed cancers. The 22 mice with no supplement to their diet had no cancers or adenomas in their colons. There was a significant difference in the number of mice with colonic tumor development between those mice fed diet + DOC and those fed diet alone (Mann-Whitney U, P < 0.000001 two-tailed). There was also a significant difference in the number of mice with cancer development between those mice fed diet + DOC and those fed diet alone (Mann-Whitney U, P = 0.00042 two-tailed).
Of the 57 total tumors found in the mice fed diet + DOC (Table 2), 44 (83%) were found in the proximal colon and 13 (23%) were found in the distal colon. There was a significant difference between the numbers of tumors in the proximal region and the distal region (Mann-Whitney U, P = 0.0027 two-tailed).
Three of the mice fed the diet only, with no supplement, had small adenomas near the Sphincter of Oddi (at the major duodenal papilla, in the second part of the duodenum). No mice in the DOC + diet group had adenomas in the duodenum. A Mann-Whitney U test to determine if there was a significant difference in occurrence of adenomas in the duodenum in the diet + DOC fed mice compared to the mice fed diet alone indicated that there was no significant difference (P = 0.076).
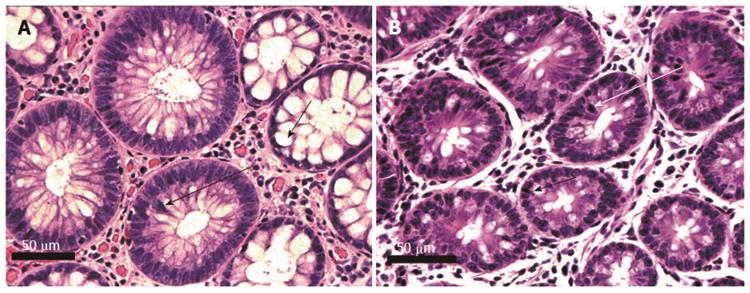
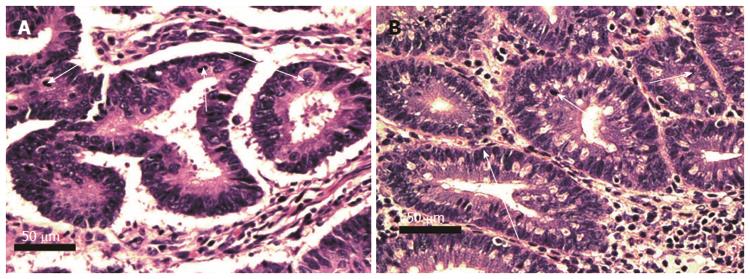
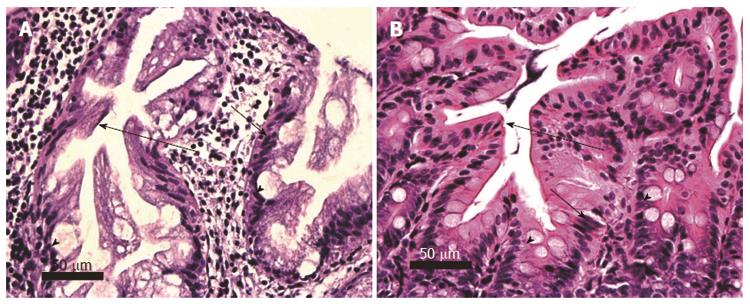
Pairs of adjacent images, Figures 5-8 below, illustrate the histomorphology of human and mouse colonic epithelial tissues. These Figures identify, in the legends and the images, the specific histomorphological characteristics that are crucial for characterizing either normal glandular architecture or identifiable stages in progression towards invasive adenocarcinoma. Stages shown include normal non-neoplastic glands (crypts) (Figure 5), tubular adenomas (Figure 6), tubular adenomas with high grade dysplasia (Figure 7) and sessile serrated adenomas (Figure 8). In each pair of tissues, the human and mouse crypts show closely parallel specifically identifying histomorphological characteristics. From the microscopic images alone, it is difficult to distinguish whether the tissues are from a human or from a mouse, though when viewed side-by-side, the mouse tissues are seen to have a smaller number of cells per crypt.
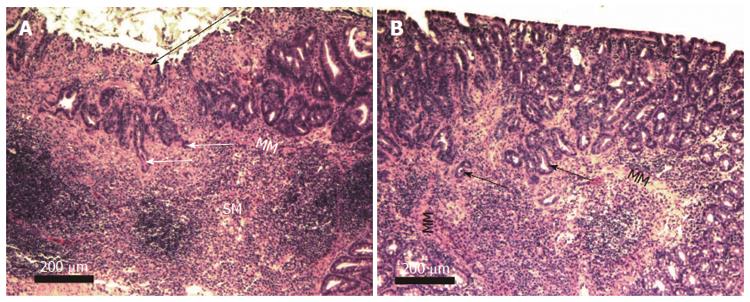
Figures 9 and 10 identify, in the legends and the images, the specific histomorphological characteristics that are crucial for characterizing invasive adenocarcinomas of stages T1 and T2. Figure 9A also shows some of the characteristics that may accompany colonic adenocarcinomas. In this image the adenocarcinoma arose in association with, or arose from a sub clone of, a sessile serrated adenoma. In addition, this adenocarcinoma shows ulceration of the colonic mucosa.
Only mouse tissues are shown in Figures 9 and 10, since human adenocarcinomas having penetration through the muscularis mucosa and entry into the submucosa could not be shown at the same magnification and still fit in the figure. These images were taken at intermediate magnification (10× objective lens), a lower magnification than the preceding images (taken with a 40× objective lens).
Two examples of mouse colonic adenocarcinoma at low magnification (taken with a 4× objective lens) are shown in Figure 10. This magnification allows imaging of the majority of the cancers in single fields of view. Figure 10A shows a section through an entire cancer at stage T1 with mucosal ulceration, and Figure 10B shows a section through an almost entire cancer at stage T2.
Figure 11 shows portions of human and mouse stage T2 adenocarcinomas, showing adenomatous glands invading the muscularis propria. The presence of extravasated mucin, forming mucin pools adjacent to malignant glands are seen in Figure 11B.
Tissues had been preserved in paraffin from our previous experiment where mice had been fed either the control diet, diet + DOC or diet + DOC + CGA[9]. From the colons of each of three mice on the different diets, a 4 micron tissue section was obtained and immunostained for location and level of a marker of progression to colon cancer. The segments of the colons evaluated were in regions of the colon without a neoplastic lesion. Thus, we were evaluating colon segments for the presence of preneoplastic areas from which a neoplastic lesion might be expected to arise. The small number of mouse colons evaluated constituted a brief survey of molecular markers altered in progression to colon cancer. The examples in Figures 12, 13, 14, 15, 16 were representative of the levels of biomarkers found, but with only three tissue samples, variation of the expression of each marker was not quantitated. As background information for these tissues, we note that in the previous experiment from which these tissues came, for the 12 mice fed the control diet none developed colonic neoplasia. For the 18 mice fed diet + DOC, 94% had developed colonic neoplasia, and for 56% of these mice the neoplasia had progressed to adenocarcinoma. There had been 12 mice fed diet + DOC + CGA, of which 64% developed colonic neoplasia, and for 18% of these mice the neoplasia had progressed to adenocarcinoma, so that CGA was somewhat protective against colonic neoplasia and adenocarcinoma
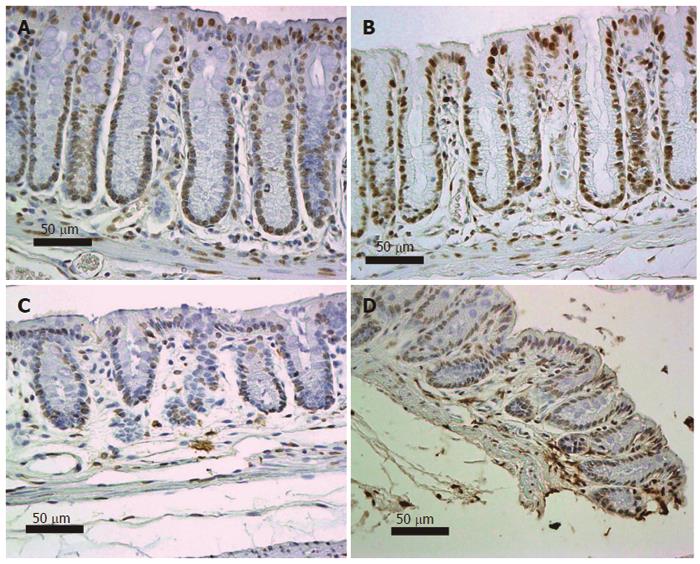
As reviewed by Scott et al[14], the DNA damage 8-OH-dG is carcinogenic. Six mice, on their diets for 8 mo, were terminated and their colons removed for evaluation of nuclear 8-OH-dG (Figure 12). Three of these mice were on the standard diet and three had been fed diet + DOC. Colonic tissue sections from each mouse were placed on slides and immunostained for 8-OH-dG. Figure 12 shows tissues from 2 mice fed diet + DOC (Figure 12A and B) and 2 mice fed control diet (Figure 12C and D). Brown stain indicates 8-OH-dG and blue is hematoxylin stain for the chromatin in the nucleus. The level of 8-OH-dG was graded in the nuclei of the colonic crypt cells by IHC on a scale of 0-4. The nuclei of mice fed diet + DOC were largely at levels 3 to 4 (Figure 12A and B) while for mice fed diet alone were largely at levels 0 to 2 (Figure 12C and D). The images in Figure 12 were each uniformly enhanced in Paint Shop Pro 5 by increasing “shadow” to 35 and “saturation” to 35 to allow enhancement of the brown and blue colors for greater clarity in evaluating the immunohistochemical staining.
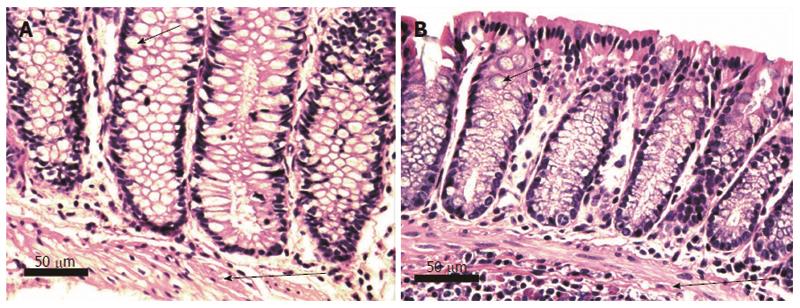
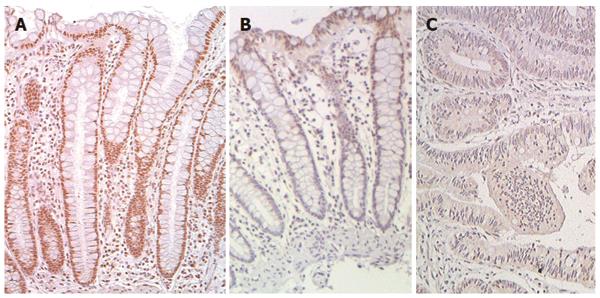
We recently reported that expression of DNA repair gene ERCC1 was generally deficient in the histologically normal tissue surrounding human colon cancers (field defects susceptible to carcinogenesis) and in colon cancers themselves[11,12]. Figure 13 shows examples of IHC staining for ERCC1 of human colonic epithelia obtained during these previous studies. As shown in these images, the nuclei of cells in the colonic crypts of a patient without colonic neoplasm (Figure 13A) have high expression of ERCC1. However, in the crypts near a colon cancer (within 10 cm of a cancer in this example) (Figure 13B), cells in the lower parts of crypts (in the stem cell and proliferative regions) are usually deficient for ERCC1 while cells in the upper parts of the crypts and along the colonic lumen have restored ERCC1 expression. Within the area of a colon cancer (Figure 13C), ERCC1 is largely absent from the nuclei. The images in Figure 13 were each uniformly enhanced as described for Figure 12.
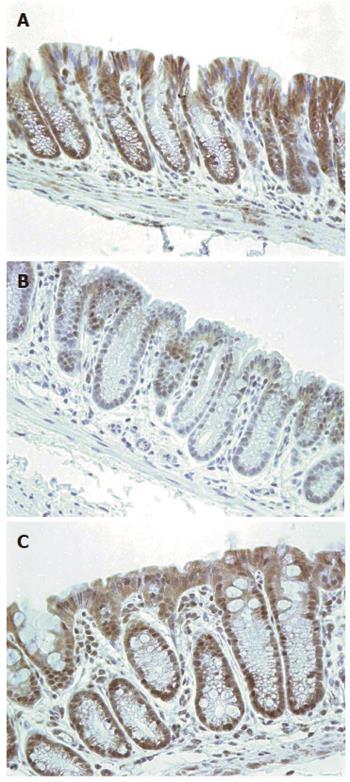
Nine mice, on their diets for 8 mo, were terminated and their colons removed for evaluation of expression of ERCC1. Three of these mice were on the standard diet, three had been fed diet + DOC and three had been fed diet + DOC + CGA. Colonic tissue sections from these mice were immunostained for ERCC1. Figure 14 shows typical colonic epithelial tissues from a mouse fed control diet (Figure 14A), a mouse fed diet + DOC (Figure 14B), and a mouse fed diet + DOC + CGA (Figure 14C). The colonic crypt cells of mice fed the control diet for 8 mo have high expression of ERCC1 (Figure 14A). For mice fed diet + DOC for 8 mo, cells in the lower parts of crypts are deficient for ERCC1 while the upper parts of the crypts usually have restored ERCC1 expression (Figure 14B). The cells of mouse colonic crypts of mice fed diet + DOC + CGA have high nuclear expression of ERCC1 (Figure 14C). The images in Figure 14 were each uniformly enhanced as described for Figure 12.
The mice fed the control diet had expression of ERCC1 (Figure 14A) that matched human ERCC1 expression for humans without colonic neoplasia (Figure 13A). The mice fed diet + DOC (and generally progressing to colonic neoplasia) had ERCC1 expression (Figure 14B) that matched human ERCC1 expression in a field defect giving rise to a cancer (Figure 13B). The mice fed diet + DOC + CGA, which had substantially fewer cancers[9], also had a level of ERCC1 expression (Figure 14C) that was similar to that of mice fed the control diet (Figure 14A).
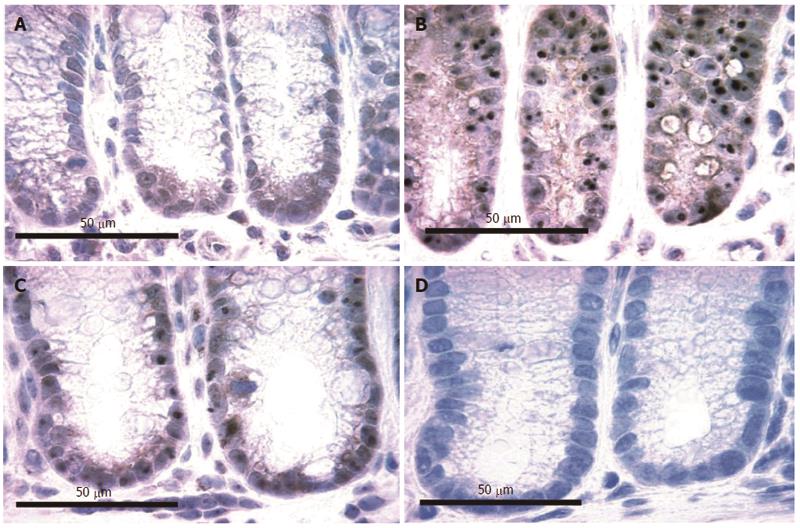
Beclin-1 is a central player in autophagy. The modulation of macroautophagy is now recognized as one of the hallmarks of human cancer cells[15]. Figure 15 shows colonic epithelium of mice immunostained for beclin-1, where the mice in Figure 15A-C were fed different diets for 8 mo. The level of beclin-1 was graded in the colonic crypt cells by IHC on a scale of 0-4. In the colonic epithelium of mice fed the control diet for 8 mo (Figure 15A) beclin-1 staining was at level 1. For mice fed diet + DOC (Figure 15B), expression was at level 4, and for mice fed diet + DOC + CGA expression was at level 3. For mouse colonic epithelium stained without the primary antibody (Figure 15D), staining was at level 0. These images were not enhanced.
The images in Figure 16 show the lower regions of mouse colonic crypts (including the stem cell regions) of mice that had been placed on three different diets for 8 mo - control diet, diet + DOC or diet + DOC + CGA. The colonic stem cell region showed only membrane expression of beta-catenin in samples of colonic epithelial tissue from all three of “control diet”-fed mice that were assessed here (one example is shown in the figure). The colonic stem cell region showed high nuclear expression of beta-catenin in samples of colonic epithelial tissue from all three of these diet + DOC fed mice that were assessed here (one example is shown in the figure). The colonic stem cell regions showed very low levels of beta-catenin in samples of colonic epithelial tissue from all three of the mice fed diet + DOC + CGA that were assessed here (one example is shown in the figure). The images in Figure 16 were each uniformly enhanced as described for Figure 12.
The final weights of mice fed the control diet for 10 mo were quite varied, with the lowest weight being 25.2 g and the highest being 63.1 g. The mouse with the median weight was at 41.3 g. The distribution of weights for mice fed diet + DOC varied from 18.7 to 78.6 g, with a median weight of 35.5 g. Each mouse was weighed weekly, and no weight loss was detected for any of the mice during their 10 mo on each diet. Mice with relatively low weights at the end of 10 mo on their diets merely gained weight more slowly than heavier mice.
Each mouse, without respect to weight, appeared to be healthy and active (Figure 17). The variation in mouse weights, like the variation in colors of these mice (Figure 1), was likely due to the variation in their genetic constitutions. As pointed out in the Materials and Methods, the mice were the second generation (F2) of a cross between two well established, inbred, wild-type strains: C57BL/6J and 129S1/SvlmJ. The phenotypes of these F2 wild-type mice is expected to be varied, since the contribution of the two parental wild-type strains will be different in each F2 offspring. The varied weights of these mice may mimic the weight variations in the general human population.
A SKEW calculation on all the data had a value of 0.0896 indicating it was approximately symmetrically distributed. A t test was then applied to determine if there were significant differences between the weights of the control-fed and the diet + DOC-fed mice, using the assumption of unequal variances (since the variances were different). The two-tailed t test, which indicates if the differences between the two populations are larger or smaller than each other, gave a P-value of 0.159, indicating that there is no significant difference between the two populations in distributions of weight. An ANOVA analysis using the same datasets also gave a P-value of 0.159. Thus distributions of weights were similar and there was no significant difference between the weight distributions for the two types of diets. There was also no systematic association of type of tumor development with weight of the mice fed diet + DOC. A Pearson correlation analysis determined the weight of the mice fed a DOC-supplemented diet was not correlated to the number of colonic tumors found (P = 0.78).
For humans on a non-controlled omnivorous diet in London England, the level of DOC in the feces averaged 3.2 mg/g dry weight[16]. A high fat human diet in the United States doubles the colonic DOC concentrations[17] and would subject people to colonic exposure to DOC at an average value in their feces of about 2 × 3.2 mg/g = 6.4 mg/g dry weight. Addition of 0.2% DOC for 6 mo to the diet of 18 wild-type male mice produced mouse feces with 4.6 mg DOC/g dry weight (comparable to the 6.4 mg/g dry weight for humans on a high fat diet). Mice on a control diet for 6 mo, on the other hand, had feces with less than a tenth the level of fecal DOC, having 0.3 mg DOC/g dry weight. Among the 18 mice fed diet + DOC, 17 developed colonic tumors in our previous study[9], including 10 mice with colon cancers. In our present study, using female mice instead of male mice, we confirmed a high frequency of colon cancer (10 of 22 mice) with mice fed diet + DOC.
Histopathologic evaluation constitutes the gold standard for determining progression of colonic epithelium to colon cancer, to which other methods are compared[10]. Using histopathologic evaluation, we showed that mice fed diet + DOC progress to colon cancer in a manner closely similar to such progression in humans.
We found that tumors in these diet + DOC fed mice mimic each of the histopathologic features of progression to colon cancer in humans that we tested. The features illustrated in Figures 6-11 include tubular adenomas, tubular adenomas with high grade dysplasia, sessile serrated adenomas, adenocarcinomas of category T1 (cancers that have invaded through the muscularis mucosa and extended into the submucosa), and adenocarcinomas of category T2 (cancers that have invaded through the submucosa and into the muscularis propria). As in the great majority of humans progressing to colon cancer, no tumors were found in the small intestines of these DOC-fed mice.
All of the tumors found in our previous study with male mice[9] were in the proximal colons of the mice. In our current study with female mice, the majority of tumors were in the proximal colon, with 44 of the 57 tumors or 77% of tumors being in the proximal colon. This is somewhat different from tumors in the human colon where tumors are found to be more nearly equally distributed between the proximal and distal regions of the colon. However, the level of DOC in the different regions of the human colon depends on two factors, while it was primarily dependent on only one factor in the mice fed diet + DOC. The first factor in humans is the continuous deconjugation and dehydroxylation (by bacteria) of the cholic acid entering the colon from the small intestine. This bacterial action generates newly formed DOC throughout the length of the colon[18]. The second factor in humans is the high level of absorption (about 50% overall) of DOC as it passes along all the regions of the colon[19]. In humans, the level of DOC would be about the same throughout the colon. In our mouse model, on the other hand, the level of DOC in mice fed diet + DOC starts off high in the proximal region of the colon. In contrast to humans, conversion of cholic acid to DOC is likely relatively insignificant for these mice since about 90% of the DOC in the colons of the mice fed diet + DOC comes from the added DOC in the diet rather than from conversion of cholic acid to DOC in the colon. Presumably, there is similar absorption of DOC from all regions of the colon in mice, as occurs in humans. Thus, there should be higher levels of DOC in the proximal regions of the colons of the mice compared to that in their distal regions. In our mice, much of the DOC would be absorbed as it travels down the length of the mouse colon. If tumors are caused by interaction of relatively high levels of DOC with colonic epithelial cells, then it is likely that, in our system, the majority of tumors would occur in the proximal colons of the mice, while in humans, with a more even distribution of DOC along the colon, tumors would occur in both the proximal and distal regions of the colon.
Tumors and colon cancers in mice occurred at an earlier age than normally found in humans. However, as reviewed by Cortopassi et al[20], multiple studies show that mice have about a 5.9-fold lower level of DNA repair than humans. A model proposed by these authors suggests that the earlier occurrence of colon cancer in mice fed diet + DOC, compared to humans, could be due to the DNA damaging nature of DOC and the lower DNA repair rate in mice.
Colon cancers are known to arise within a “field defect,” an area of the colon predisposed to progression to cancer[21]. As pointed out by Rubin[22], field defects are of crucial importance in progression to cancer. Multiple tumors in a localized area during progression to colon cancer indicate a field defect.
Macroscopically, we found multiple colonic tumors in the same colonic area, indicating that colonic tumors in both mice and humans often occur within a field defect. We previously reported, by immunhistochemical evaluation, that the colonic mucosa surrounding human colon cancers has biomarker alterations indicative of a field defect as well[11]. We can speculate that some of the mutant or epigenetically altered cells are produced due to an early deficiency in ERCC1 (and possibly to deficiencies in other un-evaluated DNA repair proteins). Such cells would be genetically unstable and could acquire a growth advantage (e.g., apoptosis resistance) due to further mutations and/or epimutations. We have shown that colonic epithelial cells grown in culture and repeatedly exposed to increasing concentrations of DOC underwent natural selection to develop resistance to apoptosis[23]. These apoptosis-resistant cells were altered in expression in 839 out of 5000 genes assessed by cDNA assay[23] and in 91 of 454 proteins detected by a proteomic analysis[24]. Cells with a growth advantage, upon proliferation, may form a defective field, which, with further mutation and epigenetic alteration due to bile acids, and further selection, could give rise to tumors, and eventually, to a colon cancer.
As reviewed by Bernstein et al[25] exposure of colon cells to high physiologic concentrations of DOC increases formation of reactive oxygen species (ROS), increases DNA damage, and causes apoptosis. A particularly important oxidative damage to DNA is 8-OH-dG, considered to play a central role in carcinogenesis[14]. A central enzyme in repair of oxidative damage to DNA is ERCC1[26]. In our present study 8-OH-dG is substantially increased and protein expression of ERCC1 is substantially decreased in the colonic epithelium of mice fed diet + DOC and progressing to colon cancer.
Chlorogenic acid (CGA) is an ester formed between caffeic acid and quinic acid, and is widely available in many food products, especially in coffee, blueberries and eggplant[27,28] and can even be purchased as diet supplement capsules containing 50% CGA. CGA is an excellent natural scavenger of free radicals because the one-electron oxidation product of CGA formed by the reaction with free radicals is rapidly broken down to products that cannot generate further free radicals[29].
We previously tested 19 antioxidants to evaluate their effect on expression of DNA repair proteins[30]. Only chlorogenic acid (CGA) and its metabolic derivatives increased expression of two DNA repair enzymes in that study. In our previous report on our new diet-related mouse model of colon cancer[9], CGA, fed to mice at a level equivalent to three cups of coffee a day for humans, substantially reduced the incidence of colon cancer for mice fed diet + DOC. Here, CGA in the diet largely prevented the reduction in protein expression of DNA repair protein ERCC1, central to repair of oxidative damage to DNA, that otherwise occurs with feeding mice diet + DOC.
Beclin-1 is a central player in autophagy. The modulation of autophagy is now recognized as one of the hallmarks of human cancer cells. Accumulating evidence indicates that autophagy plays a role in the various stages of tumorigenesis. Depending on the type of cancer and the context, macroautophagy can be a tumor suppressor or it can help cancer cells to overcome metabolic stress and advance[15]. In particular, beclin-1 appears to be a central player in the mechanisms that control the level of p53. In addition, beclin-1 activates the autophagic pathway and this contributes to apoptosis resistance, which might have a role in carcinogenesis[31]. In mouse colonic epithelial tissues beclin-1 was increased in mice fed diet + DOC (Figure 15B), but this increase was reduced in mice fed diet + DOC + CGA (Figure 15C).
Four major signaling pathways are frequently altered in the later stages of progression to sporadic human colon cancer, and three other pathways have also been identified. The most frequent pathways are Wnt/beta-catenin, TGF-beta receptor, Notch, and Hedgehog, while the other pathways are the EGFR, RAS/RAF/MAPK cascade and PI3K/Akt[32]. No one pathway is altered in all sporadic colon cancers. However, beta-catenin nuclear accumulation is found in 40% to 80% of primary human colon cancers[33,34] and in 67% of sessile serrated adenomas progressing towards human colon cancer[35]. We assessed beta-catenin and found that it is translocated into the nucleus of cells in the stem cell region of mouse colonic crypts in mice fed diet + DOC, but this translocation is reduced if CGA is also added to the diet (indicated in Figure 16).
Rosenberg et al[36], in a 2009 review of then-current mouse models of colonic carcinogenesis, noted that they lack an invasive phenotype. Corpet et al[37] noted in 2005 that most then-current rodent models of colonic carcinogenesis did not share several significant genetic events and histopathological features of human colon cancers.
In the New Western diet (NWD)[38] mouse model of colon cancer (based on a diet deficient in calcium, vitamin D3, fiber, methionine and choline, plus increased corn oil) mice developed the same frequency (4 out of 15 mice) of small intestinal tumors as colon tumors after 2 years on the diet. This is unlike intestinal cancers in humans where only 6% as many small intestinal cancers develop compared to the frequency of colon cancers[39]. In addition, no mice solely on the NWD developed fully invasive colonic adenocarcinomas[38].
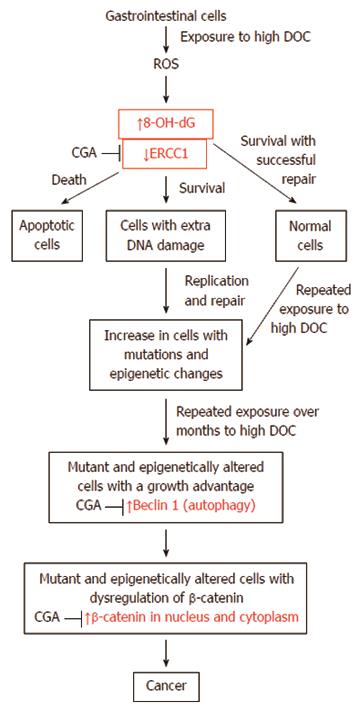
A likely pathway for progression to colon cancer is shown in Figure 18. This figure indicates presumed major steps in progression to colon cancer. The key roles of the molecular markers we evaluated in our diet-related mouse model of colon cancer are shown in red. The effect of CGA on these markers is also indicated by arrows.
Bile acids, especially DOC, cause increases in DNA damaging ROS in colon cells[40-43]. DOC-induced ROS are shown in Figure 18 as an early step in our diet-related pathway to colon cancer.
A major type of DNA damage caused by ROS is 8-OH-dG[44]. 8-OH-dG is mutagenic[45], and an initiator of carcinogenesis[14]. Thus, increased 8-OH-dG, as found by us in the epithelium of mice fed diet + DOC, is shown in Figure 18 as a key step in progression to colon cancer.
DNA damage appears to be a primary underlying cause of cancer[46]. Cells that retain unrepaired DNA damage, upon replication, may give rise to daughter cells with increased mutations by translesion synthesis[47,48]. Inaccurate or incomplete repair of DNA damages may also give rise to mutations or epigenetic alterations[49,50]. Such increased mutations and epigenetic alterations likely underlie progression to cancer, as indicated in Figure 18.
In sporadic cancers, a deficiency in DNA repair may sometimes occur due to a mutation in a DNA repair gene. However, much more frequently, reduced or absent expression of DNA repair genes occurs due to epigenetic alterations that reduce or silence gene expression. For example, for 113 colorectal cancers examined in sequence, only four had a missense mutation in the DNA repair gene MGMT, while the majority had reduced MGMT protein expression due to methylation of the MGMT promoter region (an epigenetic alteration)[51]. Similarly, out of 119 cases of mismatch repair-deficient colorectal cancers that lacked DNA repair gene PMS2 expression, PMS2 protein was deficient in 6 due to mutations in the PMS2 gene, while in 103 cases PMS2 protein expression was deficient because its pairing partner the MLH1 protein was epigenetically repressed due to promoter methylation (PMS2 protein is unstable in the absence of MLH1 protein)[52]. In the other 10 cases, loss of PMS2 protein expression was likely due to epigenetic over-expression of the microRNA, miR-155, which down-regulates MLH1 protein expression[53]. Epigenetic deficiencies in expression of DNA repair proteins are virtually always present in colon cancers[46]. Epigenetically caused DNA repair protein deficiencies and the frequencies with which they are reported in colon cancers are MSH2 (13%), MLH1 (2%-65%), WRN (38%), MGMT (46%-90%), XPF (55%), PMS2 (88%) and ERCC1 (100%)[46]. ERCC1 protein deficiency was observed in all of the 47 human colon cancers evaluated[11] and thus ERCC1 deficiency appears to be one of the most prevalent DNA repair deficiencies in progression to colon cancer in humans. ERCC1 protein was also found to be deficient in histologically normal colonic epithelial tissues in mice fed diet + DOC and progressing to colon cancer (Figure 14).
A major characteristic of cancer is the presence of genomic instability (a mutator phenotype)[54]. This may be due to deficiency of a human DNA repair enzyme, such as ERCC1[11,46]. The average colon cancer has about 60 to 70 protein altering mutations of which about 3 or 4 may be “driver” mutations[55]. However, the protein coding part of the genome is only about 1.5% of the entire genome[56]. There are also about 20000 to 80000 mutations in the entire genome of various cancers[57,58]. This compares to the very low mutation frequency of about 70 new mutations in the entire genome between generations (parent to child) in humans[59,60]. The very high mutation frequency in cancer cells may be due to the frequent epigenetic deficiencies in DNA repair genes that likely occur early in progression to cancer. This is illustrated near the top of Figure 18. ERCC1 deficiency may have a major role in genomic instability in colon cancers. In our present study, mice progressing to colon cancer are deficient in protein expression of ERCC1 in the stem cell regions of colonic crypts.
The diet-related mouse model of colon cancer described here appears to be the closest model to human development of colon cancer that is currently available. It is based on elevated colonic levels of the natural endogenous bile acid DOC, long thought (from epidemiological evidence) to be important in initiation and progression to colon cancer[6,7]. It closely parallels human progression to colon cancer, both by the gold standard of histopathology and by the molecular markers tested. This mouse model may be uniquely useful in experiments involving the prevention or treatment of colon cancer.
Colon cancer is the second most frequent cause of cancer mortality among men and women combined, in both more developed and less developed areas of the world. Diet appears to be the major factor affecting frequency of colon cancer. Up to now, however, there has not been an established diet-related rodent model that closely parallels human progression to colon cancer. Such a model is needed to have an effective basis for experiments exploring the prevention or treatment of colon cancer.
Bile acids delivered to the colon in response to a high fat diet have long been hypothesized to have a key role in development of colon cancer. In support of this hypothesis, it was recently found that the concentration of the bile acid deoxycholate in the feces of native Africans is only 1/5th as high as in African Americans, and the frequency of colorectal cancer in native Africans is less than 1/72nd the frequency of colorectal cancer in African Americans. An important area of research is to determine the molecular changes and neoplastic consequences caused by increased deoxycholate in the colon.
The study of experimental colon carcinogenesis in rodents has a long history, dating back about 70 years to an experiment of adding methylcholanthrene to the food of mice. Most studies were done with potent chemical carcinogens, which would not likely cause the same types of DNA damages that are caused by natural dietary factors. More recently, studies were also done with transgenic, knockout and knockin genetic models. In addition, a mouse model of colon cancer (based on a diet deficient in calcium, vitamin D3, fiber, methionine and choline, plus increased corn oil) was devised. A notable disadvantage of these models was that induced tumors generally lacked an invasive and metastatic phenotype, and for many models, small intestinal neoplasias were often as frequent (or more frequent) than colon cancers, unlike the situation in humans. In addition, mutational alterations frequently present in human colon cancers were often not present in artificial rodent models of colon cancer. Thus, the finding that the natural endogenous bile acid deoxycholate actually caused colon cancer in a mouse model is an important contribution. Authors consider that this model should produce the typical types of DNA damages produced in humans by high physiologic levels of bile acids. Also, this model only produces cancers in the colon, the location of almost all human intestinal cancers. Authors now show that the cancers produced are invasive and have morphological features and molecular markers consistent with those found in human progression to colon cancer.
The results of the present study indicate that this diet-related mouse model of colon cancer (with human physiologic levels of deoxycholate) will provide a more effective basis for experiments exploring the prevention or treatment of colon cancer than has previously been available.
Human physiologic levels of deoxycholate are levels of deoxycholate found in humans eating a diet high in milk fat (sour cream, butter) and beef fat, or high in corn oil. Cancer mortality is the frequency of deaths due to a particular form of cancer.
This study analyzes a novel diet-related model of colon cancer that parallels human progression to colon cancer, using both histomorphological criteria and molecular biomarkers. It also shows the ameliorating effects of dietary chlorogenic acid (a common component of blueberries, eggplant and apples) on molecular biomarkers of progression to colon cancer. This study is, undoubtedly, highly relevant for future research in human colonic cancer.
P- Reviewers: Chen P, Drew JE, Kir G, Monclova JL S- Editor: Gou SX L- Editor: A E- Editor: Wang CH
| 1. | Garcia M, Jemal A, Ward EM, Center MM, Hao Y, Siegel RL, Thun MJ. Global Cancer Facts and Figures 2007. Atlanta, GA: American Cancer Society 2007; Available from: http://www.cancer.org/research/cancerfactsfigures/globalcancerfactsfigures/global-cancer-facts-figures-2007. |
| 2. | O’Keefe SJ, Kidd M, Espitalier-Noel G, Owira P. Rarity of colon cancer in Africans is associated with low animal product consumption, not fiber. Am J Gastroenterol. 1999;94:1373-1380. [PubMed] |
| 3. | American Cancer Society. Cancer Facts and Figures 2009. Available from: http://www.cancer.org/Research/CancerFactsFigures/cancer-facts-figures-2009. |
| 4. | Maskarinec G, Noh JJ. The effect of migration on cancer incidence among Japanese in Hawaii. Ethn Dis. 2004;14:431-439. [PubMed] |
| 5. | Kono S. Secular trend of colon cancer incidence and mortality in relation to fat and meat intake in Japan. Eur J Cancer Prev. 2004;13:127-132. [PubMed] |
| 7. | Cheah PY. Hypotheses for the etiology of colorectal cancer--an overview. Nutr Cancer. 1990;14:5-13. [PubMed] |
| 8. | Ou J, DeLany JP, Zhang M, Sharma S, O’Keefe SJ. Association between low colonic short-chain fatty acids and high bile acids in high colon cancer risk populations. Nutr Cancer. 2012;64:34-40. [RCA] [PubMed] [DOI] [Full Text] [Cited by in Crossref: 89] [Cited by in RCA: 104] [Article Influence: 7.4] [Reference Citation Analysis (0)] |
| 9. | Bernstein C, Holubec H, Bhattacharyya AK, Nguyen H, Payne CM, Zaitlin B, Bernstein H. Carcinogenicity of deoxycholate, a secondary bile acid. Arch Toxicol. 2011;85:863-871. [RCA] [PubMed] [DOI] [Full Text] [Full Text (PDF)] [Cited by in Crossref: 218] [Cited by in RCA: 266] [Article Influence: 19.0] [Reference Citation Analysis (0)] |
| 10. | Buchner AM, Shahid MW, Heckman MG, Krishna M, Ghabril M, Hasan M, Crook JE, Gomez V, Raimondo M, Woodward T. Comparison of probe-based confocal laser endomicroscopy with virtual chromoendoscopy for classification of colon polyps. Gastroenterology. 2010;138:834-842. [RCA] [PubMed] [DOI] [Full Text] [Cited by in Crossref: 147] [Cited by in RCA: 144] [Article Influence: 9.6] [Reference Citation Analysis (0)] |
| 11. | Facista A, Nguyen H, Lewis C, Prasad AR, Ramsey L, Zaitlin B, Nfonsam V, Krouse RS, Bernstein H, Payne CM. Deficient expression of DNA repair enzymes in early progression to sporadic colon cancer. Genome Integr. 2012;3:3. [RCA] [PubMed] [DOI] [Full Text] [Full Text (PDF)] [Cited by in Crossref: 27] [Cited by in RCA: 35] [Article Influence: 2.7] [Reference Citation Analysis (0)] |
| 12. | Nguyen H, Loustaunau C, Facista A, Ramsey L, Hassounah N, Taylor H, Krouse R, Payne CM, Tsikitis VL, Goldschmid S. Deficient Pms2, ERCC1, Ku86, CcOI in field defects during progression to colon cancer. J Vis Exp. 2010;pii: 1931. [PubMed] |
| 13. | Creative Commons Attribution-Share Alike 3.0, allowing reuse or distribution. Available from: http://en.wikipedia.org/wiki/File: Image_of_resected_colon_segment_with_cancer_&_4_nearby_polyps_plus_schematic_of_field_defects_with_sub-clones.jpg. |
| 14. | Scott TL, Rangaswamy S, Wicker CA, Izumi T. Repair of oxidative DNA damage and cancer: recent progress in DNA base excision repair. Antioxid Redox Signal. 2014;20:708-726. [PubMed] |
| 15. | Lorin S, Hamaï A, Mehrpour M, Codogno P. Autophagy regulation and its role in cancer. Semin Cancer Biol. 2013;23:361-379. [RCA] [PubMed] [DOI] [Full Text] [Cited by in Crossref: 174] [Cited by in RCA: 195] [Article Influence: 16.3] [Reference Citation Analysis (0)] |
| 16. | Reddy S, Sanders TA, Owen RW, Thompson MH. Faecal pH, bile acid and sterol concentrations in premenopausal Indian and white vegetarians compared with white omnivores. Br J Nutr. 1998;79:495-500. [PubMed] |
| 17. | Reddy BS, Hanson D, Mangat S, Mathews L, Sbaschnig M, Sharma C, Simi B. Effect of high-fat, high-beef diet and of mode of cooking of beef in the diet on fecal bacterial enzymes and fecal bile acids and neutral sterols. J Nutr. 1980;110:1880-1887. [PubMed] |
| 18. | Thomas LA, Veysey MJ, French G, Hylemon PB, Murphy GM, Dowling RH. Bile acid metabolism by fresh human colonic contents: a comparison of caecal versus faecal samples. Gut. 2001;49:835-842. [PubMed] |
| 19. | Samuel P, Saypoi GM, Meilman E, Mosbach EH, Chafizadeh M. Absorption of bile acids from the large bowel in man. J Clin Invest. 1968;47:2070-2078. [PubMed] |
| 20. | Cortopassi GA, Wang E. There is substantial agreement among interspecies estimates of DNA repair activity. Mech Ageing Dev. 1996;91:211-218. [PubMed] |
| 21. | Katsurano M, Niwa T, Yasui Y, Shigematsu Y, Yamashita S, Takeshima H, Lee MS, Kim YJ, Tanaka T, Ushijima T. Early-stage formation of an epigenetic field defect in a mouse colitis model, and non-essential roles of T- and B-cells in DNA methylation induction. Oncogene. 2012;31:342-351. [RCA] [PubMed] [DOI] [Full Text] [Cited by in Crossref: 57] [Cited by in RCA: 59] [Article Influence: 4.2] [Reference Citation Analysis (0)] |
| 22. | Rubin H. Fields and field cancerization: the preneoplastic origins of cancer: asymptomatic hyperplastic fields are precursors of neoplasia, and their progression to tumors can be tracked by saturation density in culture. Bioessays. 2011;33:224-231. [RCA] [PubMed] [DOI] [Full Text] [Cited by in Crossref: 35] [Cited by in RCA: 41] [Article Influence: 2.9] [Reference Citation Analysis (0)] |
| 23. | Crowley-Weber CL, Payne CM, Gleason-Guzman M, Watts GS, Futscher B, Waltmire CN, Crowley C, Dvorakova K, Bernstein C, Craven M. Development and molecular characterization of HCT-116 cell lines resistant to the tumor promoter and multiple stress-inducer, deoxycholate. Carcinogenesis. 2002;23:2063-2080. [PubMed] |
| 24. | Bernstein H, Payne CM, Kunke K, Crowley-Weber CL, Waltmire CN, Dvorakova K, Holubec H, Bernstein C, Vaillancourt RR, Raynes DA. A proteomic study of resistance to deoxycholate-induced apoptosis. Carcinogenesis. 2004;25:681-692. [PubMed] |
| 25. | Bernstein H, Bernstein C, Payne CM, Dvorak K. Bile acids as endogenous etiologic agents in gastrointestinal cancer. World J Gastroenterol. 2009;15:3329-3340. [PubMed] |
| 26. | Fisher LA, Samson L, Bessho T. Removal of reactive oxygen species-induced 3’-blocked ends by XPF-ERCC1. Chem Res Toxicol. 2011;24:1876-1881. [RCA] [PubMed] [DOI] [Full Text] [Cited by in Crossref: 18] [Cited by in RCA: 25] [Article Influence: 1.8] [Reference Citation Analysis (0)] |
| 27. | Clifford MN. Chlorogenic acids and other cinnamates - nature, occurrence and dietary burden. J Sci Food Agric. 1999;79:362-372. [DOI] [Full Text] |
| 28. | Mattila P, Kumpulainen J. Determination of free and total phenolic acids in plant-derived foods by HPLC with diode-array detection. J Agric Food Chem. 2002;50:3660-3667. [RCA] [PubMed] [DOI] [Full Text] [Cited by in Crossref: 325] [Cited by in RCA: 278] [Article Influence: 12.1] [Reference Citation Analysis (0)] |
| 29. | Shibata H, Sakamoto Y, Oka M, Kono Y. Natural antioxidant, chlorogenic acid, protects against DNA breakage caused by monochloramine. Biosci Biotechnol Biochem. 1999;63:1295-1297. [RCA] [PubMed] [DOI] [Full Text] [Cited by in Crossref: 68] [Cited by in RCA: 62] [Article Influence: 2.4] [Reference Citation Analysis (0)] |
| 30. | Bernstein H, Crowley-Skillicorn C, Bernstein C, Payne CM, Dvorak K, Garewal H. Dietary compounds that enhance DNA repair and their relevance to cancer and aging. Chapter IV, 99-113. New Research on DNA Repair. USA: Nova Publishers 2007; . |
| 31. | Payne CM, Crowley-Skillicorn C, Holubec H, Dvorak K, Bernstein C, Moyer MP, Garewal H, Bernstein H. Deoxycholate, an endogenous cytotoxin/genotoxin, induces the autophagic stress-survival pathway: implications for colon carcinogenesis. J Toxicol. 2009;2009:785907. [RCA] [PubMed] [DOI] [Full Text] [Full Text (PDF)] [Cited by in Crossref: 15] [Cited by in RCA: 19] [Article Influence: 1.2] [Reference Citation Analysis (0)] |
| 32. | Saif MW, Chu E. Biology of colorectal cancer. Cancer J. 2010;16:196-201. [RCA] [PubMed] [DOI] [Full Text] [Cited by in Crossref: 97] [Cited by in RCA: 108] [Article Influence: 7.2] [Reference Citation Analysis (0)] |
| 33. | Hugh TJ, Dillon SA, O’Dowd G, Getty B, Pignatelli M, Poston GJ, Kinsella AR. beta-catenin expression in primary and metastatic colorectal carcinoma. Int J Cancer. 1999;82:504-511. [PubMed] |
| 34. | Kapiteijn E, Liefers GJ, Los LC, Kranenbarg EK, Hermans J, Tollenaar RA, Moriya Y, van de Velde CJ, van Krieken JH. Mechanisms of oncogenesis in colon versus rectal cancer. J Pathol. 2001;195:171-178. [RCA] [PubMed] [DOI] [Full Text] [Cited by in Crossref: 132] [Cited by in RCA: 138] [Article Influence: 5.8] [Reference Citation Analysis (0)] |
| 35. | Yachida S, Mudali S, Martin SA, Montgomery EA, Iacobuzio-Donahue CA. Beta-catenin nuclear labeling is a common feature of sessile serrated adenomas and correlates with early neoplastic progression after BRAF activation. Am J Surg Pathol. 2009;33:1823-1832. [RCA] [PubMed] [DOI] [Full Text] [Cited by in Crossref: 86] [Cited by in RCA: 86] [Article Influence: 5.4] [Reference Citation Analysis (0)] |
| 36. | Rosenberg DW, Giardina C, Tanaka T. Mouse models for the study of colon carcinogenesis. Carcinogenesis. 2009;30:183-196. [RCA] [PubMed] [DOI] [Full Text] [Cited by in Crossref: 269] [Cited by in RCA: 297] [Article Influence: 17.5] [Reference Citation Analysis (0)] |
| 37. | Corpet DE, Pierre F. How good are rodent models of carcinogenesis in predicting efficacy in humans? A systematic review and meta-analysis of colon chemoprevention in rats, mice and men. Eur J Cancer. 2005;41:1911-1922. [RCA] [PubMed] [DOI] [Full Text] [Cited by in Crossref: 162] [Cited by in RCA: 154] [Article Influence: 7.7] [Reference Citation Analysis (0)] |
| 38. | Newmark HL, Yang K, Kurihara N, Fan K, Augenlicht LH, Lipkin M. Western-style diet-induced colonic tumors and their modulation by calcium and vitamin D in C57Bl/6 mice: a preclinical model for human sporadic colon cancer. Carcinogenesis. 2009;30:88-92. [RCA] [PubMed] [DOI] [Full Text] [Cited by in Crossref: 140] [Cited by in RCA: 155] [Article Influence: 9.1] [Reference Citation Analysis (0)] |
| 39. | Jemal A, Siegel R, Ward E, Hao Y, Xu J, Murray T, Thun MJ. Cancer statistics, 2008. CA Cancer J Clin. 2008;58:71-96. [RCA] [PubMed] [DOI] [Full Text] [Cited by in Crossref: 8283] [Cited by in RCA: 8225] [Article Influence: 483.8] [Reference Citation Analysis (0)] |
| 40. | Craven PA, Pfanstiel J, DeRubertis FR. Role of reactive oxygen in bile salt stimulation of colonic epithelial proliferation. J Clin Invest. 1986;77:850-859. [RCA] [PubMed] [DOI] [Full Text] [Cited by in Crossref: 112] [Cited by in RCA: 120] [Article Influence: 3.1] [Reference Citation Analysis (0)] |
| 41. | Lechner S, Müller-Ladner U, Schlottmann K, Jung B, McClelland M, Rüschoff J, Welsh J, Schölmerich J, Kullmann F. Bile acids mimic oxidative stress induced upregulation of thioredoxin reductase in colon cancer cell lines. Carcinogenesis. 2002;23:1281-1288. [RCA] [PubMed] [DOI] [Full Text] [Cited by in Crossref: 64] [Cited by in RCA: 70] [Article Influence: 3.0] [Reference Citation Analysis (0)] |
| 42. | Payne CM, Weber C, Crowley-Skillicorn C, Dvorak K, Bernstein H, Bernstein C, Holubec H, Dvorakova B, Garewal H. Deoxycholate induces mitochondrial oxidative stress and activates NF-kappaB through multiple mechanisms in HCT-116 colon epithelial cells. Carcinogenesis. 2007;28:215-222. [RCA] [PubMed] [DOI] [Full Text] [Cited by in Crossref: 111] [Cited by in RCA: 133] [Article Influence: 7.0] [Reference Citation Analysis (0)] |
| 43. | Longpre JM, Loo G. Protection of human colon epithelial cells against deoxycholate by rottlerin. Apoptosis. 2008;13:1162-1171. [RCA] [PubMed] [DOI] [Full Text] [Cited by in Crossref: 19] [Cited by in RCA: 21] [Article Influence: 1.2] [Reference Citation Analysis (0)] |
| 44. | Valavanidis A, Vlachogianni T, Fiotakis C. 8-hydroxy-2’ -deoxyguanosine (8-OHdG): A critical biomarker of oxidative stress and carcinogenesis. J Environ Sci Health C Environ Carcinog Ecotoxicol Rev. 2009;27:120-139. [RCA] [PubMed] [DOI] [Full Text] [Cited by in Crossref: 1221] [Cited by in RCA: 1372] [Article Influence: 85.8] [Reference Citation Analysis (0)] |
| 45. | Delaney S, Jarem DA, Volle CB, Yennie CJ. Chemical and biological consequences of oxidatively damaged guanine in DNA. Free Radic Res. 2012;46:420-441. [RCA] [PubMed] [DOI] [Full Text] [Cited by in Crossref: 74] [Cited by in RCA: 73] [Article Influence: 5.6] [Reference Citation Analysis (0)] |
| 46. | Bernstein C, Prasad AR, Nfonsam V, Bernstein H. DNA Damage, DNA Repair and Cancer. New Research Directions in DNA Repair. USA: InTech 2013; . |
| 47. | Kunz BA, Ramachandran K, Vonarx EJ. DNA sequence analysis of spontaneous mutagenesis in Saccharomyces cerevisiae. Genetics. 1998;148:1491-1505. [PubMed] |
| 48. | Stuart GR, Oda Y, de Boer JG, Glickman BW. Mutation frequency and specificity with age in liver, bladder and brain of lacI transgenic mice. Genetics. 2000;154:1291-1300. [PubMed] |
| 49. | Cuozzo C, Porcellini A, Angrisano T, Morano A, Lee B, Di Pardo A, Messina S, Iuliano R, Fusco A, Santillo MR. DNA damage, homology-directed repair, and DNA methylation. PLoS Genet. 2007;3:e110. [RCA] [PubMed] [DOI] [Full Text] [Full Text (PDF)] [Cited by in Crossref: 135] [Cited by in RCA: 151] [Article Influence: 8.9] [Reference Citation Analysis (0)] |
| 50. | O’Hagan HM, Mohammad HP, Baylin SB. Double strand breaks can initiate gene silencing and SIRT1-dependent onset of DNA methylation in an exogenous promoter CpG island. PLoS Genet. 2008;4:e1000155. [RCA] [PubMed] [DOI] [Full Text] [Full Text (PDF)] [Cited by in Crossref: 273] [Cited by in RCA: 289] [Article Influence: 17.0] [Reference Citation Analysis (0)] |
| 51. | Halford S, Rowan A, Sawyer E, Talbot I, Tomlinson I. O(6)-methylguanine methyltransferase in colorectal cancers: detection of mutations, loss of expression, and weak association with G: C& gt; A: T transitions. Gut. 2005;54:797-802. [RCA] [PubMed] [DOI] [Full Text] [Cited by in Crossref: 39] [Cited by in RCA: 43] [Article Influence: 2.2] [Reference Citation Analysis (0)] |
| 52. | Truninger K, Menigatti M, Luz J, Russell A, Haider R, Gebbers JO, Bannwart F, Yurtsever H, Neuweiler J, Riehle HM. Immunohistochemical analysis reveals high frequency of PMS2 defects in colorectal cancer. Gastroenterology. 2005;128:1160-1171. [RCA] [PubMed] [DOI] [Full Text] [Cited by in Crossref: 136] [Cited by in RCA: 132] [Article Influence: 6.6] [Reference Citation Analysis (0)] |
| 53. | Valeri N, Gasparini P, Fabbri M, Braconi C, Veronese A, Lovat F, Adair B, Vannini I, Fanini F, Bottoni A. Modulation of mismatch repair and genomic stability by miR-155. Proc Natl Acad Sci USA. 2010;107:6982-6987. [RCA] [PubMed] [DOI] [Full Text] [Cited by in Crossref: 263] [Cited by in RCA: 262] [Article Influence: 17.5] [Reference Citation Analysis (0)] |
| 54. | Schmitt MW, Prindle MJ, Loeb LA. Implications of genetic heterogeneity in cancer. Ann N Y Acad Sci. 2012;1267:110-116. [RCA] [PubMed] [DOI] [Full Text] [Cited by in Crossref: 47] [Cited by in RCA: 45] [Article Influence: 3.5] [Reference Citation Analysis (0)] |
| 55. | Vogelstein B, Papadopoulos N, Velculescu VE, Zhou S, Diaz LA, Kinzler KW. Cancer genome landscapes. Science. 2013;339:1546-1558. [RCA] [PubMed] [DOI] [Full Text] [Cited by in Crossref: 5906] [Cited by in RCA: 5595] [Article Influence: 466.3] [Reference Citation Analysis (0)] |
| 56. | Lander ES, Linton LM, Birren B, Nusbaum C, Zody MC, Baldwin J, Devon K, Dewar K, Doyle M, FitzHugh W. Initial sequencing and analysis of the human genome. Nature. 2001;409:860-921. [RCA] [PubMed] [DOI] [Full Text] [Cited by in Crossref: 16054] [Cited by in RCA: 15084] [Article Influence: 628.5] [Reference Citation Analysis (0)] |
| 57. | Yost SE, Smith EN, Schwab RB, Bao L, Jung H, Wang X, Voest E, Pierce JP, Messer K, Parker BA. Identification of high-confidence somatic mutations in whole genome sequence of formalin-fixed breast cancer specimens. Nucleic Acids Res. 2012;40:e107. [RCA] [PubMed] [DOI] [Full Text] [Full Text (PDF)] [Cited by in Crossref: 70] [Cited by in RCA: 69] [Article Influence: 5.3] [Reference Citation Analysis (0)] |
| 58. | Pleasance ED, Cheetham RK, Stephens PJ, McBride DJ, Humphray SJ, Greenman CD, Varela I, Lin ML, Ordóñez GR, Bignell GR. A comprehensive catalogue of somatic mutations from a human cancer genome. Nature. 2010;463:191-196. [RCA] [PubMed] [DOI] [Full Text] [Cited by in Crossref: 1350] [Cited by in RCA: 1255] [Article Influence: 83.7] [Reference Citation Analysis (0)] |
| 59. | Roach JC, Glusman G, Smit AF, Huff CD, Hubley R, Shannon PT, Rowen L, Pant KP, Goodman N, Bamshad M. Analysis of genetic inheritance in a family quartet by whole-genome sequencing. Science. 2010;328:636-639. [RCA] [PubMed] [DOI] [Full Text] [Full Text (PDF)] [Cited by in Crossref: 876] [Cited by in RCA: 759] [Article Influence: 50.6] [Reference Citation Analysis (0)] |
| 60. | Campbell CD, Chong JX, Malig M, Ko A, Dumont BL, Han L, Vives L, O’Roak BJ, Sudmant PH, Shendure J. Estimating the human mutation rate using autozygosity in a founder population. Nat Genet. 2012;44:1277-1281. [RCA] [PubMed] [DOI] [Full Text] [Full Text (PDF)] [Cited by in Crossref: 175] [Cited by in RCA: 155] [Article Influence: 11.9] [Reference Citation Analysis (0)] |


