Published online Apr 15, 2023. doi: 10.4251/wjgo.v15.i4.644
Peer-review started: November 24, 2022
First decision: January 23, 2023
Revised: February 18, 2023
Accepted: March 15, 2023
Article in press: March 15, 2023
Published online: April 15, 2023
Processing time: 138 Days and 20.3 Hours
The expression of brain cytoplasmic RNA1 (BCYRN1) is linked to the clinico
To explore the prognostic value and immunotherapeutic potential of BCYRN1 in HCC by bioinformatics and meta-analysis.
Information was obtained from the Cancer Genome Atlas database. First, the correlation between BCYRN1 expression and prognosis and clinicopathologic characteristics of HCC patients was explored. Univariate and multivariate regression analyses were employed to examine the relationship between BCYRN1 and HCC prognosis. Secondly, potential functions and pathways were explored by means of enrichment analysis of differentially-expressed genes. The relationships between BCYRN1 expression and tumor microenvironment, immune cell infiltration, immune checkpoint, drug sensitivity and immunotherapy effect were also investigated. Finally, three major databases were searched and used to conduct a meta-analysis on the relationship between BCYRN1 expression and patient prognosis.
BCYRN1 expression was significantly higher in HCC compared to normal tissues and was linked to a poor prognosis and clinicopathological characteristics. Enrichment analysis showed that BCYRN1 regulates the extracellular matrix and transmission of signaling molecules, participates in the metabolism of nutrients, such as proteins, and participates in tumor-related pathways. BCYRN1 expression was linked to the tumor microenvironment, immune cell infiltration, drug sensitivity and the efficacy of immunotherapy. Furthermore, the meta-analysis in this study showed that BCYRN1 overexpression was related to a worse outcome in HCC patients.
Overexpression of BCYRN1 relates to poor prognosis and may be a potential prognostic factor and immunotherapeutic target in HCC.
Core Tip: In this study, we combined the research methods of meta-analysis and bioinformatics analysis to comprehensively analyze and explore the prognostic value of brain cytoplasmic RNA1 (BCYRN1) in hepatocellular carcinoma (HCC) and the prospects of immunotherapy. Our study found that overexpression of BCYRN1 was significantly associated with poor prognosis in HCC patients and may be an independent prognostic factor for HCC and a target for immunotherapy.
- Citation: Han XY, Li X, Zhao RY, Ma HZ, Yu M, Niu XD, Jin HJ, Wang YF, Liu DM, Cai H. Comprehensive analysis of prognostic value and immunotherapy prospect of brain cytoplasmic RNA1 in hepatocellular carcinoma. World J Gastrointest Oncol 2023; 15(4): 644-664
- URL: https://www.wjgnet.com/1948-5204/full/v15/i4/644.htm
- DOI: https://dx.doi.org/10.4251/wjgo.v15.i4.644
Hepatocellular carcinoma (HCC) is one of the most common types of cancer worldwide and has a high mortality rate[1]. Relevant statistics have shown that the number of new liver cancer cases worldwide was about 9 million in the year 2020, of which the most common type was HCC. HCC is the third-leading cause of cancer-related deaths worldwide, with a 5-year survival rate of less than 20%[2,3]. Early detection of HCC can achieve a good 5-year survival rate by surgical treatment[4], liver transplantation and radiotherapy. However, the symptoms of patients with early HCC are not apparent. Therefore, most patients are diagnosed in the advanced stage. Since only systemic chemotherapy can delay progression, the prognosis is very poor[5]. Therefore, early diagnosis and treatment is particularly important. Identifying novel sensitive tumor markers and discovering novel molecular therapeutic targets are key goals, and exploring novel immunotherapeutic drugs is another breakthrough[6,7].
With the progress of high-throughput sequencing technology, research on long non-coding RNA (lncRNA) has developed rapidly in the field of bioinformatics, especially in oncology[8]. LncRNAs are generally longer than 200 nucleotides and do not encode proteins[9]. An increasing number of studies have shown that lncRNAs can influence gene expression at translational and transcriptional levels by chromatin remodeling, affecting RNA splicing and controlling the transmission of signaling pathways[10,11]. In addition, lncRNA affects tumor and immune cell metabolism, remodeling of the immune microenvironment and promoting carcinogenesis[12]. Abnormal expression of lncRNAs can affect biological processes, including tumor cell growth, migration, invasion, angiogenesis and metastasis, which are linked to the occurrence and prognosis of various types of cancer and has a broad research prospect[13,14].
Brain cytoplasmic RNA1 (BCYRN1), also known as brain cytoplasmic 200 (BC200), is mainly present in neurons, and abnormal expression of BCYRN1 is associated with neurodegenerative diseases and malignant tumors[15]. It has previously been shown that compared with surrounding normal tissues, BCYRN1 is overexpressed in a number of cancer types[16,17], including gastric cancer[18,19], bladder cancer[20,21], colorectal cancer[22-25] and HCC[26-28]. Furthermore, BCYRN1 overexpression is closely related to poor patient prognosis[15]. Therefore, BCYRN1 is a potential cancer therapeutic target and tumor prognostic marker[29]. To further clarify the prognostic value of BCYRN1 in HCC and the prospects of immunotherapy, data related to HCC was obtained from the Cancer Genome Atlas (TCGA), and bioinformatics analysis was performed. First, expression levels of BCYRN1 were explored in normal liver tissues and HCC and differences in survival prognosis between the low and high expression groups of BCYRN1 were analyzed. Second, the relationship between the BCYRN1 expression level and clinicopathologic characteristics in HCC patients was investigated. Univariate and multi
Gene expression data and information on clinical features from 50 normal tissue samples and 374 liver hepatocellular carcinoma (LIHC) samples were obtained from the TCGA database (https://portal.gdc.cancer.gov/). Subsequent analyses and mapping were performed on this dataset. Because the TCGA database is freely accessible, ethics committee approval was not required for this study.
A uniformly normalized pan-cancer dataset was downloaded using the University of California Santa Cruz database (https://xenabrowser.net/), expression information of BCYRN1 in every sample was obtained, and the expression difference plots of BCYRN1 in pan-cancer was mapped through the online bioinformatics analysis website Sangerbox (http://sangerbox.com/, based on TCGA and GTEx databases). R software (R 4.1.3 version) was utilized to analyze the expression differences of BCYRN1 in HCC using R packages “limma,” “ggplot2” and “ggpubr.” Boxplots were plotted, and difference plots of expression differences were paired.
The online database GEPIA2 (http://gepia2.cancer-pku.cn) was used to evaluate the relationship between BCYRN1 gene expression levels and survival prognosis of HCC patients. Second, the data downloaded from TCGA were analyzed using the “survival” and “survminer” R packages, and Kaplan-Meier (KM) curves were plotted to show the association of BCYRN1 expression with progression-free survival (PFS) and overall survival (OS). Finally, receiver operating characteristic (ROC) curves were plotted to assess the predictive value of BCYRN1 expression for different prognosis years using the “timeROC” R package.
The associations between BCYRN1 and HCC clinicopathology (age, gender, tumor stage, T stage, M stage, histological grade) were analyzed using the “limma” and “ggpubr” R packages using previously downloaded clinical information from the TCGA database. Finally, a heatmap of clinical relevance was plotted using the R package “ComplexHeatmap.”
First, the R package “survival” was used to accomplish univariate regression analysis and multivariate COX regression analysis of the expression of BCYRN1 with clinicopathological information and survival information of HCC patients. Then, forest plots were drawn to determine independent prognostic indicators of HCC. Second, the R packages “survival,” “rms” and “regplot” were used to summarize the clinical and prognostic information of patients. Nomograms were drawn to predict 5-year, 3-year and 1-year OS rates of HCC patients. To evaluate the accuracy of the prediction model, a calibration curve of the nomogram was drawn.
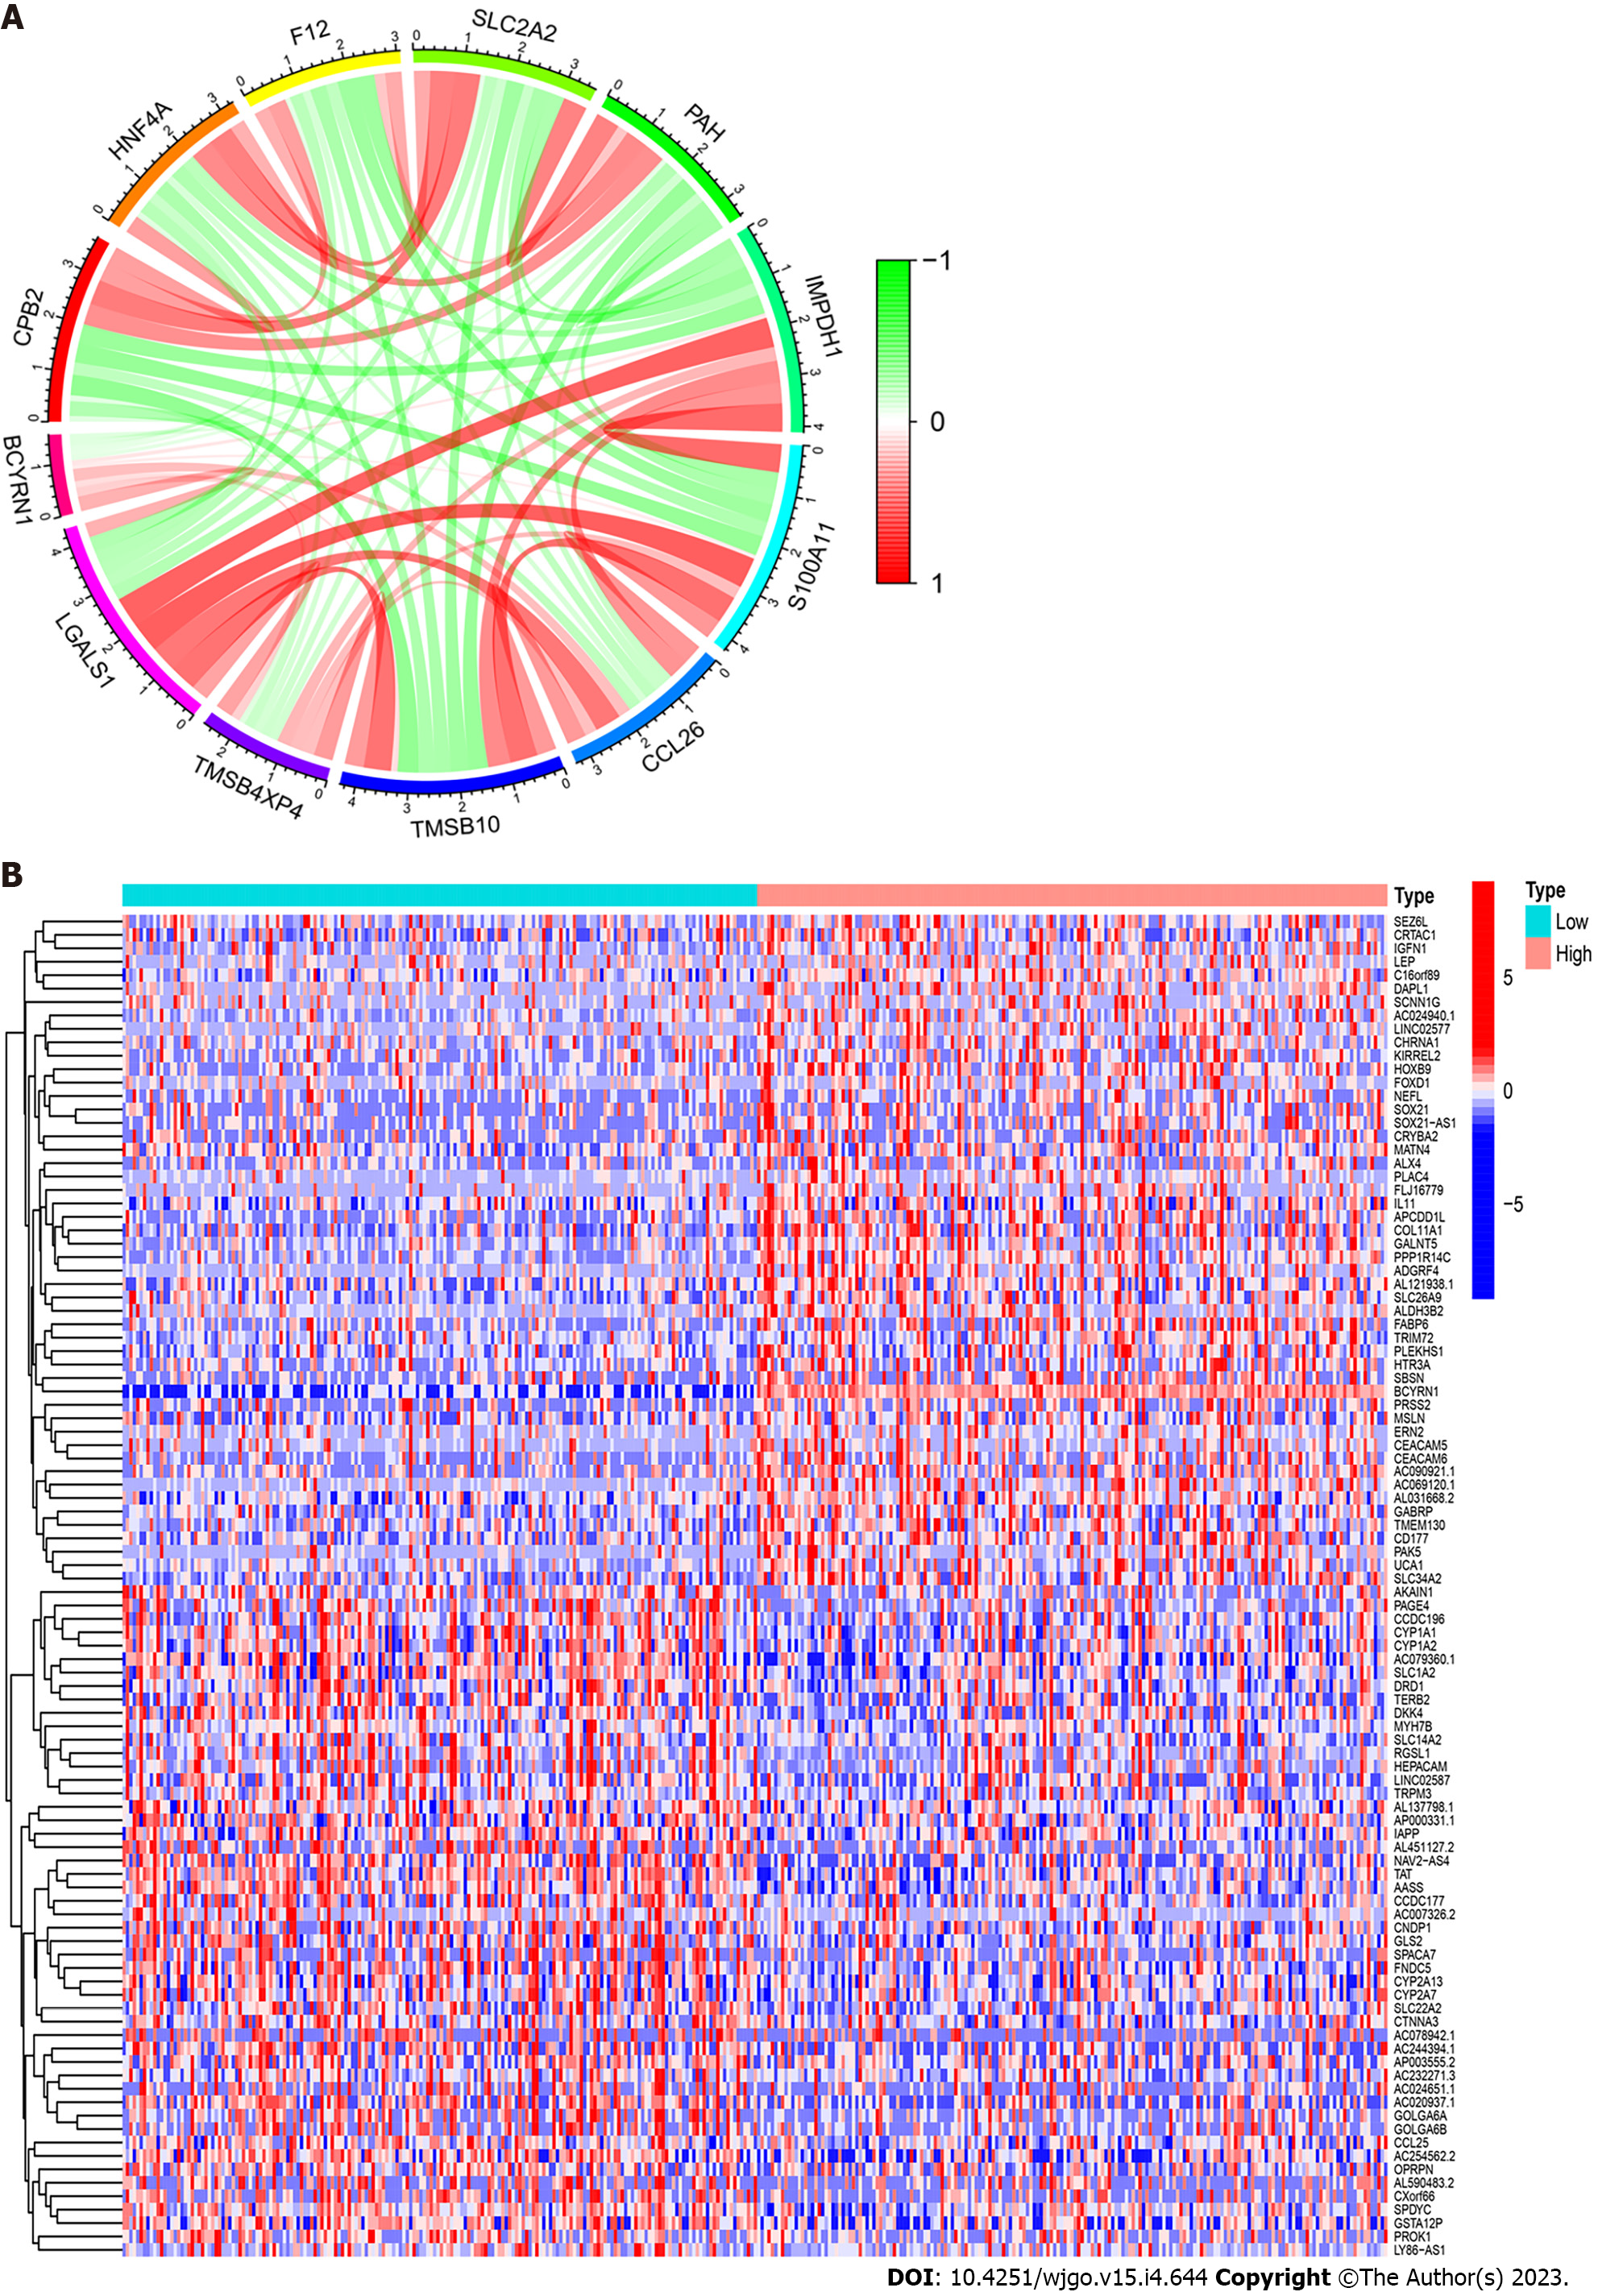
In this study, co-expression analysis was performed using the “Pearson” method with four R packages, “limma,” “ggplot2,” “ggpubr” and “ggExtra.” A certain index was set to screen focused co-expressed genes (correlation coefficient > 0.5, P < 0.001) after which visual analysis was performed. Twelve genes with the strongest correlation were selected from the co-expressed genes, and the co-expression circles were plotted using the “circlizeand” and “corrplot” R packages. Finally, BCYRN1 expression was divided into low and high expression groups using the R package “limma,” and screening conditions were set (false discovery rate < 0.05 and log2 foldchange > 1). Next, the DEGs in the groups were screened, and 50 upregulated and downregulated genes were selected, visualized using the “pheatmap” R package. A heat map of differential expression was drawn.
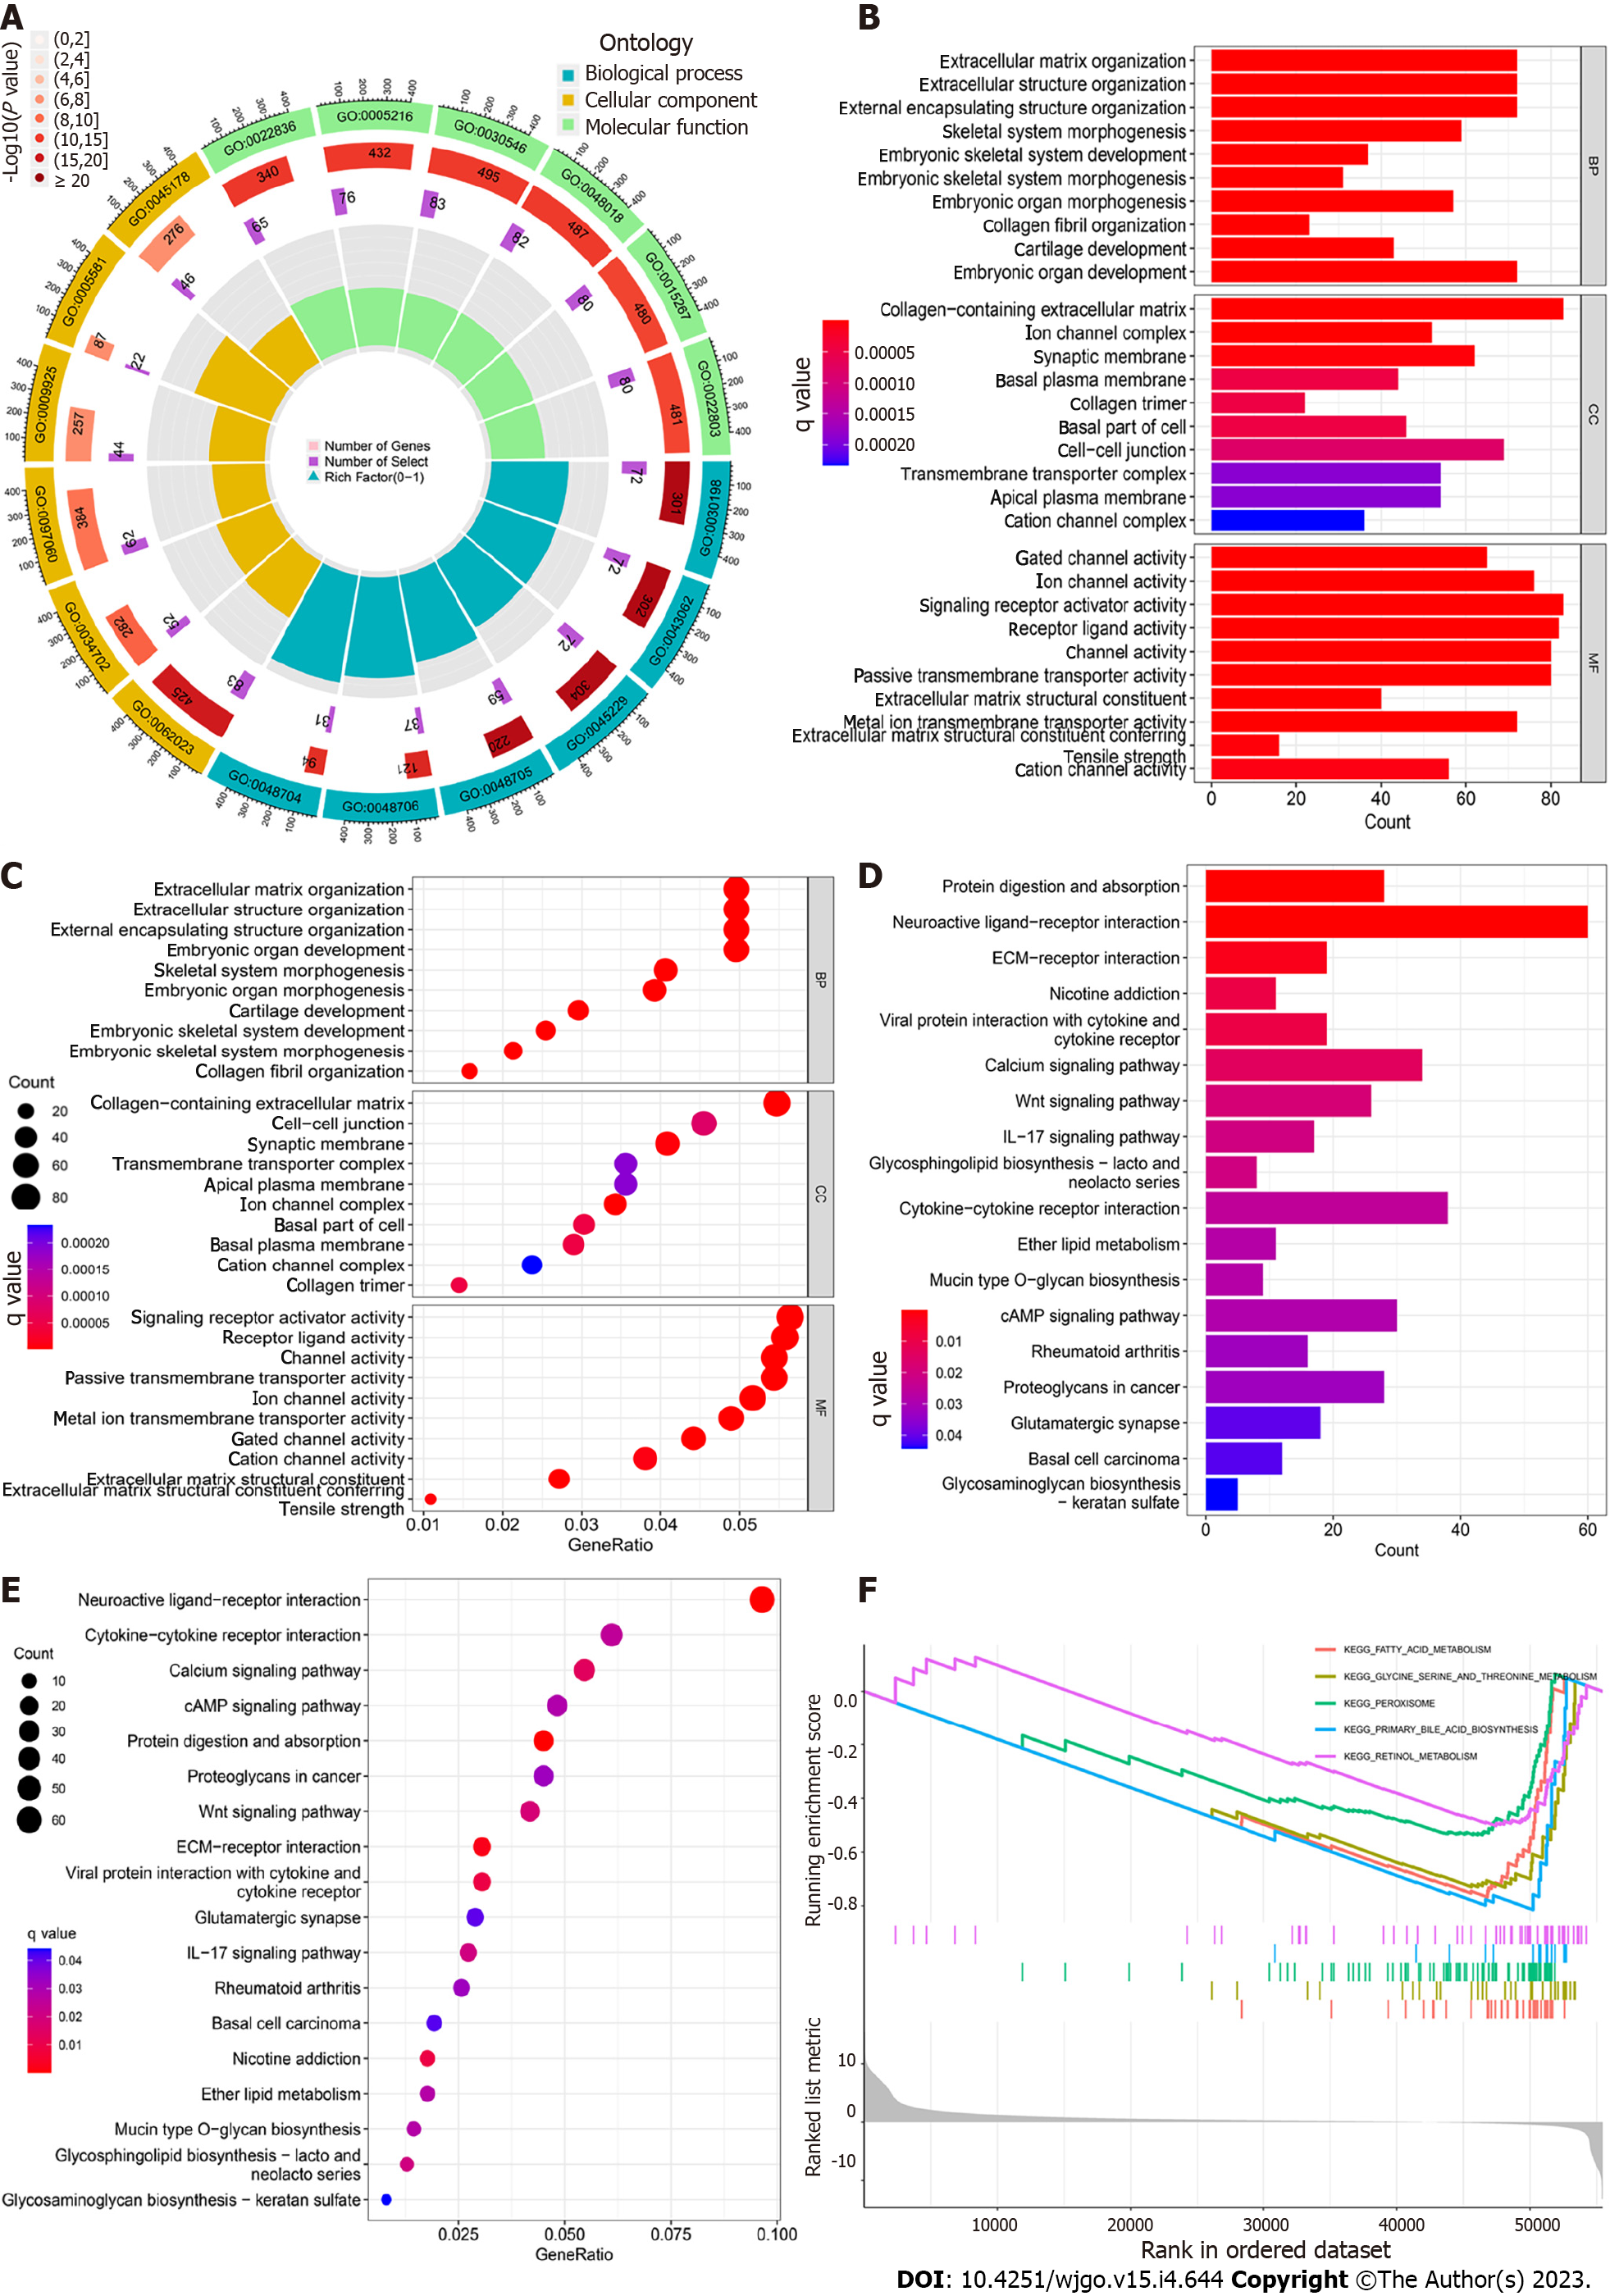
To explore the possible enriched signaling pathways and related functions, gene ontology (GO) and Kyoto Encyclopedia of Genes and Genomes (KEGG) enrichment analysis of BCYRN1-related DEGs were conducted using a series of R packages (“clusterProfile,” “org.Hs.eg.db,” “circlize,” “RColorBrewer,” “enrichplot,” “dplyr,” “ComplexHeatmap”). The filter condition P value filter was set to 0.05. In this process, a histogram, bubble diagram and GO circle diagram were drawn. Finally, the possible enriched functions and pathways of BCYRN1-associated DEGs were further explored using HCC using Gene Set Enrichment Analysis (GSEA).
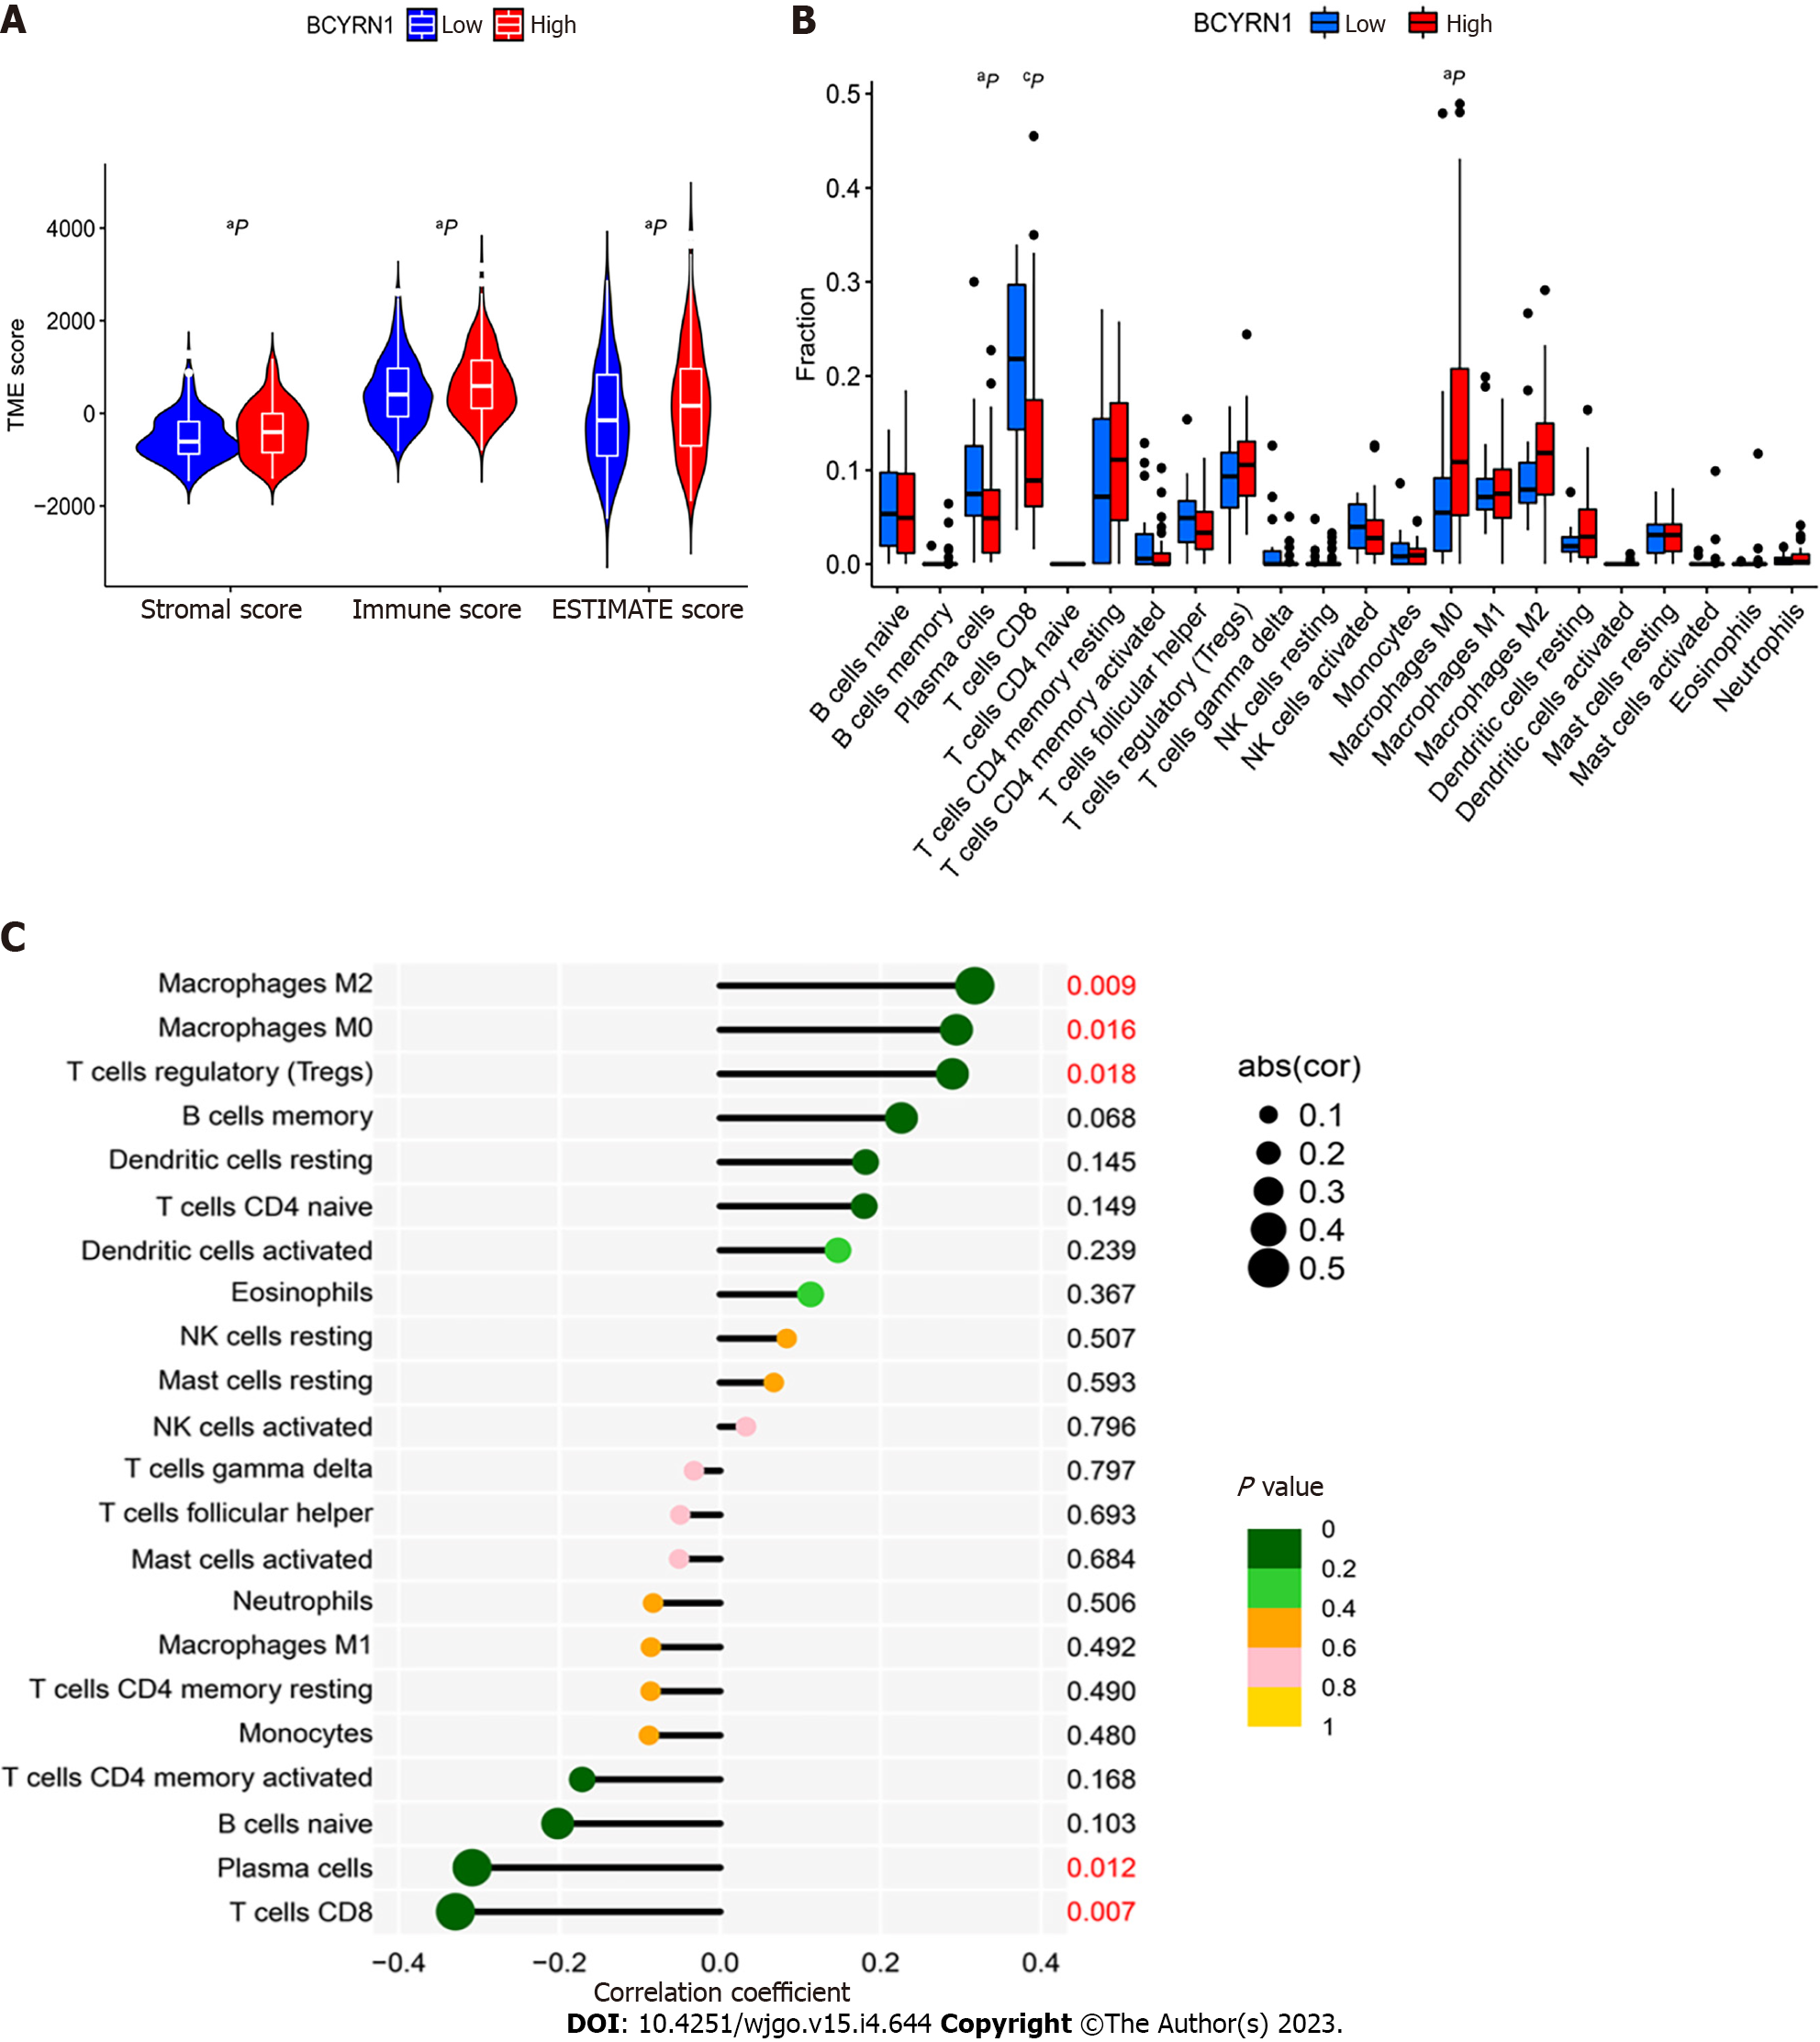
Previously downloaded HCC-related expression data were entered, the scores of immune cells and stromal cells of HCC-related samples were calculated utilizing the “limma” and “estimate” R package, and the scores of the two cells were added to obtain a comprehensive score “ESTIMATEScore.” The “reshape2” and “ggpubr” R packages were used to plot the resulting TME scores into violin plots for TME difference analysis between low and high BCYRN1 expression groups. The R packages “limma” and “CIBERSORT” were used to compute the percentage composition of 22 immune cells in each sample. Next, the “reshape2,” “vioplot” and “ggExtra” R packages were used to draw boxplots and correlation scatterplots of immune cell differences. Finally, lollipops were plotted according to the sorted correlation results.
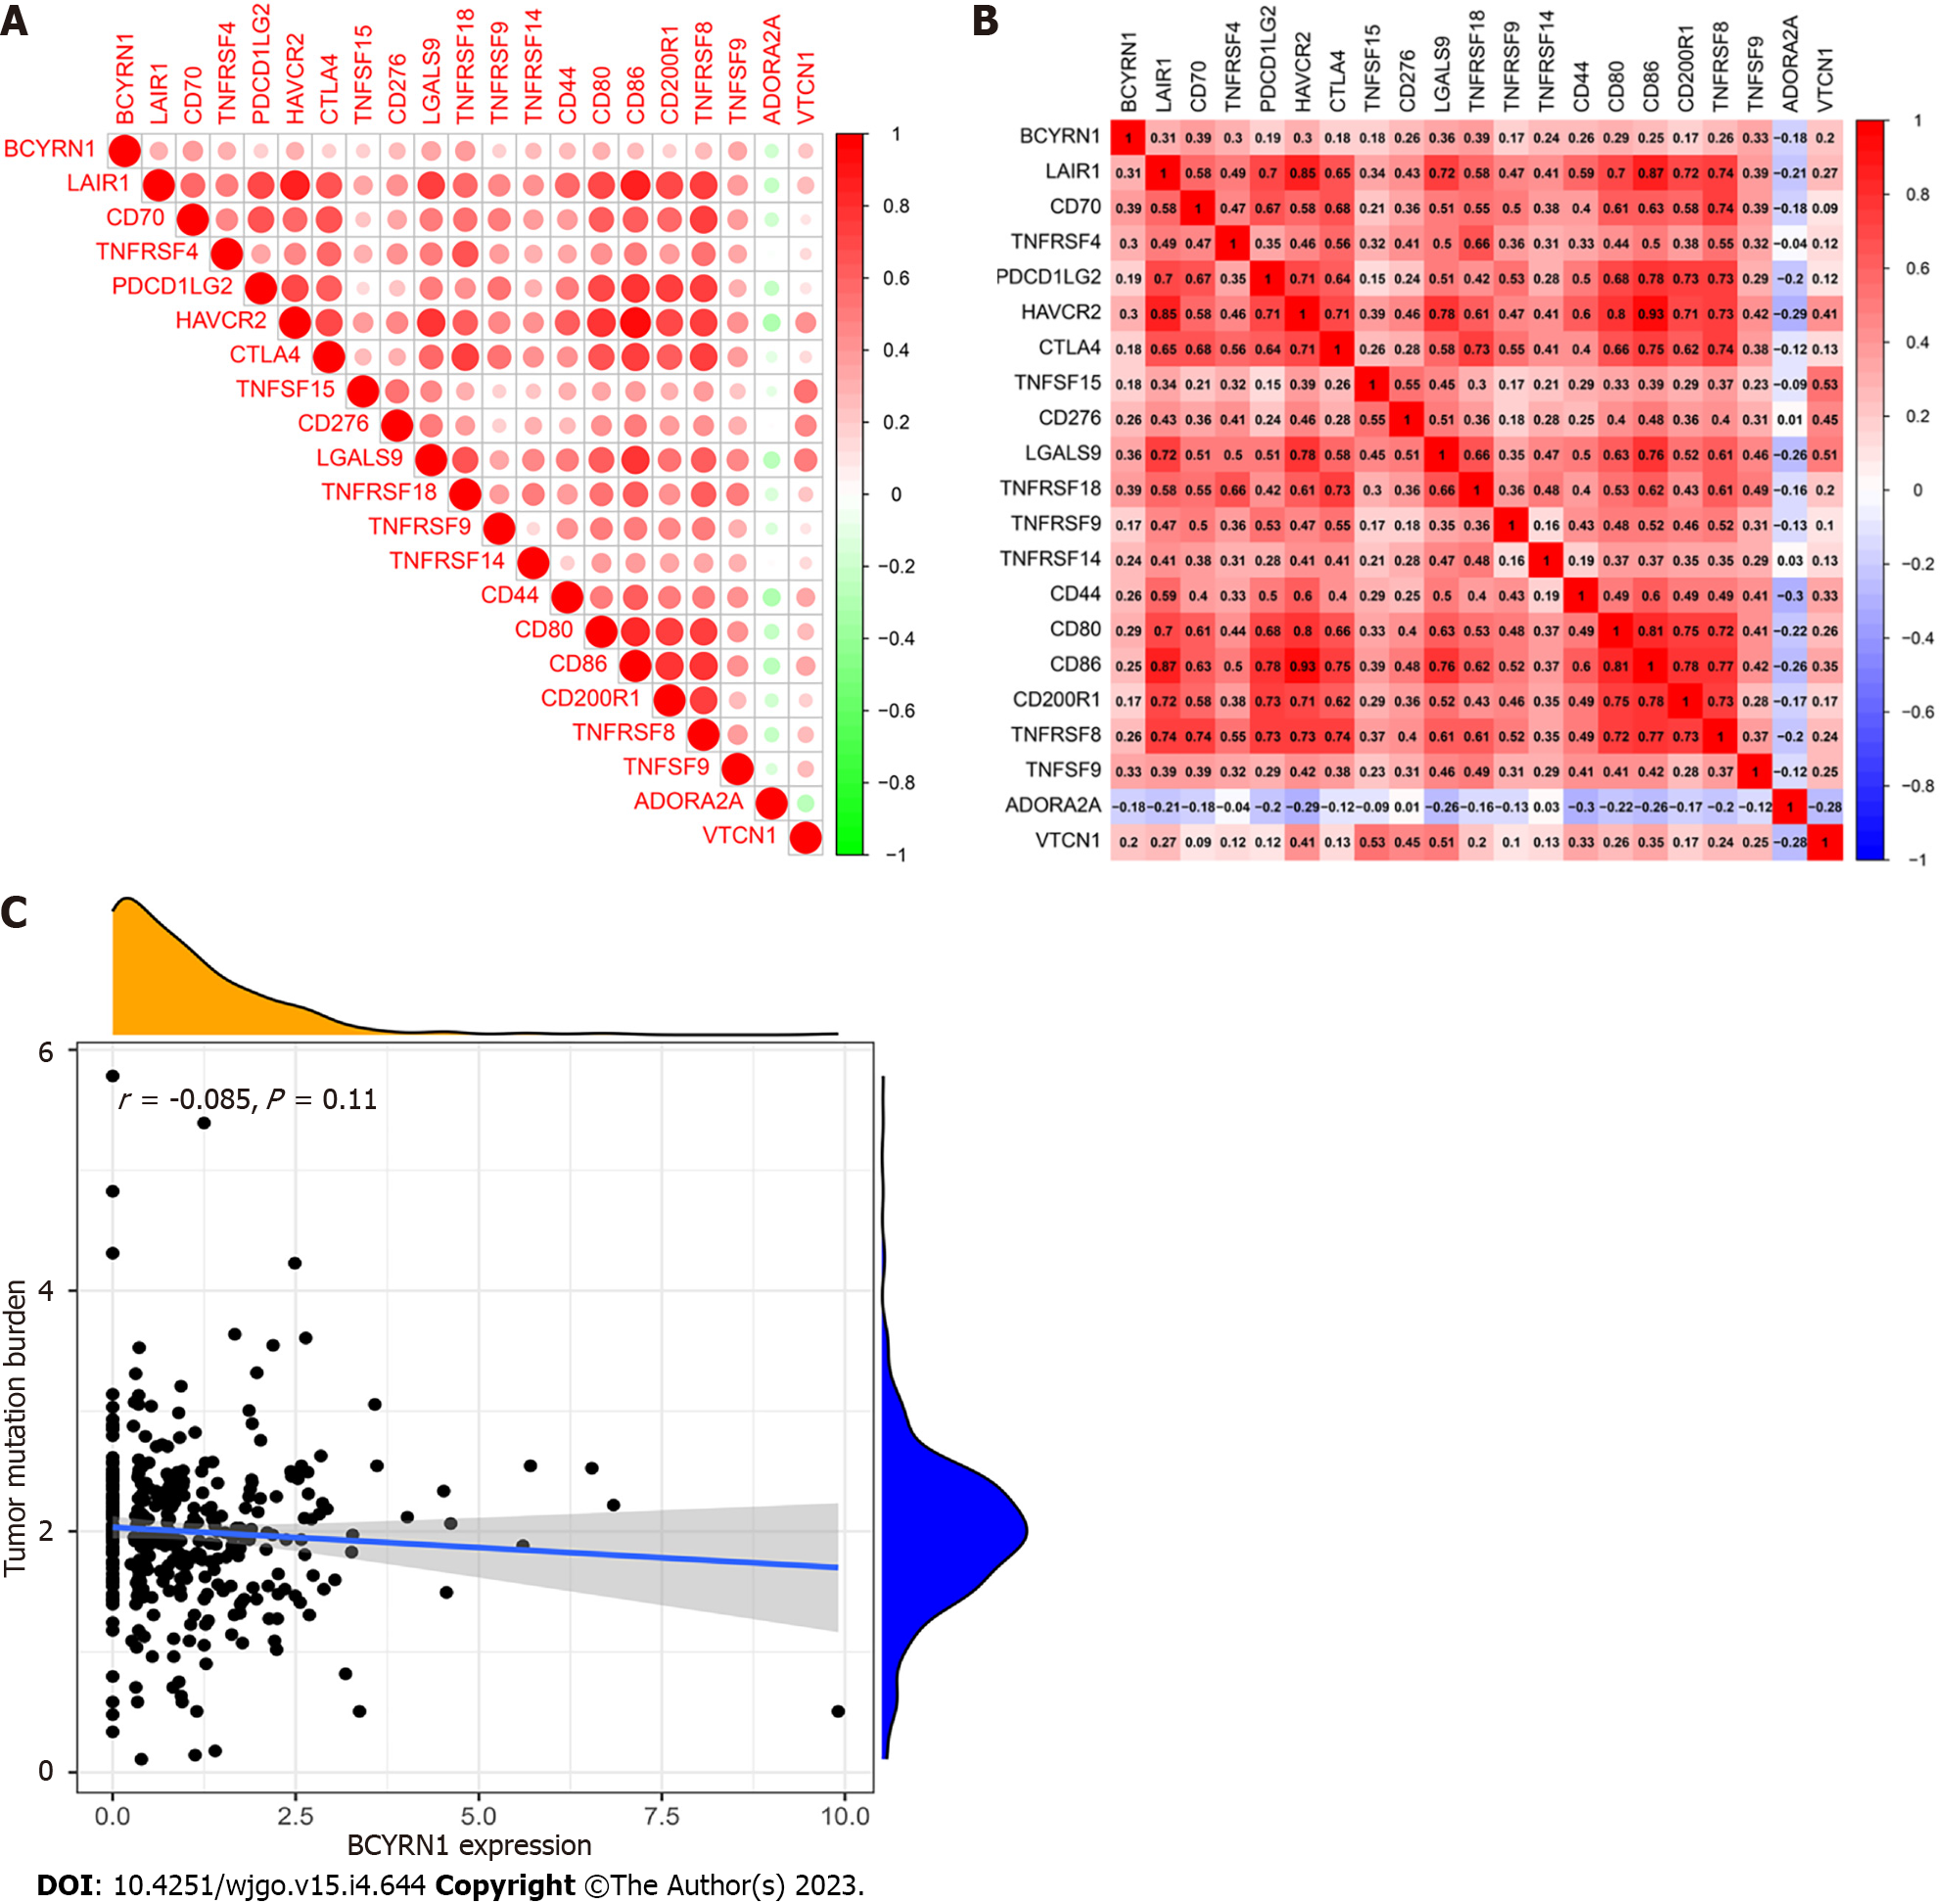
Immune checkpoint genes associated with BCYRN1 were selected using the “reshape2,” “ggplot2,” “ggpubr” and “corrplot” R packages. A correlation coefficient of P < 0.001 was set as the screening filter based on the downloaded gene expression data and immune checkpoint-related gene lists of HCC samples, and circular correlation heat maps and rectangular correlation heat maps were plotted, respectively. Then, the R package “ggExtra” was utilized to explore the correlation between the expression of BCYRN1 and TMB based on genetic tumor mutation load files, and scatter plots of the correlation were drawn.
The R package “pRRophetic” was utilized to compute the half-maximal inhibitory concentration (IC50) of the drug based on downloaded gene expression data, and P = 0.001 was set as a filtering condition. Next, the calculation results were visualized as a difference boxplot using the R packages “ggplot2” and “ggpubr”. The corresponding IC50 differences between the low and high BCYRN1 expression groups were assessed from the boxplots to determine the sensitivity differences of anticancer drugs. Next, HCC-related immunotherapy-related data were downloaded from the Cancer Immunome Atlas database (https://tcia.at/). The scores of immunotherapy in the low and high expression groups of BCYRN1 were analyzed using the “limma” and “ggpubr” R packages, and differential violin plots were drawn.
Searches were conducted as required by PRISMA guidelines[30]. With a cutoff date of October 2022, three English databases, Web of Science, PubMed, and EMBASE, were used to search for relevant studies on BCYRN1 in HCC. The search keywords used were: (“BCYRN1” OR “BC200a” OR “LINC00004” OR “BC200” OR “Brain cytoplasmic RNA1”) AND (“Hepatocellular carcinoma” OR “HCC” OR “Liver cancer”). Two authors independently performed the search, and disagreements were resolved by discussion.
Inclusion criteria: (1) Patients diagnosed with HCC; (2) The target gene studied was BCYRN1; (3) The expression level of BCYRN1 was detected by quantitative real-time polymerase chain reaction (qRT-PCR); and (4) According to the expression level of BCYRN1 in HCC tissues, patients were separated into a low expression group and a high expression group. Survival hazard ratios (HRs) and the 95%CI were obtained by KM curves or multivariate regression analysis. Exclusion criteria: (1) Repeated studies; (2) The disease type was not HCC; (3) The target gene investigated was not BCYRN1; (3) The types of studies were reviews, meta-analyses, conference abstracts, letters and case reports; (4) Articles that did not focus on survival prognosis and focused on biological functions or mechanisms; and (5) Lack of HR or KM survival curves.
The following information was extracted from the literature: First author’s name, country or region, publication time, sample size, method of RNA detection, cutoff values for high and low expression, source of HR values, HR with 95%CI and follow-up time. If the HR of BCYRN1 was acquired by multivariate regression analysis in the study, it was extracted directly. Otherwise, it was indirectly derived by utilizing the Engauge Digitizer tool program from KM survival curves. Articles included were graded according to the Newcastle-Ottawa scale (NOS) and were considered eligible if they scored 6 or higher.
Stata12.0 software was used to analyze the extracted data. Forest plots were plotted to combine the extracted HR and 95%CI, and heterogeneity was assessed across studies by calculating I2 values. HR was combined using a fixed effects model if I2 was less than 50%, thereby indicating that no obvious heterogeneity existed between studies, and a random effects model if I2 was greater than or equal to 50%. Begg’s test was used to evaluate publication bias, and sensitivity analysis was performed to investigate the stability of the results. P < 0.05 was considered statistically significant.
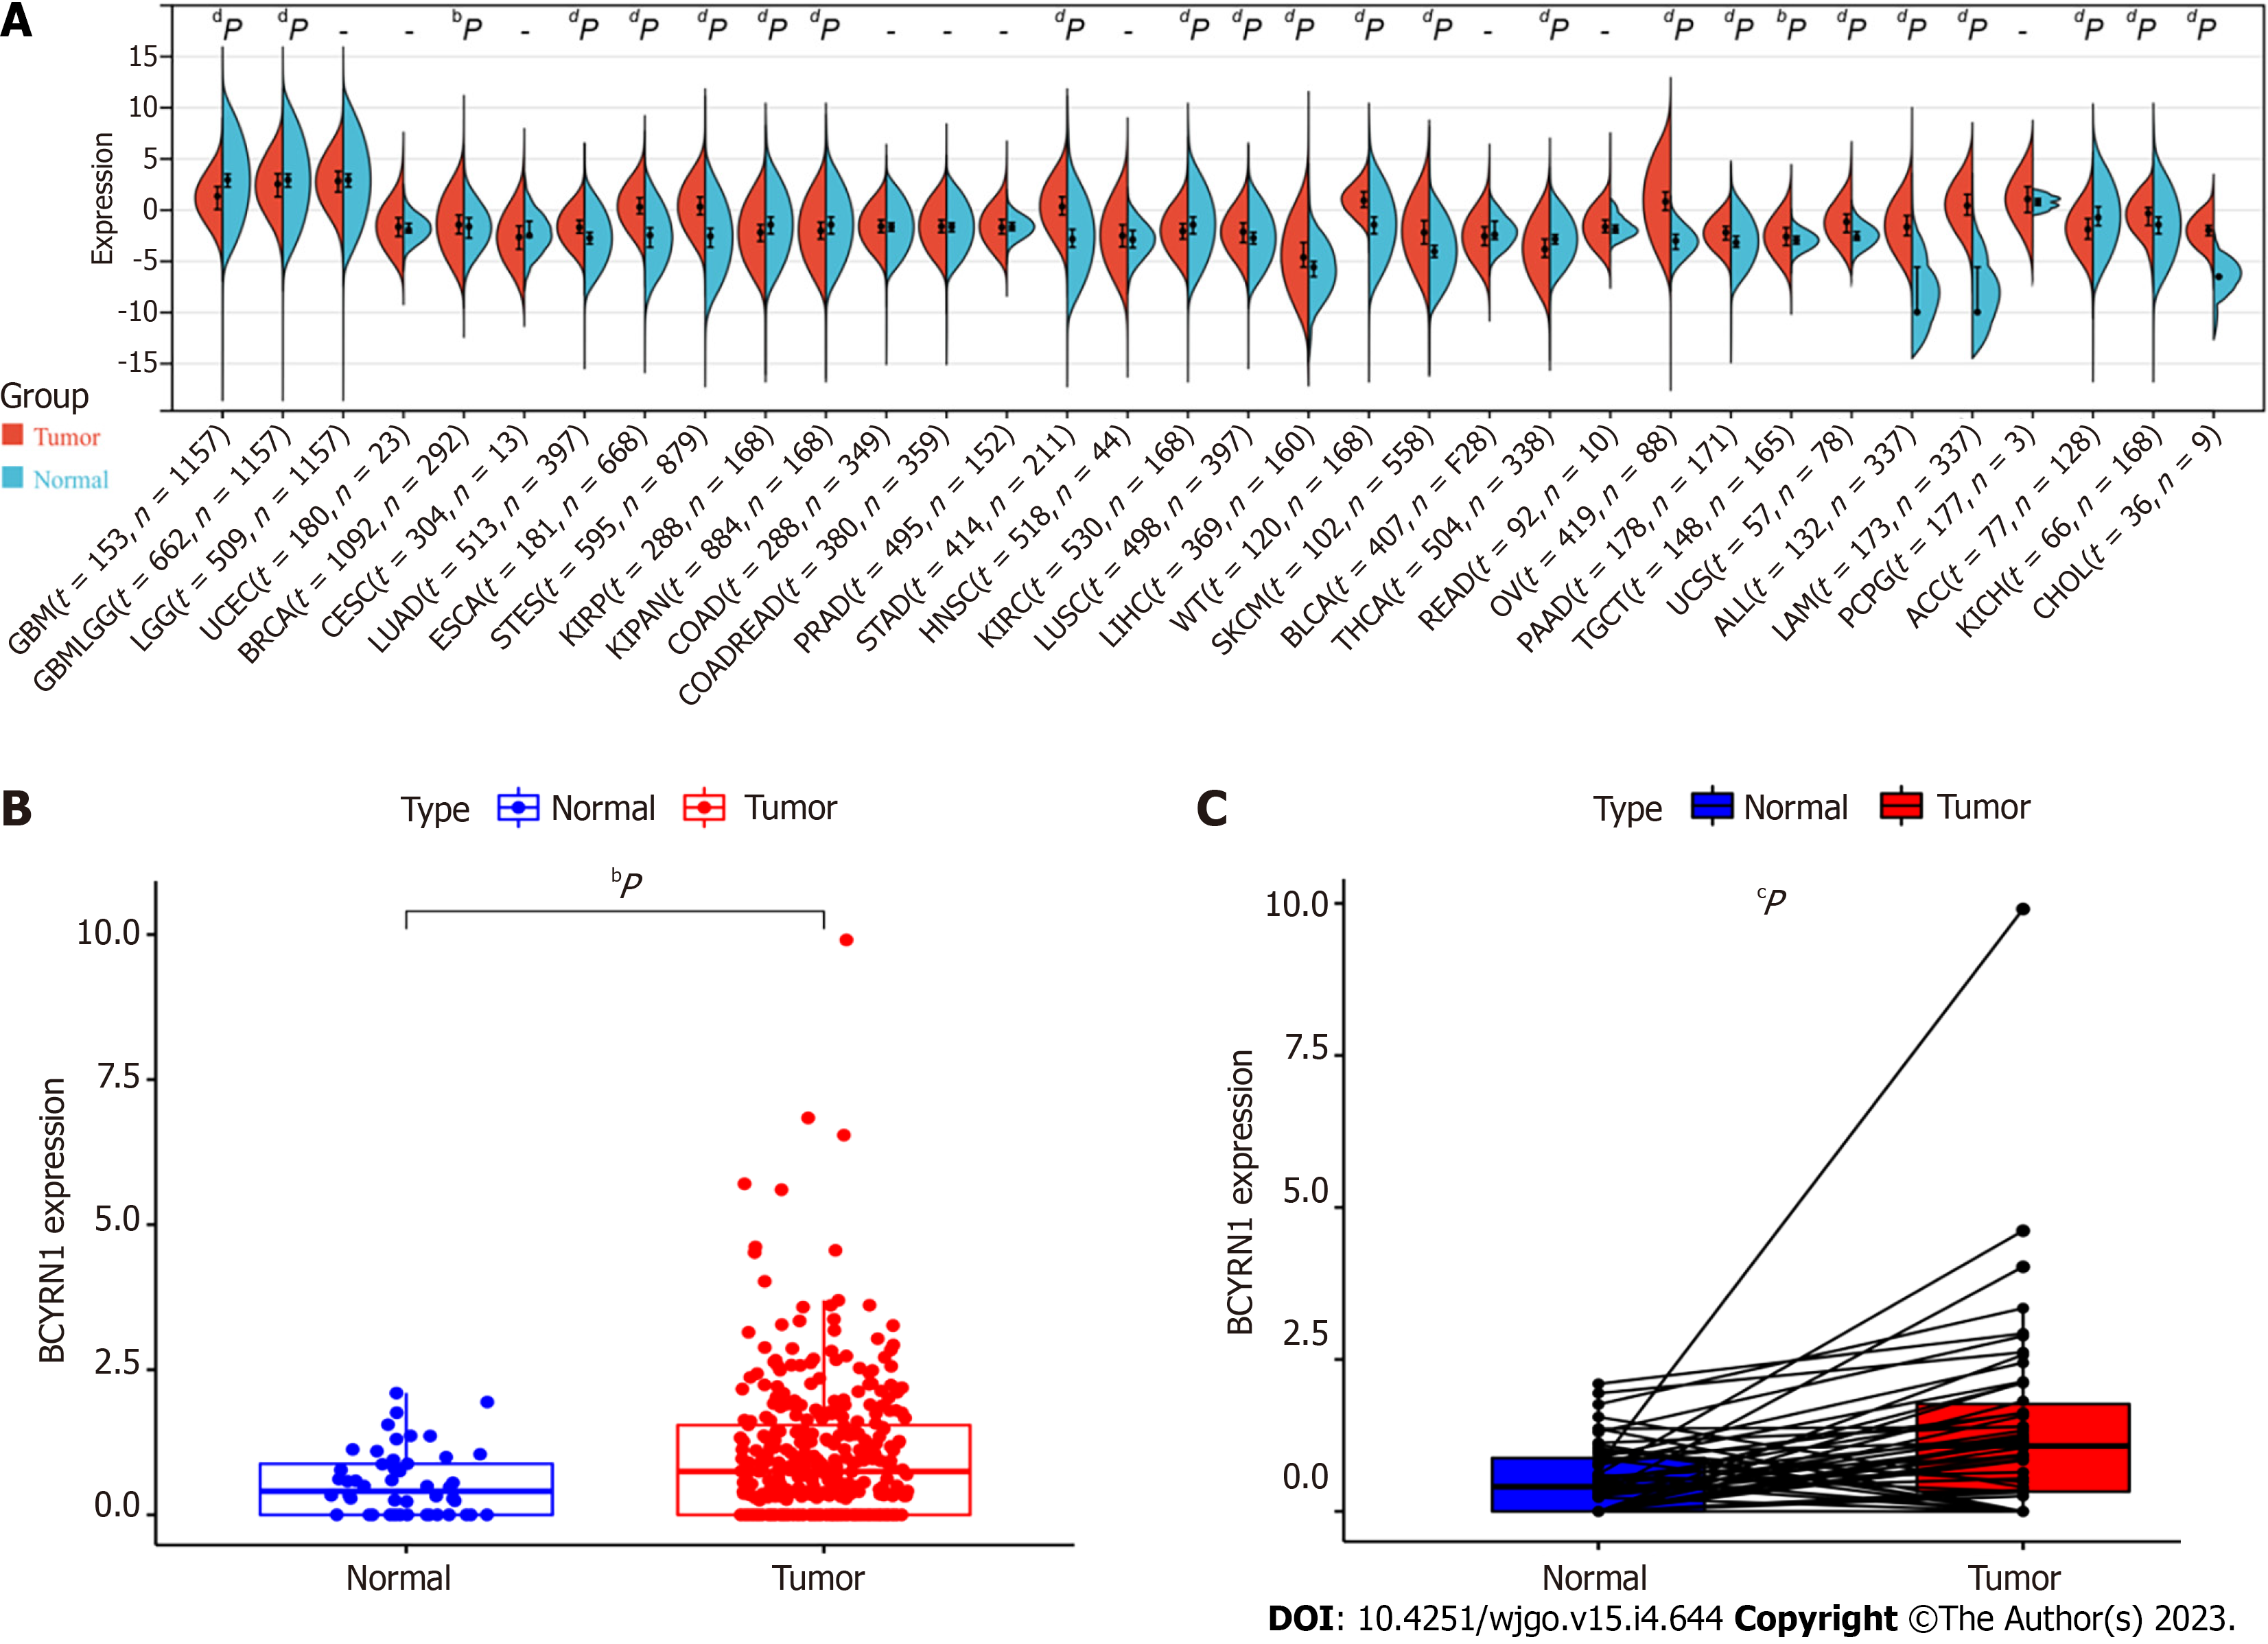
BCYRN1 expression was explored in pan-cancer, and it was discovered that BCYRN1 expression was significantly higher in 17 tumor tissues compared to normal tissues, including breast invasive carcinoma (BRCA), lung adenocarcinoma (LUAD), esophageal cancer (ESCA), stomach and esophageal carcinoma (STES), stomach adenocarcinoma (STAD), lung squamous cell carcinoma (LUSC), LIHC, Wilms’ tumour (WT), skin cutaneous melanoma (SKCM), ovarian serous cystadenocarcinoma (OV), pancreatic adenocarcinoma (PAAD), testicular germ cell tumors (TGCT), uterine carcinosarcoma (UCS), acute lymphoblastic leukemia (ALL), acute myeloid leukemia (LAML), kidney chromophobe (KICH) and cholangiocarcinoma (CHOL). In contrast, BCYRN1 expression was significantly lower in seven tumor tissues compared to normal tissues, including glioblastoma multiforme (GBM), glioma (GBMLGG), kidney renal papillary cell carcinoma (KIRP), pan-kidney cohort (KIPAN), kidney renal clear cell carcinoma (KIRC), thyroid carcinoma (THCA), and adrenocortical carcinoma (ACC) (Figure 1A). Then, BCYRN1 expression was explored in HCC, and the difference analysis boxplot (Figure 1B) showed that BCYRN1 expression in HCC tissues was significantly (P < 0.01) higher compared to that in normal liver tissues. These findings were consistent with the result of paired difference analysis of samples (P < 0.001) (Figure 1C).
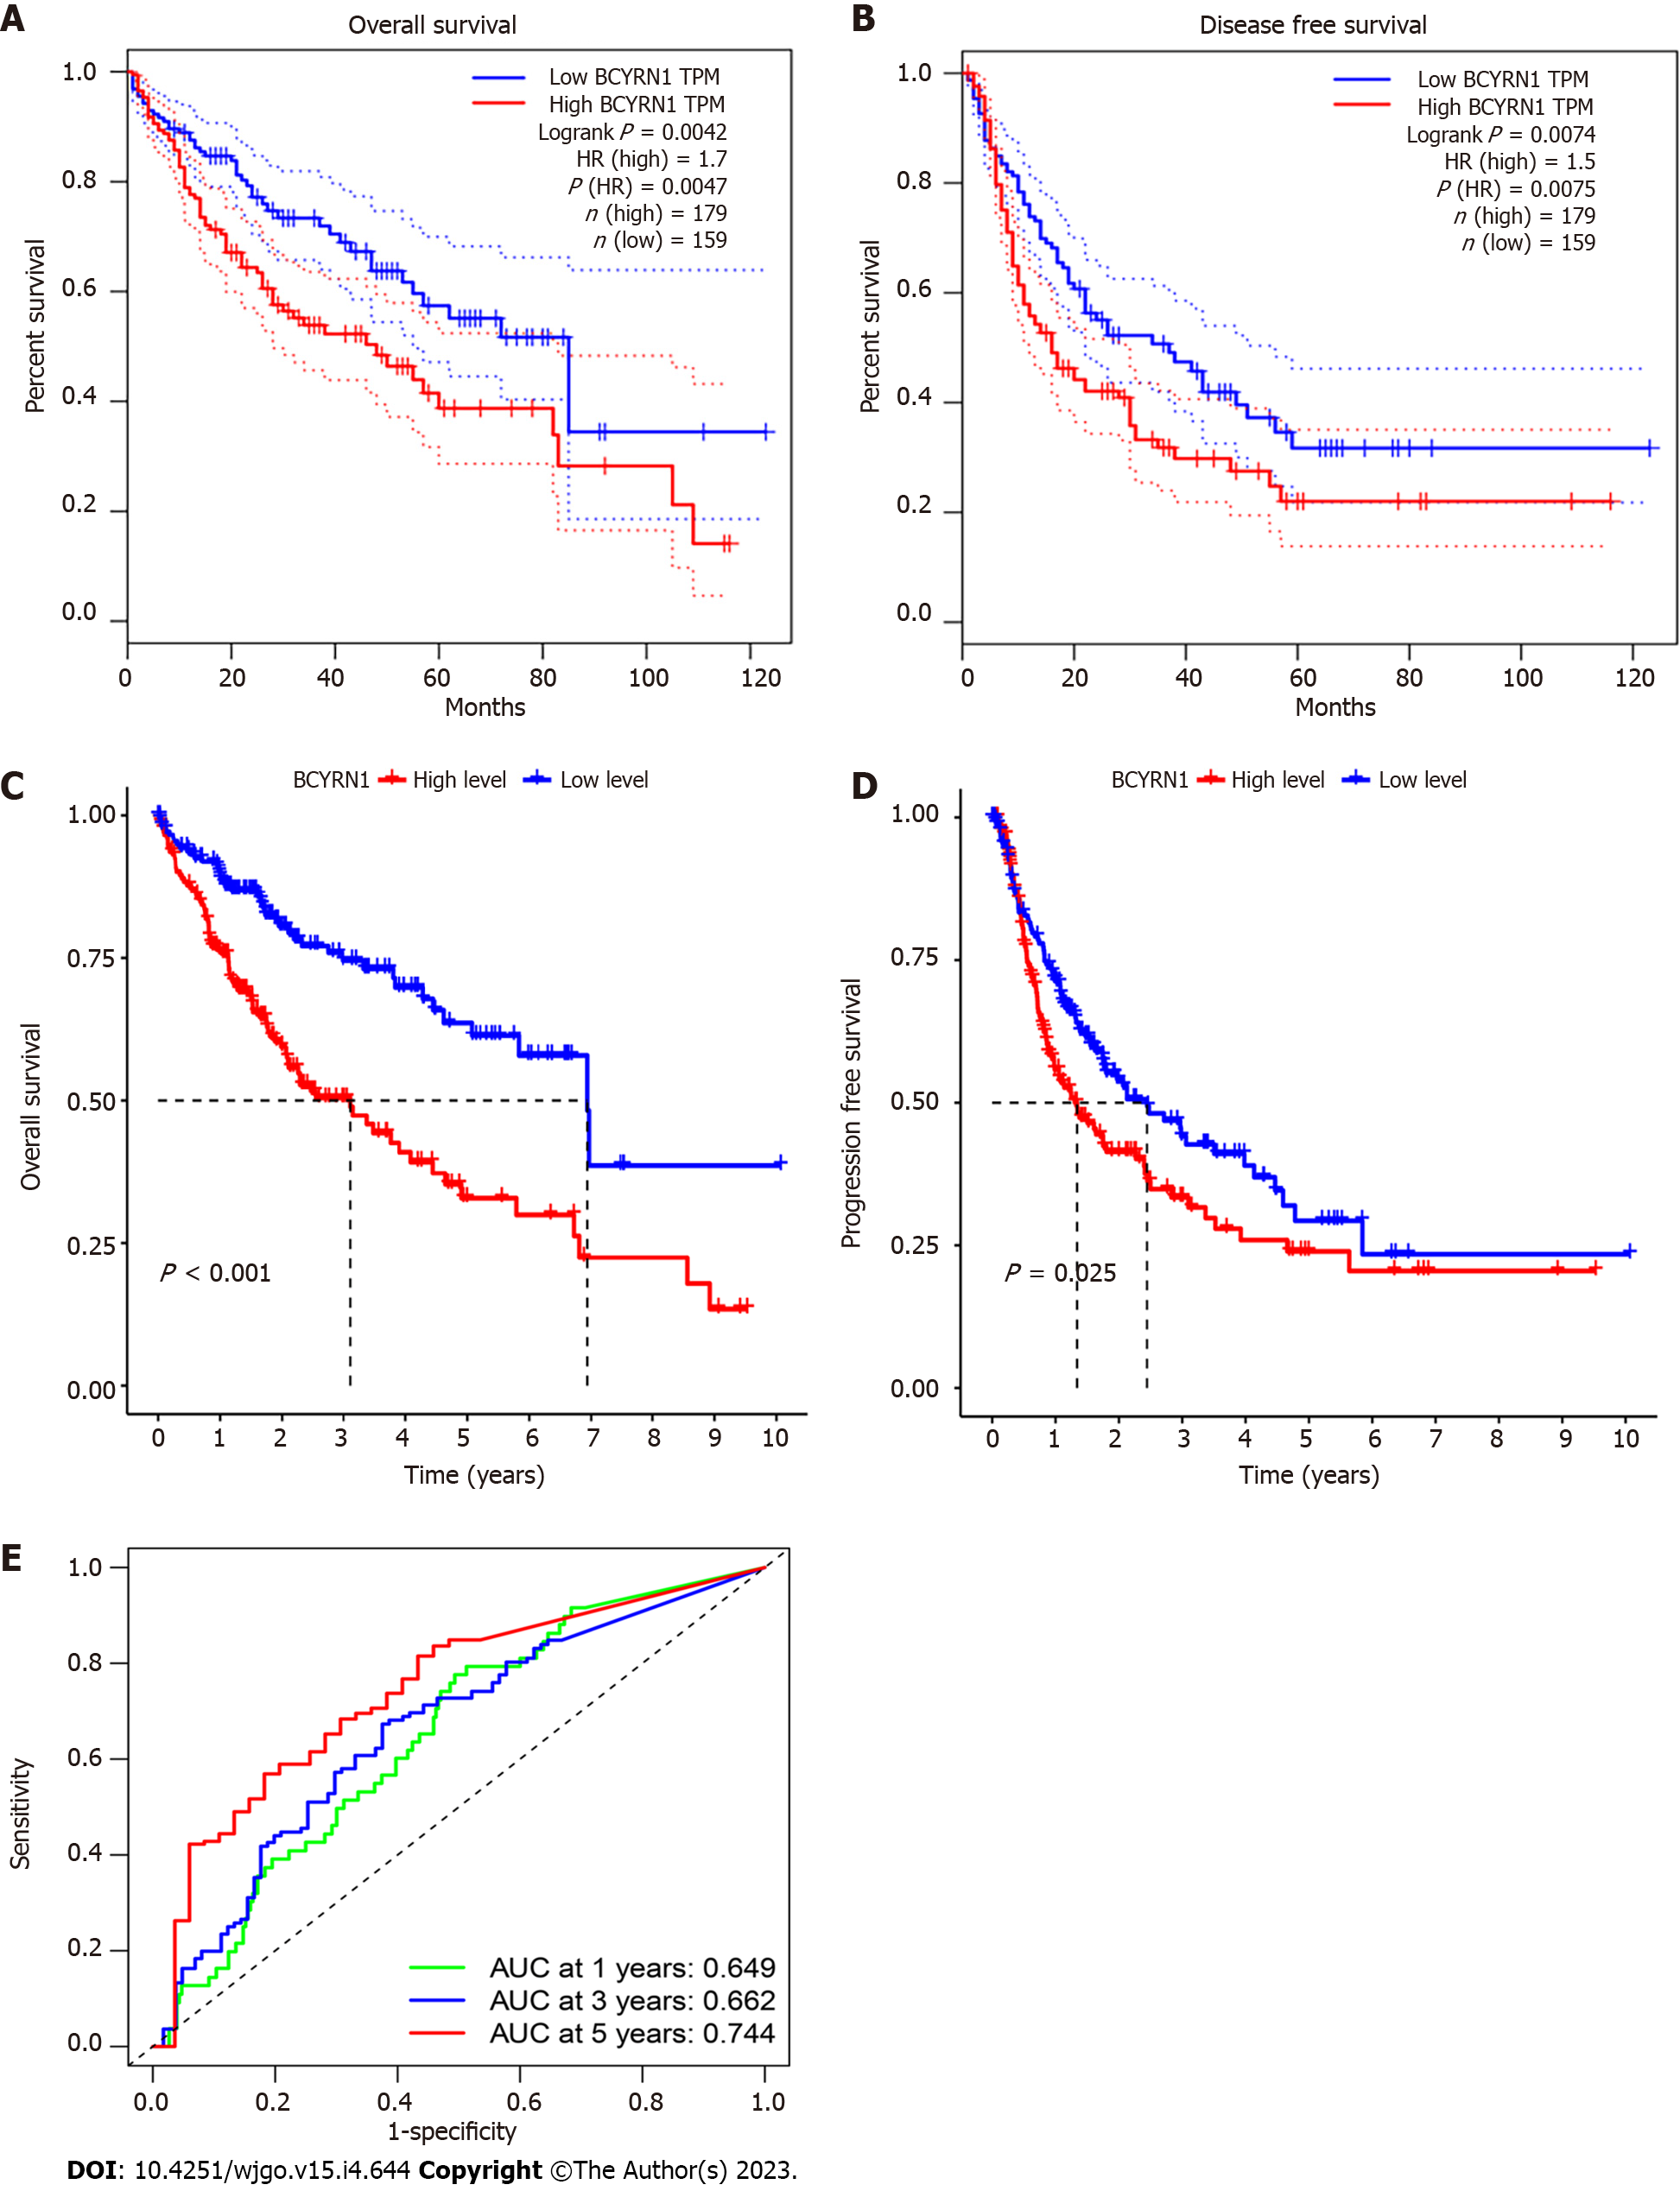
The relationship between BCYRN1 expression and the OS and disease-free survival (DFS) of HCC patients was investigated by the GEPIA2 database. The findings showed that overexpression of BCYRN1 was associated with a worse OS (P = 0.0047; Figure 2A) and DFS (P = 0.0075; Figure 2B) in HCC patients. Based on the TCGA database, KM survival prognosis curves were drawn, and the results showed that patients with high expression of BCYRN1 had a worse OS (P < 0.001; Figure 2C) and PFS (P = 0.025; Figure 2D). Finally, plotted ROC curves (Figure 2E) showed that the expression of BCYRN1 was highly predictive for the 5-year prognosis of HCC patients.
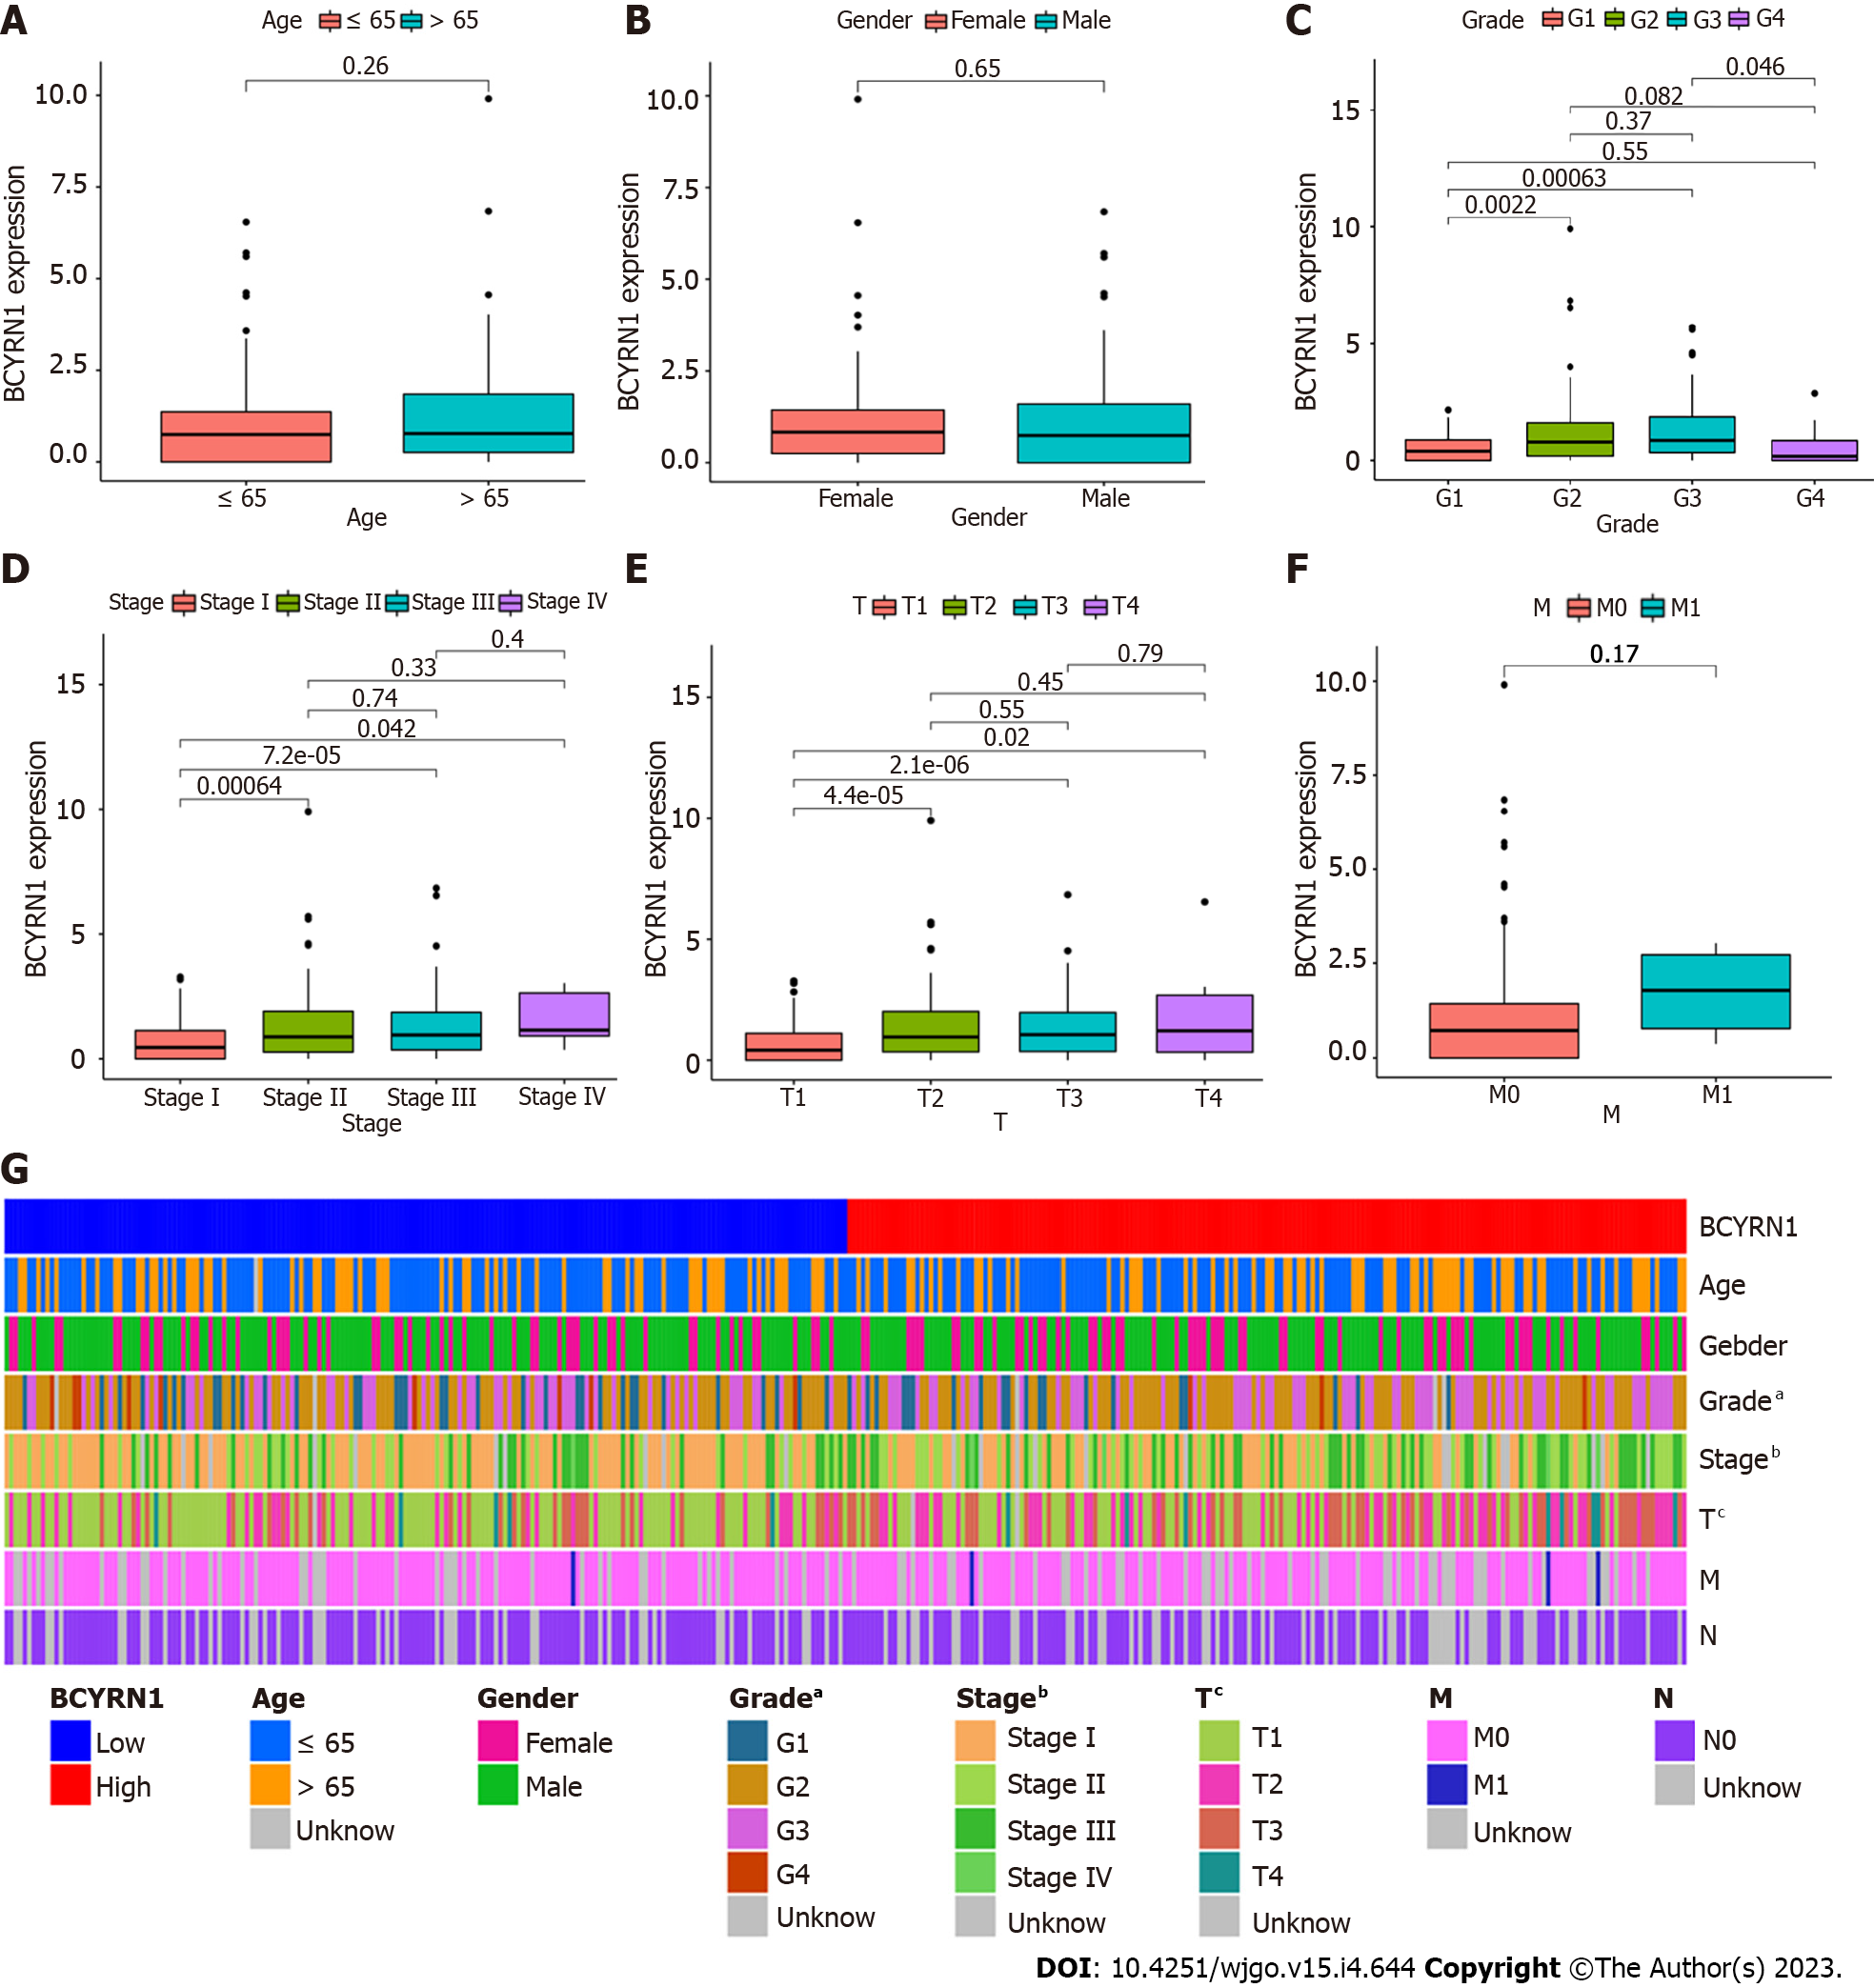
By analyzing the connection between BCYRN1 expression and the clinicopathological characteristics of HCC patients, it was discovered that BCYRN1 expression was not significantly correlated with age (P = 0.26; Figure 3A), sex (P = 0.65; Figure 3B) and M stage (P = 0.17; Figure 3F) of patients. A significant correlation was observed with pathological grade (G1 vs G2 and G1 vs G3, P < 0.05; Figure 3C), clinical stage (stage 1 vs stage 2, stage 1 vs stage 3 and stage 1 vs stage 4, P < 0.05; Figure 3D) and T stage (T1 vs T2, T1 vs T3 and T1 vs T4, P < 0.05; Figure 3E) of patients. In addition, a heat map (Figure 3G) was associated with clinicopathological features, and a significant relationship was observed between BCYRN1 expression and the pathological grade (P < 0.05), clinical stage (P < 0.001) and T stage (P < 0.0001) of patients.
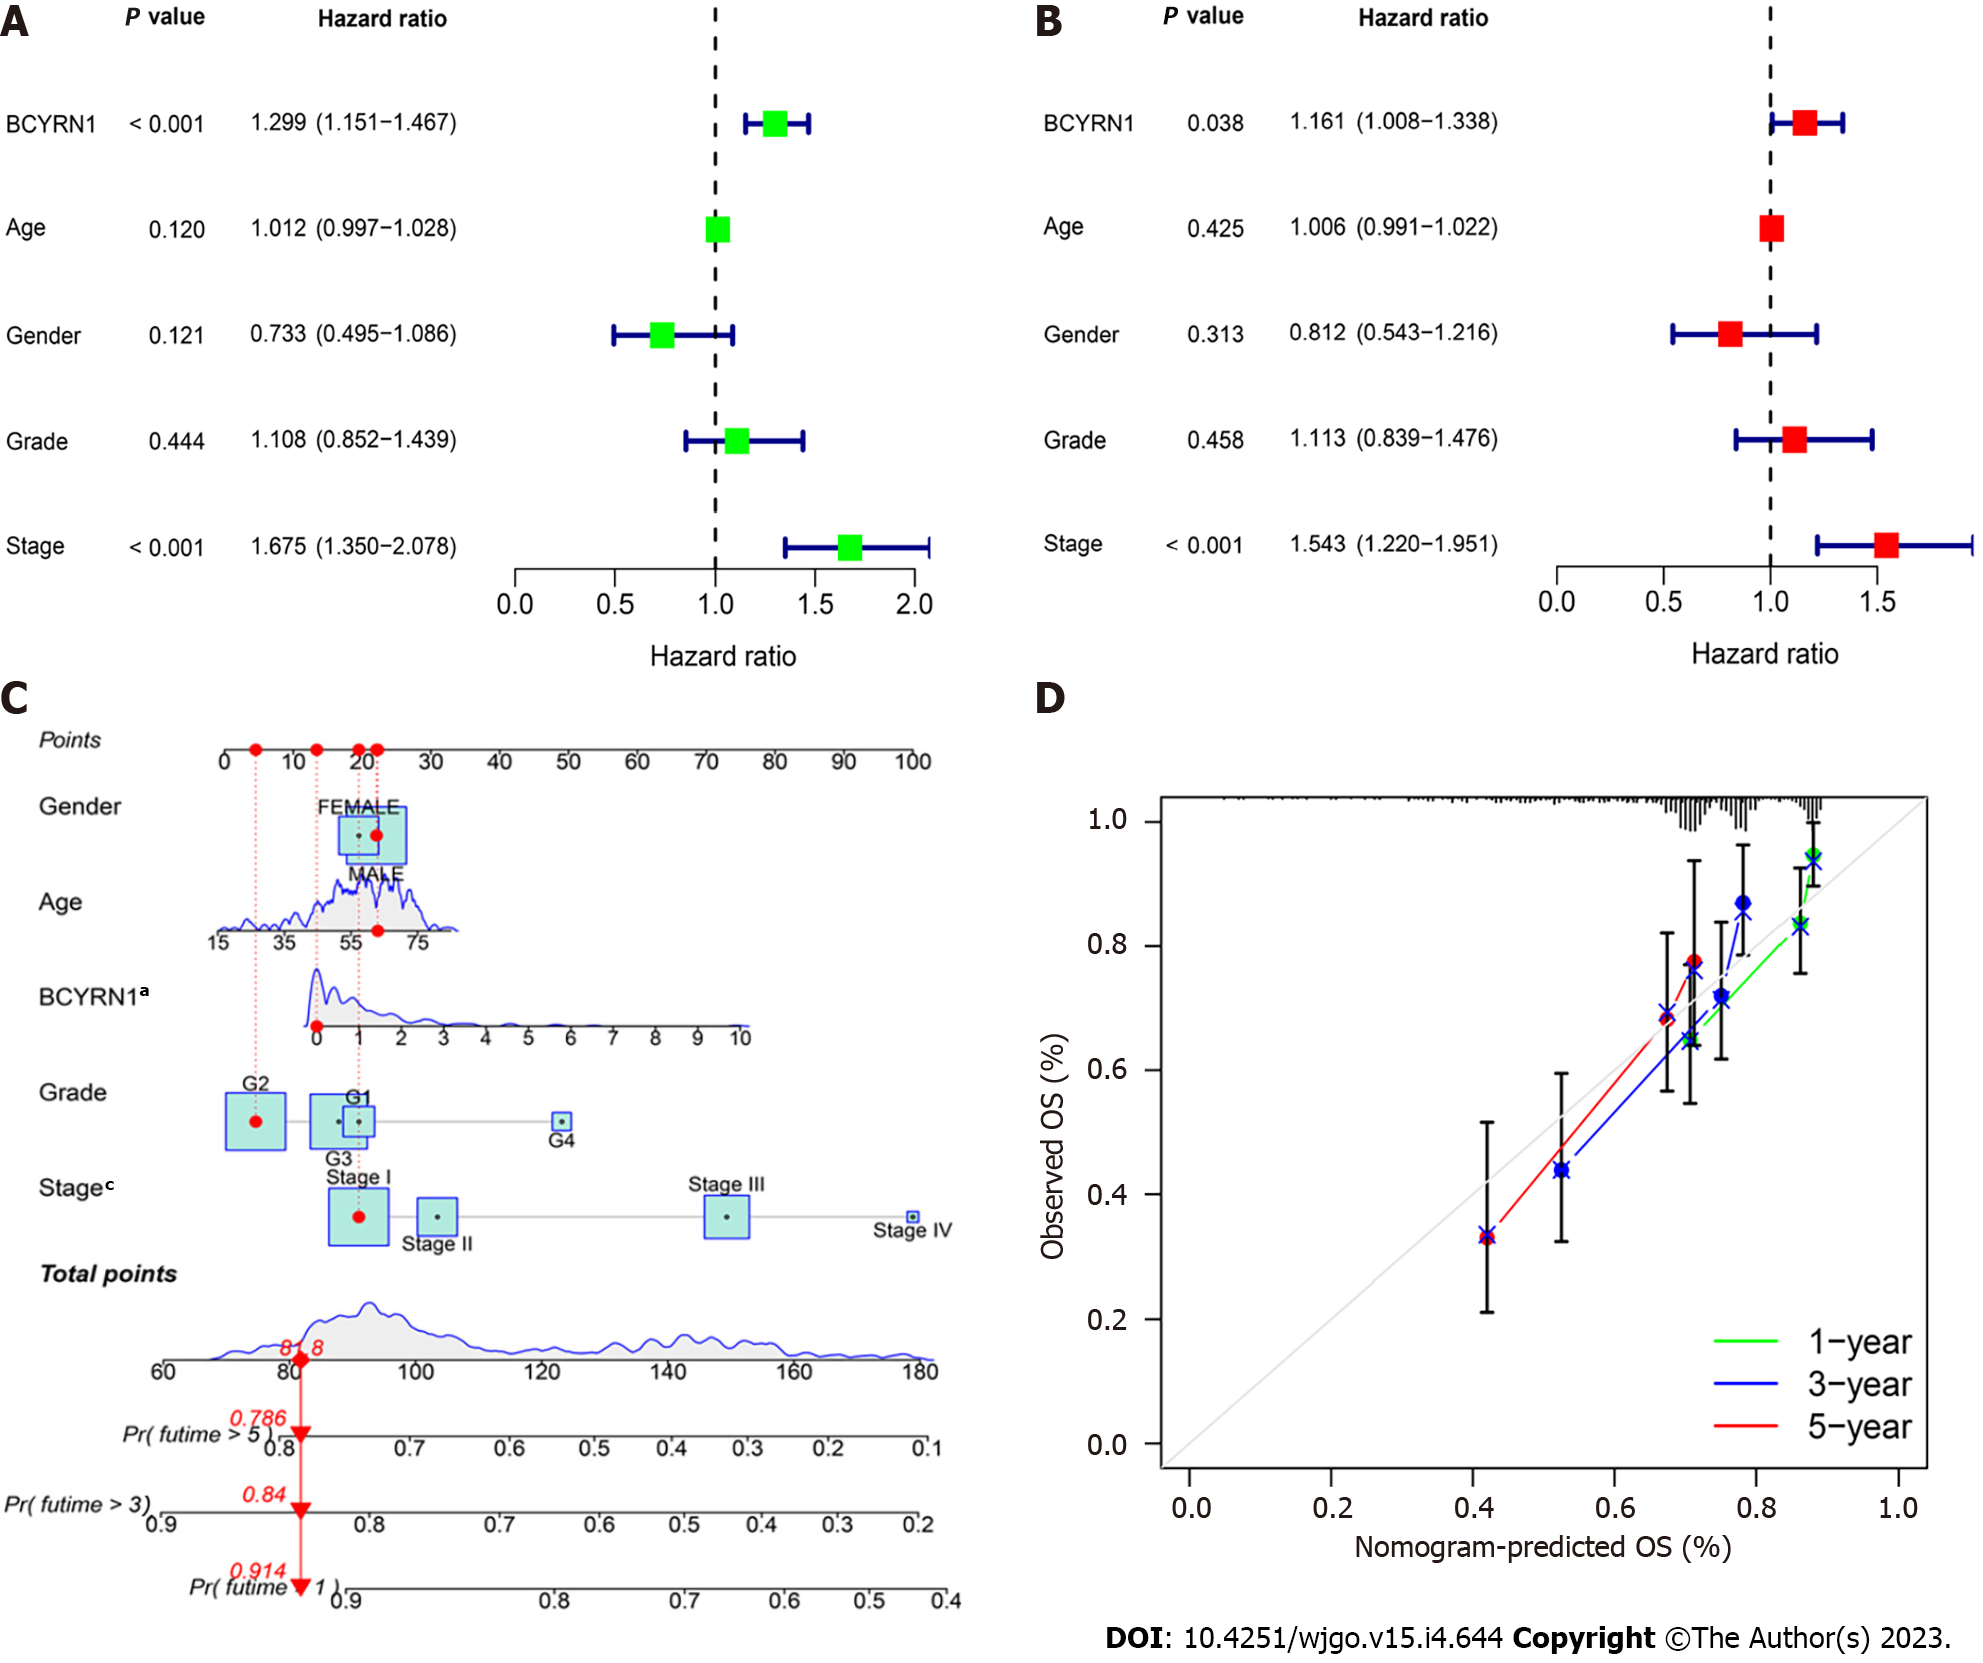
To confirm the prognostic significance of BCYRN1 in HCC patients, univariate (Figure 4A) and multivariate regression analyses (Figure 4B) of prognostic markers in HCC patients were completed. The results of univariate and multivariate prognostic analysis were consistent, thereby suggesting that the expression of BCYRN1 (HR = 1.16, P = 0.038) and the clinical stage (HR = 1.543, P < 0.001) of the tumor were significantly associated with OS in patients and could be used as independent prognostic markers for HCC. A nomogram prediction model (Figure 4C) for survival prediction in HCC patients was constructed using clinicopathological information and survival prognosis of patients. According to the clinicopathological information and the expression level of BCYRN1, the 5-year, 3-year and 1-year survival rates of patients can be predicted. Finally, calibration curves were drawn (Figure 4D) to evaluate the accuracy of the prediction model. Because the inclination of the prediction curves was close to the diagonal, the prediction model was reliable and accurate.
An analysis of co-expressed genes of BCYRN1 was performed. Among them, co-expressed genes that satisfied “P < 0.001 and correlation coefficient > 0.5” were screened to obtain a total of eight genes, and the co-expression correlation scatter plot was plotted (Supplementary Figure 1). The co-expression results were used to select the 11 genes that most closely were related to co-expression, and a co-expression circle plot was drawn (Figure 5A), in which red represented a positive correlation (LGALS1, TMSB4XP4, TMSB10, CCL26, S100A11, IMPDH1), green represented a negative correlation (PAH, SLC2A2, F12, HNF4A, CPB2), and the shaded area represented the magnitude of the correlation. Finally, the DEGs between groups with high and low BCYRN1 expression were explored, and 50 DEGs were selected that were most significantly upregulated and downregulated. Finally, a heat map of DEGs was drawn (Figure 5B).
A total of 1453 (GO) and 622 (KEGG) DEGs associated with BCYRN1 were screened using HCC expression data from the TCGA database. Next, these DEGs were subjected to GO and KEGG enrichment analyses. GO enrichment analysis revealed that these genes were primarily involved in biological processes, including extracellular structure organization, external encapsulating structure organization and extracellular matrix organization. Cellular composition included collagen-containing extracellular matrix, the ion channel complex and the synaptic membrane. The molecular functions performed mainly involved gated channel activity, ion channel activity and signaling receptor activator activity, etc. (Figure 6A-C). KEGG enrichment analysis indicated that the DEGs of BCYRN1 primarily involved pathways, including neuroactive ligand-receptor interaction, extracellular matrix-receptor interaction and protein digestion and absorption, among which protein digestion and absorption were pathways with the most annotated genes (Figure 6D and E). Finally, the result of GSEA enrichment analysis showed that pathways or functions that may be active in the low BCYRN1 expression group were as follows: retinol metabolism, glycine, serine and threonine metabolism, peroxisome, primary bile acid biosynthesis and fatty acid metabolism (Figure 6F).
Stromal cell and immune cell scores in groups with high and low BCYRN1 expression were evaluated, and violin plots of TME scores were plotted based on the results. The data showed that immune cell score, stromal cell score and ESTIMATEScore in the group with high BCYRN1 expression were significantly higher compared to those in the low expression group (P < 0.05), showing that the immune cell and stromal cell content in the group with high BCYRN1 expression in HCC was higher (Figure 7A). Differential analysis of immune cells was performed, and the results demonstrated that the levels of plasma cells (P < 0.05) and CD8 T cells (P < 0.001) were significantly increased in the group with low BCYRN1 expression. Moreover, the level of macrophages M0 (P < 0.05) was significantly increased in the group with high BCYRN1 expression (Figure 7B). Finally, correlation analysis was performed between various immune cells and BCYRN1 expression, and correlation Lollipop and correlation scatter plots were plotted. The results showed that BCYRN1 expression was positively linked with the level of macrophages M0 (P = 0.016), macrophages M2 (P = 0.0094) and regulatory T cells (P = 0.018) and negatively correlated with the level of plasma cells (P = 0.012) and CD8 T cells (P = 0.0069) (Figure 7C and Supplementary Figure 2).
Immune checkpoint genes associated with BCYRN1 expression were explored, and circular correlation heat maps (Figure 8A) as well as rectangular correlation heat maps (Figure 8B) were plotted. The results showed that 19 immune checkpoint-related genes (LAIR1, CD70, TNFRSF4, PDCD1LG2, HAVCR2, CTLA4, TNFSF15, CD276, LGALS9, TNFRSF18, TNFRSF9, TNFRSF14, CD44, CD80, CD86, CD200R1, TNFRSF8, TNFSF9, VTCN1) were significantly and positively correlated with BCYRN1 expression, and one immune checkpoint-related gene (ADORA2A) was significantly and negatively correlated with BCYRN1 expression. The relationship between BCYRN1 expression and TMB was also investigated, and correlation scatterplots were plotted (Figure 8C). Together, the data revealed that there was no significant relationship between TMB and BCYRN1 expression (P = 0.11).
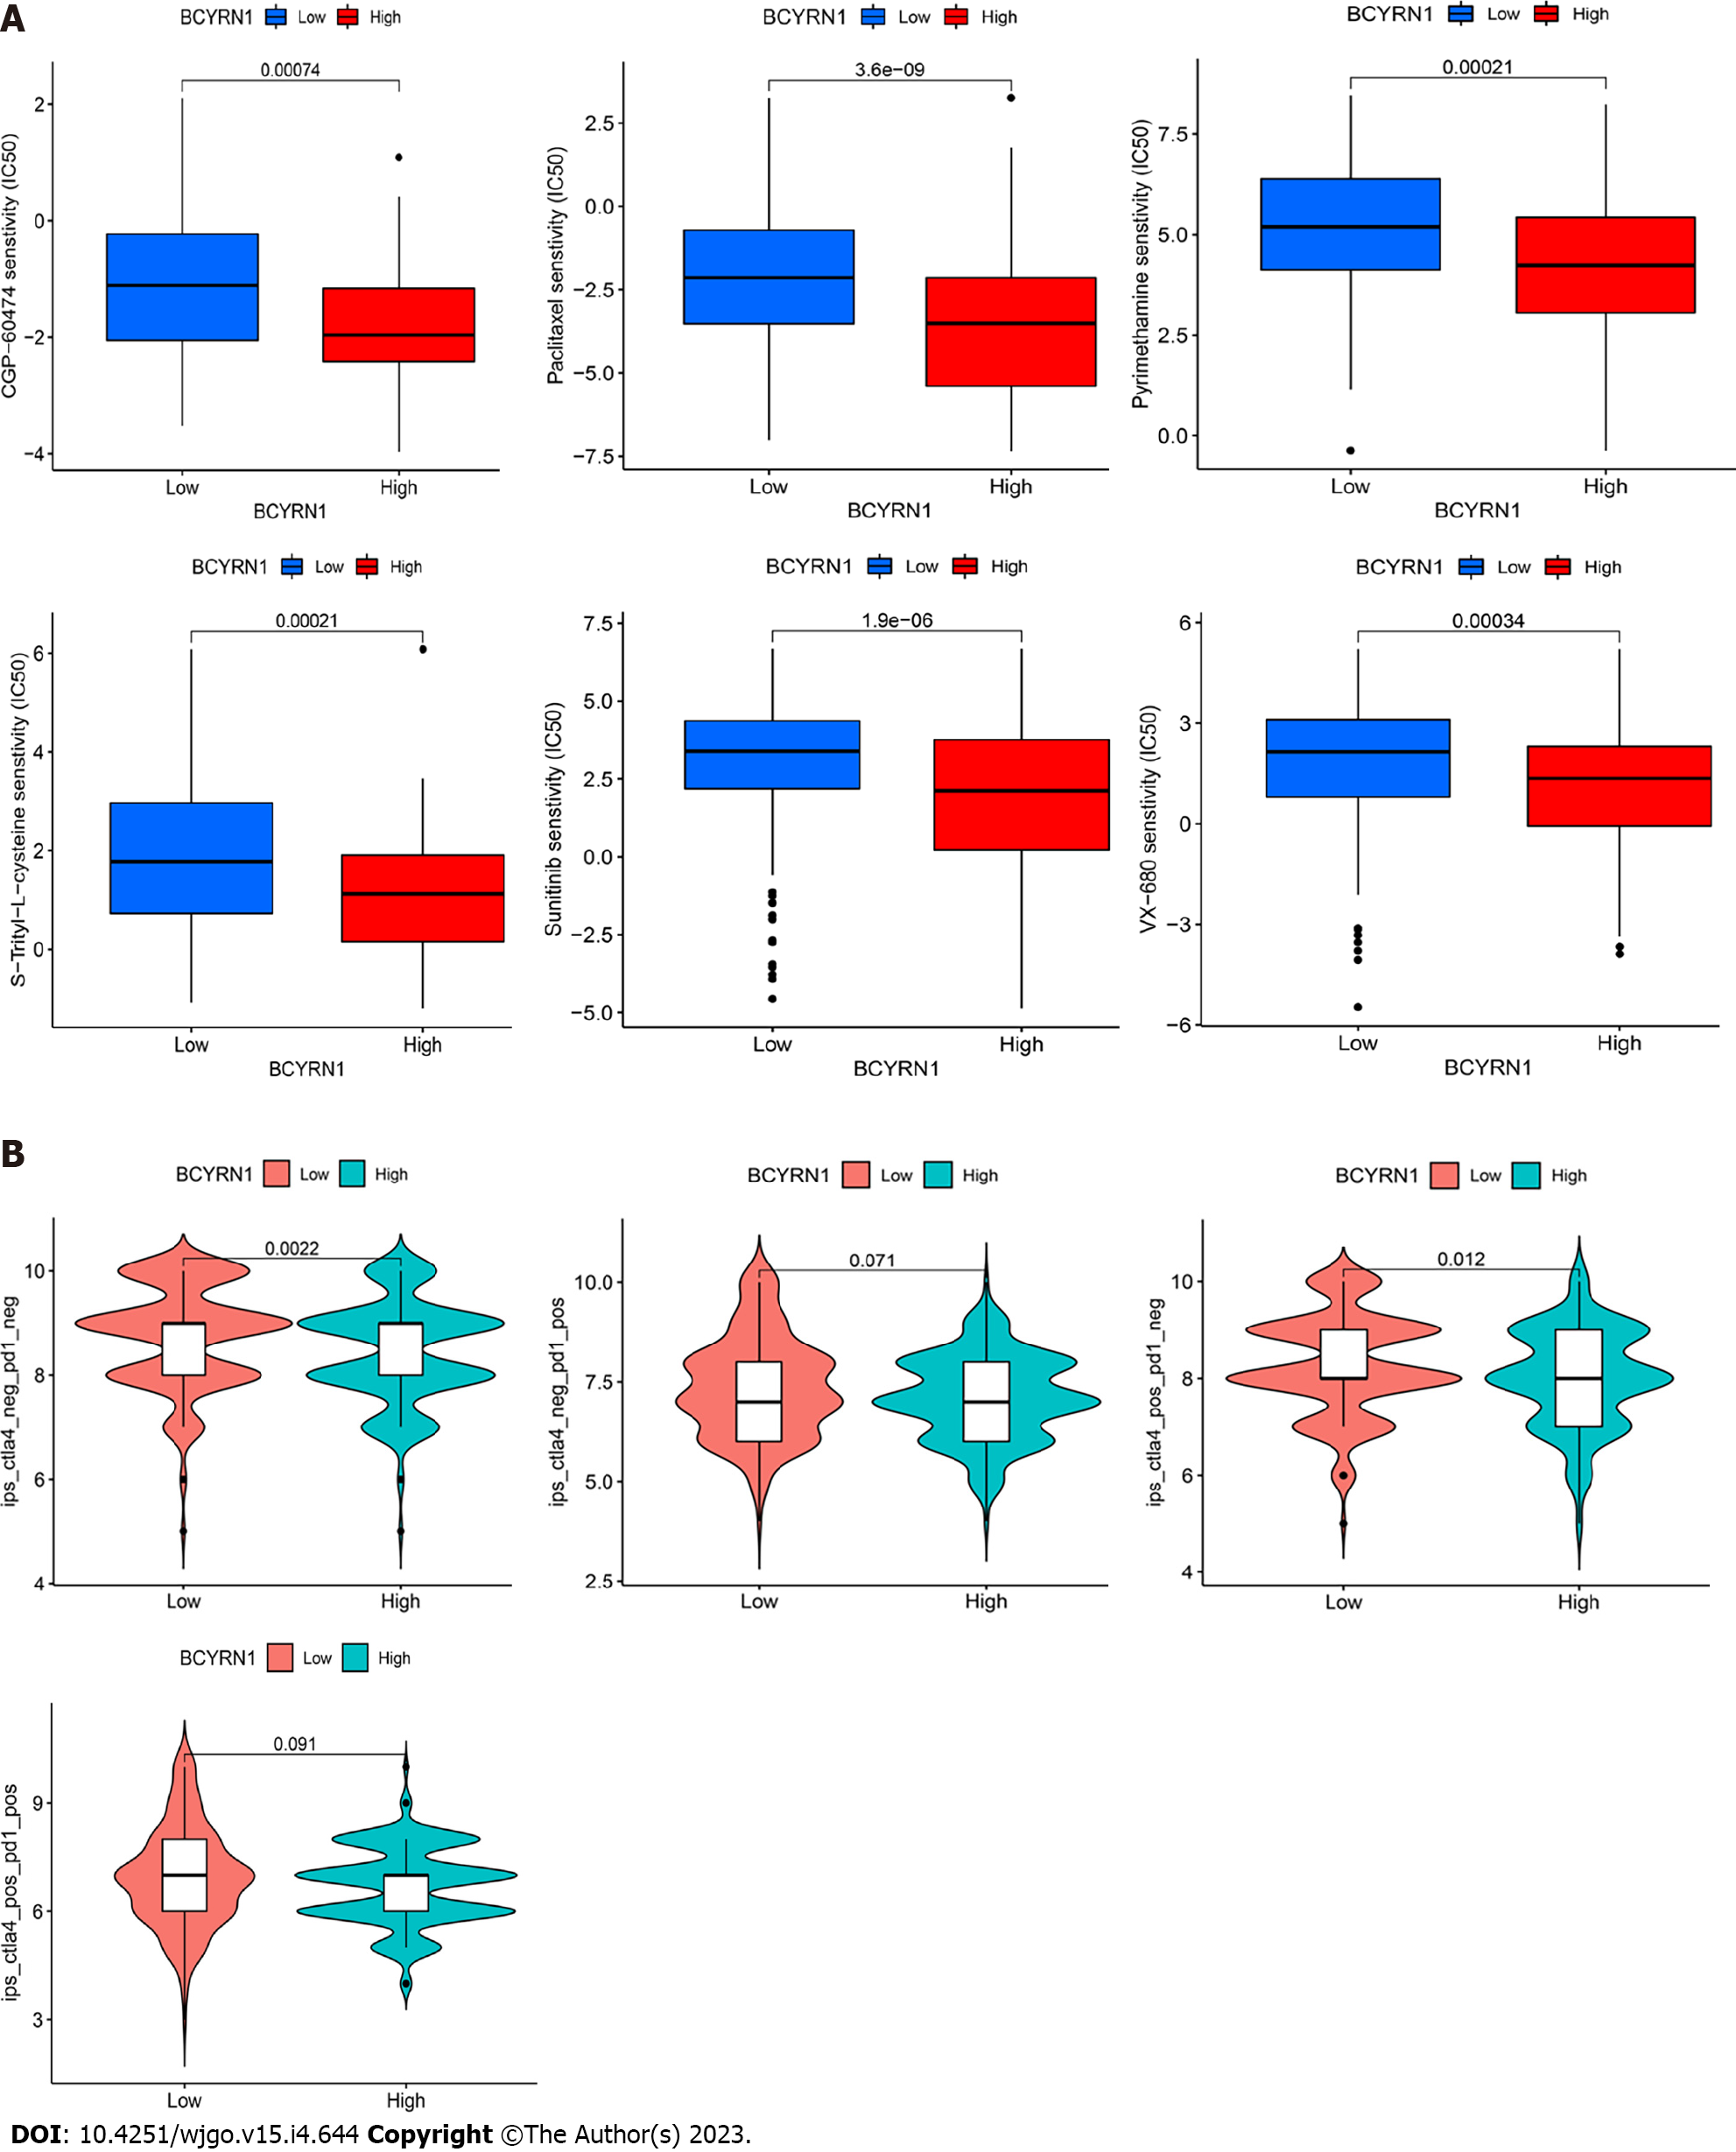
Chemotherapy is a promising therapeutic option for liver cancer. The IC50 of commonly used chemotherapeutic agents was evaluated in groups with high and low BCYRN1 expression, and difference boxplots were plotted (Figure 9A). The results showed that CGP-60474, S-Trityl-L-cysteine, sunitinib, paclitaxel, VX-680 and pyrimethamine had higher sensitivity and a better therapeutic effect in the high BCYRN1 expression group. Progression of immune checkpoint inhibitors changes the prognosis of HCC patients, and CTLA-4 and PD-1 are critical indicators to determine their therapeutic effects. Therefore, the therapeutic effects of anti-PD-1 and anti-CTLA-4 were scored in groups with high and low BCYRN1 expression. The data revealed that the immunotherapeutic effect of anti-PD-1 was not significantly correlated (P = 0.071) with the expression of BCYRN1, while the immunotherapeutic effect of anti-CTLA-4 was more effective in the group with low BCYRN1 expression (P = 0.012; Figure 9B).
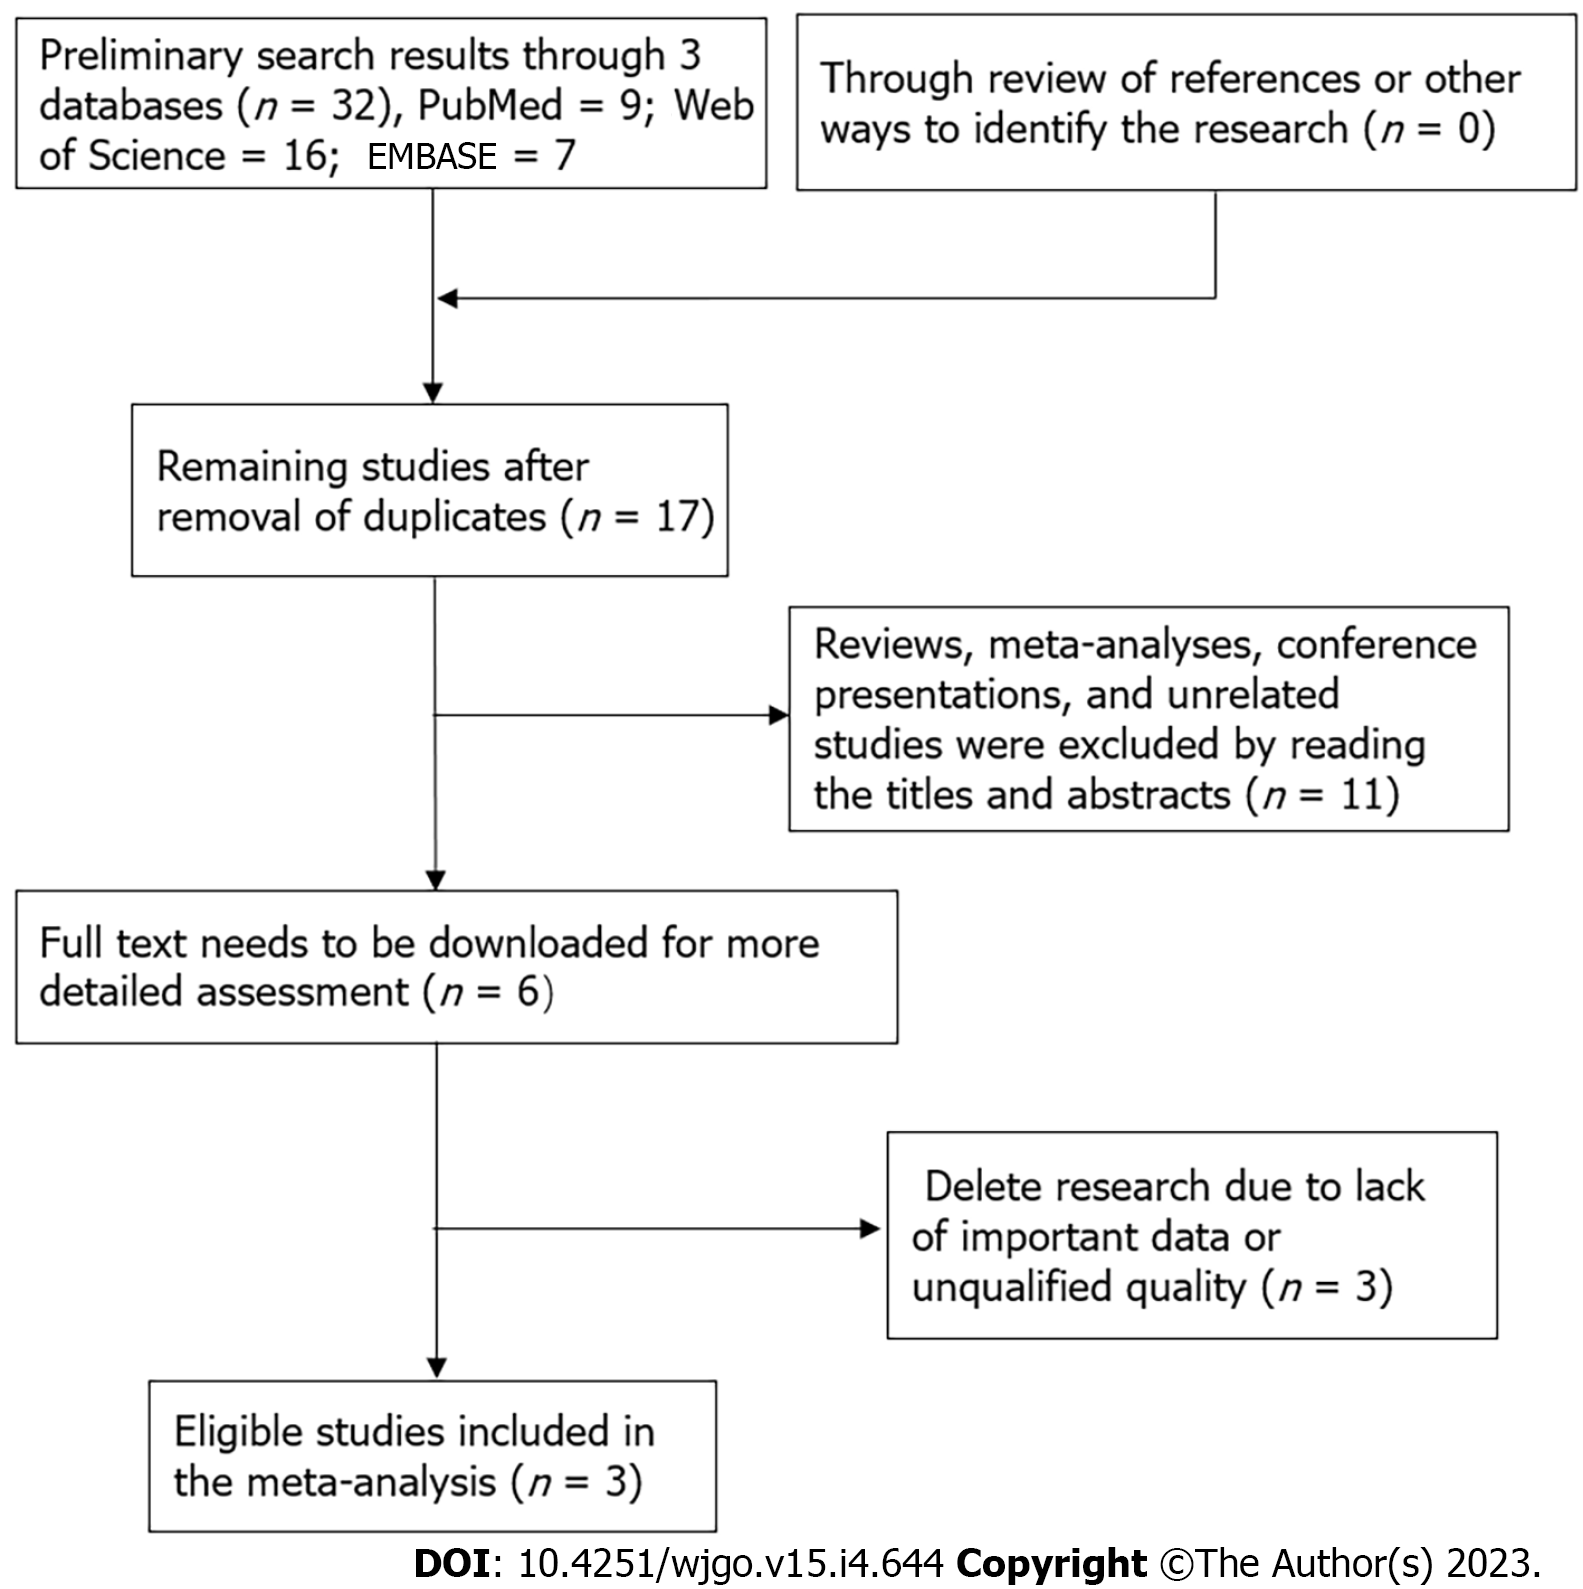
Preliminary searches of three English databases yielded the following results: PubMed (n = 9), EMBASE (n = 7) and Web of Science (n = 16). Retrieval results were imported into Endnote. After removing duplicate studies, the remaining studies (n = 17) were analyzed. By reading the abstract and title, studies not conforming to the literature type and unrelated studies (n = 11) were removed. The remaining six articles were downloaded in full, and after careful examination, three publications were excluded because of a lack of essential data and poor quality. The remaining three studies were eventually included in our meta-analysis. Figure 10 depicts the above-mentioned search flowchart. All three studies were written in English, and all were from China. Specimen types were all HCC tissues, RNA expression was determined by qRT-PCR, and the source of HR values was indirectly calculated from OS curves. Follow-up time was 50 mo, 80 mo and 120 mo. NOS scores ranged from a minimum of 7 to a maximum of 8, all of which were higher quality articles. Table 1 shows essential features of the collected articles.
| Ref. | Country | Sample size (high/low) | Sample | Survival analysis | Detection method | Cutoff value | Source of HR values | HR and 95%CI | Follow-up time | NOS score |
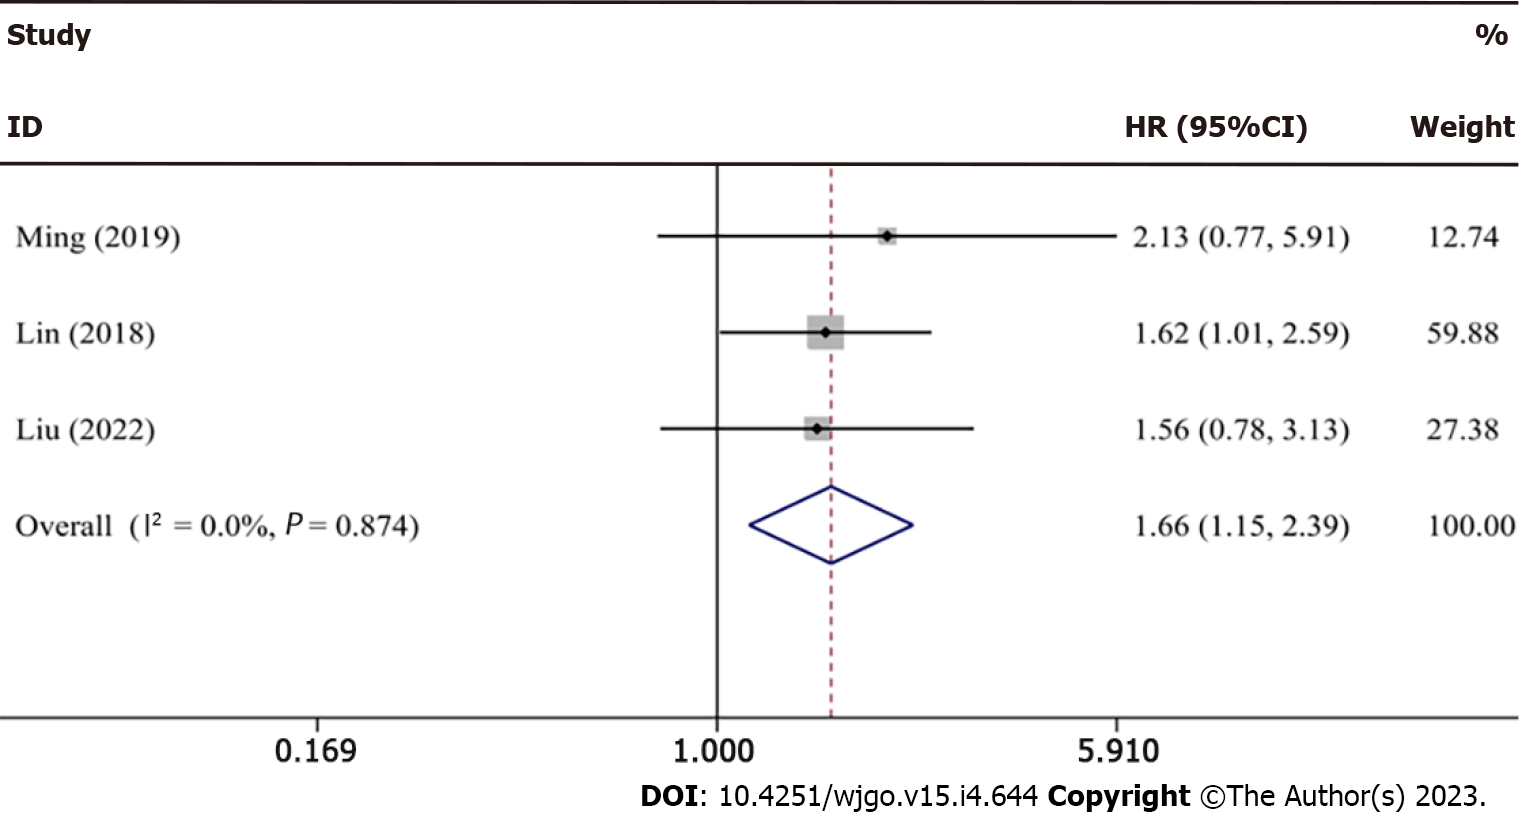
| Ming et al[28], 2019 | China | 55 (27/28) | Tissue | OS | qRT-PCR | Median | Survival curves | 2.13 (0.77, 5.93) | 50 mo | 7 |
| Lin et al[48], 2018 | China | 240 | Tissue | OS | qRT-PCR | Mean | Survival curves | 1.62 (1.01, 2.59) | 80 mo | 8 |
| Liu et al[47], 2022 | China | 100 (50/50) | Tissue | OS | qRT-PCR | NR | Survival curves | 1.56 (0.78, 3.14) | 120 mo | 7 |
Because there was no obvious heterogeneity (I2 = 0.0%, P = 0.874) across studies, a fixed effects model was selected to combine the data. The forest plot results (HR = 1.66, 95%CI: 1.15-2.39; Figure 11) showed that BCYRN1 overexpression was related to a poor prognosis in HCC patients, with individuals in the high BCYRN1 expression group having a poorer prognosis and shorter survival. Because only three studies were included, a bias test and sensitivity analysis were not performed.
HCC is one of the most prevalent types of cancer of the digestive system. Its early symptoms are not clear, and the main characteristics of the middle and advanced stages are rapid progression, unsatisfactory treatment outcomes and low 5-year survival rates[31]. The development of HCC is an extremely complex process and includes the involvement of multiple genes and the evolution of multiple steps. Its possible underlying molecular mechanisms remain elusive. In recent years, with the discovery and exploration of lncRNAs, it has been demonstrated that lncRNAs play an important role in the development and progression of HCC[32]. Previous studies have shown that lncRNA can regulate signaling pathways associated with HCC and the expression levels of downstream target genes, thereby further affecting the activity of proteins by changing the expression levels and stability of mRNAs and miRNAs, which are closely related to a variety of malignant phenotypes of HCC[33,34]. Dysregulation of lncRNAs has been associated with precancerous lesions of HCC, such as hepatitis B virus infection, cirrhosis and fatty liver[35]. LncRNA can also evaluate and predict the efficacy of various treatment modalities for HCC patients and has a wide range of applications in HCC diagnosis and treatment[36]. BCYRN1 is an important member of the lncRNA family and exploring its prognostic value and therapeutic prospects in HCC is a main goal.
Our study first investigated the expression level of BCYRN1 in pan-cancer and normal tissues, and discovered that it was highly expressed in BRCA, LUAD, ESCA, LUSC, WT, STES, STAD, LIHC, SKCM, PAAD, OV, UCS, KICH, ALL, TGCT, CHOL and LAML, and lowly expressed in GBM, GBMLGG, KIRP, KIPAN, KIRC, THCA and ACC. The expression of BCYRN1 in HCC was independently examined, and the results revealed that BCYRN1 was considerably overexpressed in tumors. These early findings imply that BCYRN1 might be an oncogene in HCC. Our study continued to focus on the association between BCYRN1 expression and the prognosis and clinicopathological features of HCC patients. Using the GEPIA database and the TCGA dataset, KM curves for survival outcomes (including OS, DFS and PFS) were generated, all of which indicated that patients with high BCYRN1 expression had a poorer prognosis. ROC curves showed that BCYRN1 was of great value in predicting patient prognosis.
Clinicopathologic analysis showed that BCYRN1 expression was substantially linked with the clinical stage, pathological grade and T stage of HCC patients, and BCYRN1 expression was higher when the clinical stage was more advanced, the pathological grade was worse and the T stage was higher. Our findings showed that the worse the pathological grade, then the stronger the proliferation and invasiveness of HCC and the higher the expression level of BCYRN1. However, the expression of stage G4 in Figure 3C is low, which is not in line with the expected results. The reasons behind it have been thoroughly explored. As shown by the downloaded clinical data, there were 54 patients in the G1 stage, 179 patients in the G2 stage, and 123 patients in the G3 stage, while only 13 patients were in the G4 stage. Therefore, the number of patients in the G4 stage was significantly lower than those in other stages, and the sample size was too small to be representative. Given a sufficient sample size, the results are estimated to be in line with the expectations.
Subsequently, univariate and multivariate Cox regression analysis showed that the expression of BCYRN1 and the clinical stage of the tumor were independent prognostic factors for HCC patients. Therefore, we developed a nomogram prediction model that can predict OS in patients based on their clinicopathological characteristics and BCYRN1 expression. According to the results of the above-mentioned study, overexpression of BCYRN1 is related with a poor prognosis in patients and is likely to be an independent prognostic marker in HCC patients.
In addition, co-expressed genes and DEGs associated with BCYRN1 were screened. The most strongly correlated co-expressed genes were LGALS1, TMSB4XP4, TMSB10, CCL26, S100A11, IMPDH1, PAH, SLC2A2, F12, HNF4A, and CPB2. Among them, genes that were positively correlated with the expression of BCYRN1 were generally oncogenes and can lead to poor prognosis in HCC. For example, it has been found that the LGALS1 gene is upregulated in HCC and can encode related proteins, thereby increasing tumor migration and invasion[37]. Similarly, TMSB10 expression in HCC was significantly higher compared to that in surrounding normal liver tissues, and high TMSB10 expression was significantly associated with tumor volume and distant metastasis, which was a potential prognostic marker for predicting HCC patients[38]. It has previously been revealed that CCL26 acts on fibroblasts, thereby affecting processes including proliferation, invasion and angiogenesis in HCC[39]. S100A11 overexpression in HCC can enhance HCC invasiveness[40]. In contrast, genes negatively correlated with BCYRN1 expression are generally tumor suppressor genes. Low SLC2A2 expression was correlated with a worse DFS and OS in HCC patients, and SLC2A2 expression was negatively associated with the degree of immune infiltration in HCC[41]. Furthermore, it has been demonstrated that HNF4A can inhibit the motility and metastasis of HCC cells[42]. The above-mentioned studies demonstrated the value of co-expression analysis of genes.
Moreover, DEGs associated with BCYRN1 were screened, and KEGG, GO and Gene Set Enrichment Analysis enrichment analysis were performed. The results of comprehensive enrichment analysis demonstrated that the primary functions of BCYRN1-related DEGs were to regulate extracellular matrix components, regulate ion channel activity and signal molecule transmission, such as synaptic membrane. In addition, BCYRN1-related DEGs were involved in protein digestion and absorption as well as the metabolism of retinol, amino acids and fatty acids and involved in the regulation of tumor-related pathways (calcium signaling pathway, Wnt signaling pathway, IL-17 signaling pathway). The TME consists of three parts, including the extracellular matrix, stromal cells and cell growth factors. The extracellular matrix is crucial in the formation of tumors[43,44]. It has been demonstrated that dysregulation of the Ca2 + concentration increases the risk of tumor development and accelerates tumor progression, whereas inactivation of Ca2+ channels accelerates the proliferation and growth of tumor cells[45]. The Wnt signaling pathway can regulate cell proliferation, differentiation, apoptosis and stem cell renewal, and dysregulation of the Wnt signaling pathway can occur at all stages of malignant tumors[46]. The above-mentioned studies and analyses on the mechanism of BCYRN1 involved in HCC showed that BCYRN1 is a very important regulatory gene in the formation and progression of HCC and an important possible therapeutic target for HCC.
Mechanistic studies of BCYRN1 in HCC could validate the conclusions of the current study. It has been proven that BCYRN1 is highly expressed in HCC and is associated with a poor prognosis in HCC patients. Together, BCYRN1, POU3F2, and miR490-3p constitute a network of competing endogenous RNAs that regulate the migration, invasion and proliferation of HCC[26]. Liu et al[47] discovered that BCYRN1 can enhance the invasion and proliferation of HCC by regulating the BCYRN1/BATF/TM4SF1 targeting axis. Moreover, Lin et al[48] showed that BCYRN1 is overexpressed in HCC and promotes the growth of HCC cells and the formation of tumor tissues by regulating cell cycle-related genes and stemness markers, and prevents the degradation of cyclin E2 mRNA. Through in vivo and in vitro experiments, Tan et al[27] showed that BCYRN1 could affect expression of the c-MYC protein, thereby affecting the levels of apoptotic and anti-apoptotic proteins and promoting the progression of HCC. Combined, these studies strongly confirmed that BCYRN1 is indeed a possible therapeutic target as well as a prognostic marker for HCC.
The TME refers to the complex multicellular environment in which tumors are located during growth and development[49]. The TME is usually composed of three parts, including immune cells, the extracellular matrix and secreted factors and stromal cells, which are mixed with lymphatic vessels and blood vessels to regulate and influence the occurrence and development of tumor cells[50]. In the TME, various immune cells play different roles during antitumor immunotherapy, especially T cells vs B cells[51]. The relationship between the expression level of BCYRN1 and the TME score was investigated. The results showed that the BCYRN1 high expression group had a higher TME score, a higher level of immune and stromal cells and a lower purity of tumors. In addition, the relationship between BCYRN1 expression and the level of various immune cells was investigated, and the results showed that the content of CD8 T cells and plasma cells was higher in the group with low expression, while the number of macrophages M0 was higher in the group with high expression. Thus, BCYRN1 expression is linked to the level of M0 and M2 macrophages, CD8 T cells and plasma cells, and BCYRN1 can regulate the level of the above-mentioned immune cells.
Finally, the connection between BCYRN1 expression and drug sensitivity was also investigated. It was discovered that six drugs were more sensitive in the group with high expression of BCYRN1, thus providing a novel idea for clinical medication. PD-1 and CTLA-4 are important immunotherapeutic targets[52]. The differences in efficacy between these two immunotherapies were analyzed in the high and low BCYRN1 expression groups, and the results showed that the therapeutic effect of anti-CTLA-4 was more pronounced in the low BCYRN1 expression group. Thus, our data showed that BCYRN1 may have great potential in immunotherapy.
Our study has the following limitations. First, data were downloaded from the online database TCGA and were not validated by the laboratory and clinic. Second, although the sample size of the TCGA database is large, the type of database is relatively single. To compensate for the above-mentioned shortcomings, the meta-analysis was performed, which combined all survival prognosis studies of BCYRN1 in HCC and showed that high expression of BCYRN1 in HCC was significantly associated with poor patient prognosis, which was consistent with the conclusions of the bioinformatics. The prognostic value and immunotherapeutic prospects of BCYRN1 in HCC were explored by bioinformatics and meta-analysis, and valuable conclusions were drawn. To further explore the function and underlying mechanism of BCYRN1 in HCC, more in-depth clinical and laboratory studies are required.
Our study revealed that the expression level of BCYRN1 in HCC tissues was significantly higher compared to that in surrounding normal liver tissues and that high BCYRN1 expression was related to a poor prognosis and clinicopathological progression of HCC patients. Furthermore, the expression of BCYRN1 was significantly related to the level of immune cell infiltration, drug sensitivity and immunotherapy responses in HCC. Therefore, BCYRN1 is likely to be a prognostic indicator and a target for the treatment in HCC patients. The prognostic value of BCYRN1 and the promise of immunotherapy need to be further confirmed by large clinical and laboratory studies.
Hepatocellular carcinoma (HCC) is one of the most common types of cancer worldwide and has a high mortality rate. Early detection of HCC can achieve a good 5-year survival rate by surgical treatment, liver transplantation and radiotherapy. Therefore, early diagnosis and treatment is particularly important, and identifying novel sensitive tumor markers and discovering novel molecular therapeutic targets are key goals. Exploring novel immunotherapeutic drugs is another breakthrough.
The expression of brain cytoplasmic RNA1 (BCYRN1) is linked to the clinicopathology and prognosis of several types of cancers, among which HCC is one of the most frequent types of cancer worldwide.
In this study, bioinformatics and meta-analysis were used to explore the prognostic value and immunotherapeutic potential of BCYRN1 in HCC.
Information was obtained from the Cancer Genome Atlas database. First, the correlation between BCYRN1 expression and prognosis and clinicopathologic characteristics of HCC patients was explored. Univariate and multivariate regression analyses were employed to examine the relationship between BCYRN1 and HCC prognosis. Second, potential functions and pathways were explored by means of enrichment analysis of differentially-expressed genes. The relationship between BCYRN1 expression and tumor microenvironment, immune cell infiltration, immune checkpoint, drug sensitivity and immunotherapy effect was also investigated. Finally, three major databases were searched and used to conduct a meta-analysis on the relationship between BCYRN1 expression and patient prognosis.
BCYRN1 expression was significantly higher in HCC compared to normal tissues and was linked to a poor prognosis and clinicopathological characteristics. Enrichment analysis showed that BCYRN1 regulates the extracellular matrix and transmission of signaling molecules, participates in the metabolism of nutrients, such as proteins, and participates in tumor-related pathways. BCYRN1 expression was linked to the tumor microenvironment, immune cell infiltration, drug sensitivity and the efficacy of immunotherapy. Furthermore, the meta-analysis in this study showed that BCYRN1 overexpression was related to a worse outcome in HCC patients.
Our study revealed that high BCYRN1 expression related to a poor prognosis and clinicopathological progression of HCC patients. Furthermore, the expression of BCYRN1 was significantly related to the level of immune cell infiltration, drug sensitivity and immunotherapy responses in HCC.
Overexpression of BCYRN1 relates to poor prognosis and may be a potential prognostic factor and immunotherapeutic target in HCC.
We appreciate the help of the RCA citation tool (https://www.referencecitationanalysis.com/) in improving our article.
Provenance and peer review: Unsolicited article; Externally peer reviewed.
Peer-review model: Single blind
Specialty type: Oncology
Country/Territory of origin: China
Peer-review report’s scientific quality classification
Grade A (Excellent): 0
Grade B (Very good): 0
Grade C (Good): C, C, C
Grade D (Fair): 0
Grade E (Poor): 0
P-Reviewer: Cossiga V, Italy; Qi S, China S-Editor: Zhang H L-Editor: Filipodia P-Editor: Yu HG
| 1. | Vogel A, Meyer T, Sapisochin G, Salem R, Saborowski A. Hepatocellular carcinoma. Lancet. 2022;400:1345-1362. [RCA] [PubMed] [DOI] [Full Text] [Cited by in Crossref: 1284] [Cited by in RCA: 1227] [Article Influence: 409.0] [Reference Citation Analysis (41)] |
| 2. | Sung H, Ferlay J, Siegel RL, Laversanne M, Soerjomataram I, Jemal A, Bray F. Global Cancer Statistics 2020: GLOBOCAN Estimates of Incidence and Mortality Worldwide for 36 Cancers in 185 Countries. CA Cancer J Clin. 2021;71:209-249. [RCA] [PubMed] [DOI] [Full Text] [Cited by in Crossref: 75126] [Cited by in RCA: 64636] [Article Influence: 16159.0] [Reference Citation Analysis (176)] |
| 3. | Siegel RL, Miller KD, Fuchs HE, Jemal A. Cancer statistics, 2022. CA Cancer J Clin. 2022;72:7-33. [RCA] [PubMed] [DOI] [Full Text] [Cited by in Crossref: 4235] [Cited by in RCA: 11431] [Article Influence: 3810.3] [Reference Citation Analysis (4)] |
| 4. | Roayaie S, Jibara G, Tabrizian P, Park JW, Yang J, Yan L, Schwartz M, Han G, Izzo F, Chen M, Blanc JF, Johnson P, Kudo M, Roberts LR, Sherman M. The role of hepatic resection in the treatment of hepatocellular cancer. Hepatology. 2015;62:440-451. [RCA] [PubMed] [DOI] [Full Text] [Cited by in Crossref: 247] [Cited by in RCA: 322] [Article Influence: 32.2] [Reference Citation Analysis (0)] |
| 5. | European Association for the Study of the Liver. EASL Clinical Practice Guidelines: Management of alcohol-related liver disease. J Hepatol. 2018;69:154-181. [RCA] [PubMed] [DOI] [Full Text] [Cited by in Crossref: 636] [Cited by in RCA: 588] [Article Influence: 84.0] [Reference Citation Analysis (0)] |
| 6. | Cheng AL, Hsu C, Chan SL, Choo SP, Kudo M. Challenges of combination therapy with immune checkpoint inhibitors for hepatocellular carcinoma. J Hepatol. 2020;72:307-319. [RCA] [PubMed] [DOI] [Full Text] [Cited by in Crossref: 207] [Cited by in RCA: 373] [Article Influence: 74.6] [Reference Citation Analysis (1)] |
| 7. | Greten TF, Lai CW, Li G, Staveley-O'Carroll KF. Targeted and Immune-Based Therapies for Hepatocellular Carcinoma. Gastroenterology. 2019;156:510-524. [RCA] [PubMed] [DOI] [Full Text] [Cited by in Crossref: 168] [Cited by in RCA: 200] [Article Influence: 33.3] [Reference Citation Analysis (0)] |
| 8. | Huynh NP, Anderson BA, Guilak F, McAlinden A. Emerging roles for long noncoding RNAs in skeletal biology and disease. Connect Tissue Res. 2017;58:116-141. [RCA] [PubMed] [DOI] [Full Text] [Cited by in Crossref: 69] [Cited by in RCA: 84] [Article Influence: 10.5] [Reference Citation Analysis (0)] |
| 9. | Gugnoni M, Ciarrocchi A. Long Noncoding RNA and Epithelial Mesenchymal Transition in Cancer. Int J Mol Sci. 2019;20. [RCA] [PubMed] [DOI] [Full Text] [Full Text (PDF)] [Cited by in Crossref: 89] [Cited by in RCA: 114] [Article Influence: 19.0] [Reference Citation Analysis (0)] |
| 10. | Anastasiadou E, Jacob LS, Slack FJ. Non-coding RNA networks in cancer. Nat Rev Cancer. 2018;18:5-18. [RCA] [PubMed] [DOI] [Full Text] [Cited by in Crossref: 1289] [Cited by in RCA: 1426] [Article Influence: 203.7] [Reference Citation Analysis (0)] |
| 11. | Geisler S, Coller J. RNA in unexpected places: long non-coding RNA functions in diverse cellular contexts. Nat Rev Mol Cell Biol. 2013;14:699-712. [RCA] [PubMed] [DOI] [Full Text] [Cited by in Crossref: 1015] [Cited by in RCA: 1155] [Article Influence: 96.3] [Reference Citation Analysis (0)] |
| 12. | Eptaminitaki GC, Wolff N, Stellas D, Sifakis K, Baritaki S. Long Non-Coding RNAs (lncRNAs) in Response and Resistance to Cancer Immunosurveillance and Immunotherapy. Cells. 2021;10. [RCA] [PubMed] [DOI] [Full Text] [Full Text (PDF)] [Cited by in Crossref: 6] [Cited by in RCA: 28] [Article Influence: 7.0] [Reference Citation Analysis (0)] |
| 13. | Slack FJ, Chinnaiyan AM. The Role of Non-coding RNAs in Oncology. Cell. 2019;179:1033-1055. [RCA] [PubMed] [DOI] [Full Text] [Cited by in Crossref: 521] [Cited by in RCA: 1113] [Article Influence: 222.6] [Reference Citation Analysis (0)] |
| 14. | Wells AC, Pobezinskaya EL, Pobezinsky LA. Non-coding RNAs in CD8 T cell biology. Mol Immunol. 2020;120:67-73. [RCA] [PubMed] [DOI] [Full Text] [Cited by in Crossref: 24] [Cited by in RCA: 28] [Article Influence: 5.6] [Reference Citation Analysis (0)] |
| 15. | Ghafouri-Fard S, Dashti S, Hussen BM, Farsi M, Taheri M. BCYRN1: An oncogenic lncRNA in diverse cancers. Pathol Res Pract. 2021;220:153385. [RCA] [PubMed] [DOI] [Full Text] [Cited by in Crossref: 4] [Cited by in RCA: 13] [Article Influence: 3.3] [Reference Citation Analysis (0)] |
| 16. | Han X, Wang Y, Zhao R, Zhang G, Qin C, Fu L, Jin H, Jiang X, Yang K, Cai H. Clinicopathological Significance and Prognostic Values of Long Noncoding RNA BCYRN1 in Cancer Patients: A Meta-Analysis and Bioinformatics Analysis. J Oncol. 2022;2022:8903265. [RCA] [PubMed] [DOI] [Full Text] [Full Text (PDF)] [Reference Citation Analysis (0)] |
| 17. | Hu T, Lu YR. BCYRN1, a c-MYC-activated long non-coding RNA, regulates cell metastasis of non-small-cell lung cancer. Cancer Cell Int. 2015;15:36. [RCA] [PubMed] [DOI] [Full Text] [Full Text (PDF)] [Cited by in Crossref: 72] [Cited by in RCA: 99] [Article Influence: 9.9] [Reference Citation Analysis (1)] |
| 18. | Zhai H, Li Y. BCYRN1 is correlated with progression and prognosis in gastric cancer. Biosci Rep. 2019;39. [RCA] [PubMed] [DOI] [Full Text] [Full Text (PDF)] [Cited by in Crossref: 12] [Cited by in RCA: 12] [Article Influence: 2.4] [Reference Citation Analysis (0)] |
| 19. | Ren H, Yang X, Yang Y, Zhang X, Zhao R, Wei R, Zhang Y. Upregulation of LncRNA BCYRN1 promotes tumor progression and enhances EpCAM expression in gastric carcinoma. Oncotarget. 2018;9:4851-4861. [RCA] [PubMed] [DOI] [Full Text] [Full Text (PDF)] [Cited by in Crossref: 16] [Cited by in RCA: 20] [Article Influence: 2.5] [Reference Citation Analysis (0)] |
| 20. | Zheng H, Chen C, Luo Y, Yu M, He W, An M, Gao B, Kong Y, Ya Y, Lin Y, Li Y, Xie K, Huang J, Lin T. Tumor-derived exosomal BCYRN1 activates WNT5A/VEGF-C/VEGFR3 feedforward loop to drive lymphatic metastasis of bladder cancer. Clin Transl Med. 2021;11:e497. [RCA] [PubMed] [DOI] [Full Text] [Full Text (PDF)] [Cited by in Crossref: 49] [Cited by in RCA: 72] [Article Influence: 18.0] [Reference Citation Analysis (0)] |
| 21. | Huo W, Qi F, Wang K. Long noncoding RNA BCYRN1 promotes prostate cancer progression via elevation of HDAC11. Oncol Rep. 2020;44:1233-1245. [RCA] [PubMed] [DOI] [Full Text] [Cited by in Crossref: 8] [Cited by in RCA: 20] [Article Influence: 4.0] [Reference Citation Analysis (0)] |
| 22. | Wu K, Xu K, Liu K, Huang J, Chen J, Zhang J, Zhang N. Long noncoding RNA BC200 regulates cell growth and invasion in colon cancer. Int J Biochem Cell Biol. 2018;99:219-225. [RCA] [PubMed] [DOI] [Full Text] [Cited by in Crossref: 33] [Cited by in RCA: 50] [Article Influence: 7.1] [Reference Citation Analysis (0)] |
| 23. | Yang L, Zhang Y, Bao J, Feng JF. Long non-coding RNA BCYRN1 exerts an oncogenic role in colorectal cancer by regulating the miR-204-3p/KRAS axis. Cancer Cell Int. 2020;20:453. [RCA] [PubMed] [DOI] [Full Text] [Full Text (PDF)] [Cited by in Crossref: 15] [Cited by in RCA: 9] [Article Influence: 1.8] [Reference Citation Analysis (0)] |
| 24. | Chen L, Shi Q, Fan B, Cai Y. Role of lncRNA BCYRN1 in trophoblast cell physiology and pathogenesis of preeclampsia. Exp Ther Med. 2021;22:1137. [RCA] [PubMed] [DOI] [Full Text] [Full Text (PDF)] [Reference Citation Analysis (0)] |
| 25. | Gu L, Lu L, Zhou D, Liu Z. Long Noncoding RNA BCYRN1 Promotes the Proliferation of Colorectal Cancer Cells via Up-Regulating NPR3 Expression. Cell Physiol Biochem. 2018;48:2337-2349. [RCA] [PubMed] [DOI] [Full Text] [Cited by in Crossref: 29] [Cited by in RCA: 41] [Article Influence: 5.9] [Reference Citation Analysis (0)] |
| 26. | Ding S, Jin Y, Hao Q, Kang Y, Ma R. LncRNA BCYRN1/miR-490-3p/POU3F2, served as a ceRNA network, is connected with worse survival rate of hepatocellular carcinoma patients and promotes tumor cell growth and metastasis. Cancer Cell Int. 2020;20:6. [RCA] [PubMed] [DOI] [Full Text] [Full Text (PDF)] [Cited by in Crossref: 17] [Cited by in RCA: 27] [Article Influence: 5.4] [Reference Citation Analysis (0)] |
| 27. | Tan N, Zhu B, Shu H, Tao YF, Wu JR, Fang M, Li CR, Chen ZQ, Ou C. Effect of lncRNA‑BC200 on proliferation and migration of liver cancer cells in vitro and in vivo. Oncol Rep. 2020;43:461-470. [RCA] [PubMed] [DOI] [Full Text] [Full Text (PDF)] [Cited by in Crossref: 3] [Cited by in RCA: 12] [Article Influence: 2.0] [Reference Citation Analysis (0)] |
| 28. | Ming XL, Feng YL, He DD, Luo CL, Rong JL, Zhang WW, Ye P, Chai HY, Liang CZ, Tu JC. Role of BCYRN1 in hepatocellular carcinoma pathogenesis by lncRNA-miRNA-mRNA network analysis and its diagnostic and prognostic value. Epigenomics. 2019;11:1209-1231. [RCA] [PubMed] [DOI] [Full Text] [Cited by in Crossref: 11] [Cited by in RCA: 15] [Article Influence: 2.5] [Reference Citation Analysis (0)] |
| 29. | Booy EP, McRae EK, Koul A, Lin F, McKenna SA. The long non-coding RNA BC200 (BCYRN1) is critical for cancer cell survival and proliferation. Mol Cancer. 2017;16:109. [RCA] [PubMed] [DOI] [Full Text] [Full Text (PDF)] [Cited by in Crossref: 49] [Cited by in RCA: 73] [Article Influence: 9.1] [Reference Citation Analysis (1)] |
| 30. | Liberati A, Altman DG, Tetzlaff J, Mulrow C, Gøtzsche PC, Ioannidis JP, Clarke M, Devereaux PJ, Kleijnen J, Moher D. The PRISMA statement for reporting systematic reviews and meta-analyses of studies that evaluate healthcare interventions: explanation and elaboration. BMJ. 2009;339:b2700. [RCA] [PubMed] [DOI] [Full Text] [Cited by in Crossref: 13930] [Cited by in RCA: 13355] [Article Influence: 834.7] [Reference Citation Analysis (0)] |
| 31. | Zhou F, Shang W, Yu X, Tian J. Glypican-3: A promising biomarker for hepatocellular carcinoma diagnosis and treatment. Med Res Rev. 2018;38:741-767. [RCA] [PubMed] [DOI] [Full Text] [Cited by in Crossref: 144] [Cited by in RCA: 257] [Article Influence: 32.1] [Reference Citation Analysis (0)] |
| 32. | Xie C, Li SY, Fang JH, Zhu Y, Yang JE. Functional long non-coding RNAs in hepatocellular carcinoma. Cancer Lett. 2021;500:281-291. [RCA] [PubMed] [DOI] [Full Text] [Cited by in Crossref: 9] [Cited by in RCA: 35] [Article Influence: 7.0] [Reference Citation Analysis (0)] |
| 33. | Lim LJ, Wong SYS, Huang F, Lim S, Chong SS, Ooi LL, Kon OL, Lee CG. Roles and Regulation of Long Noncoding RNAs in Hepatocellular Carcinoma. Cancer Res. 2019;79:5131-5139. [RCA] [PubMed] [DOI] [Full Text] [Cited by in Crossref: 90] [Cited by in RCA: 155] [Article Influence: 25.8] [Reference Citation Analysis (0)] |
| 34. | Yuan D, Chen Y, Li X, Li J, Zhao Y, Shen J, Du F, Kaboli PJ, Li M, Wu X, Ji H, Cho CH, Wen Q, Li W, Xiao Z, Chen B. Long Non-Coding RNAs: Potential Biomarkers and Targets for Hepatocellular Carcinoma Therapy and Diagnosis. Int J Biol Sci. 2021;17:220-235. [RCA] [PubMed] [DOI] [Full Text] [Full Text (PDF)] [Cited by in Crossref: 12] [Cited by in RCA: 34] [Article Influence: 8.5] [Reference Citation Analysis (0)] |
| 35. | Sarfaraz N, Somarowthu S, Bouchard MJ. The interplay of long noncoding RNAs and hepatitis B virus. J Med Virol. 2023;95:e28058. [RCA] [PubMed] [DOI] [Full Text] [Cited by in RCA: 11] [Reference Citation Analysis (0)] |
| 36. | Sheng J, Lv E, Xia L, Huang W. Emerging roles and potential clinical applications of long non-coding RNAs in hepatocellular carcinoma. Biomed Pharmacother. 2022;153:113327. [RCA] [PubMed] [DOI] [Full Text] [Cited by in Crossref: 1] [Cited by in RCA: 8] [Article Influence: 2.7] [Reference Citation Analysis (0)] |
| 37. | Spano D, Russo R, Di Maso V, Rosso N, Terracciano LM, Roncalli M, Tornillo L, Capasso M, Tiribelli C, Iolascon A. Galectin-1 and its involvement in hepatocellular carcinoma aggressiveness. Mol Med. 2010;16:102-115. [RCA] [PubMed] [DOI] [Full Text] [Cited by in Crossref: 57] [Cited by in RCA: 63] [Article Influence: 3.9] [Reference Citation Analysis (0)] |
| 38. | Song C, Su Z, Guo J. Thymosin β 10 is overexpressed and associated with unfavorable prognosis in hepatocellular carcinoma. Biosci Rep. 2019;39. [RCA] [PubMed] [DOI] [Full Text] [Full Text (PDF)] [Cited by in Crossref: 7] [Cited by in RCA: 18] [Article Influence: 3.0] [Reference Citation Analysis (0)] |
| 39. | Lin ZY, Chuang YH, Chuang WL. Cancer-associated fibroblasts up-regulate CCL2, CCL26, IL6 and LOXL2 genes related to promotion of cancer progression in hepatocellular carcinoma cells. Biomed Pharmacother. 2012;66:525-529. [RCA] [PubMed] [DOI] [Full Text] [Cited by in Crossref: 60] [Cited by in RCA: 73] [Article Influence: 5.6] [Reference Citation Analysis (0)] |
| 40. | Luo X, Xie H, Long X, Zhou M, Xu Z, Shi B, Jiang H, Li Z. EGFRvIII mediates hepatocellular carcinoma cell invasion by promoting S100 calcium binding protein A11 expression. PLoS One. 2013;8:e83332. [RCA] [PubMed] [DOI] [Full Text] [Full Text (PDF)] [Cited by in Crossref: 21] [Cited by in RCA: 25] [Article Influence: 2.1] [Reference Citation Analysis (0)] |
| 41. | Peng Q, Hao LY, Guo YL, Zhang ZQ, Ji JM, Xue Y, Liu YW, Lu JL, Li CG, Shi XL. Solute carrier family 2 members 1 and 2 as prognostic biomarkers in hepatocellular carcinoma associated with immune infiltration. World J Clin Cases. 2022;10:3989-4019. [RCA] [PubMed] [DOI] [Full Text] [Full Text (PDF)] [Cited by in CrossRef: 11] [Cited by in RCA: 6] [Article Influence: 2.0] [Reference Citation Analysis (1)] |
| 42. | Huang Y, Xian L, Liu Z, Wei L, Qin L, Xiong Y, Hu L, Zhou S, Fu Q, Li B, Qin Y. AMPKα2/HNF4A/BORIS/GLUT4 pathway promotes hepatocellular carcinoma cell invasion and metastasis in low glucose microenviroment. Biochem Pharmacol. 2022;203:115198. [RCA] [PubMed] [DOI] [Full Text] [Cited by in RCA: 20] [Reference Citation Analysis (0)] |
| 43. | Théret N, Bouezzedine F, Azar F, Diab-Assaf M, Legagneux V. ADAM and ADAMTS Proteins, New Players in the Regulation of Hepatocellular Carcinoma Microenvironment. Cancers (Basel). 2021;13. [RCA] [PubMed] [DOI] [Full Text] [Full Text (PDF)] [Cited by in Crossref: 4] [Cited by in RCA: 22] [Article Influence: 5.5] [Reference Citation Analysis (0)] |
| 44. | Carloni V, Luong TV, Rombouts K. Hepatic stellate cells and extracellular matrix in hepatocellular carcinoma: more complicated than ever. Liver Int. 2014;34:834-843. [RCA] [PubMed] [DOI] [Full Text] [Cited by in Crossref: 108] [Cited by in RCA: 134] [Article Influence: 12.2] [Reference Citation Analysis (0)] |
| 45. | Wang WJ, Mao LF, Lai HL, Wang YW, Jiang ZB, Li W, Huang JM, Xie YJ, Xu C, Liu P, Li YM, Leung ELH, Yao XJ. Dolutegravir derivative inhibits proliferation and induces apoptosis of non-small cell lung cancer cells via calcium signaling pathway. Pharmacol Res. 2020;161:105129. [RCA] [PubMed] [DOI] [Full Text] [Cited by in Crossref: 31] [Cited by in RCA: 32] [Article Influence: 6.4] [Reference Citation Analysis (0)] |
| 46. | Zhou Y, Xu J, Luo H, Meng X, Chen M, Zhu D. Wnt signaling pathway in cancer immunotherapy. Cancer Lett. 2022;525:84-96. [RCA] [PubMed] [DOI] [Full Text] [Cited by in Crossref: 5] [Cited by in RCA: 125] [Article Influence: 41.7] [Reference Citation Analysis (0)] |
| 47. | Liu Y, Liu MJ, Jiao M, Jiang LL, Fu X, Wang WJ. Long Noncoding RNA BCYRN1 Recruits BATF to Promote TM4SF1 Upregulation and Enhance HCC Cell Proliferation and Invasion. Dis Markers. 2022;2022:1561607. [RCA] [PubMed] [DOI] [Full Text] [Full Text (PDF)] [Cited by in Crossref: 1] [Cited by in RCA: 1] [Article Influence: 0.3] [Reference Citation Analysis (0)] |
| 48. | Lin YH, Wu MH, Huang YH, Yeh CT, Chi HC, Tsai CY, Chuang WY, Yu CJ, Chung IH, Chen CY, Lin KH. Thyroid hormone negatively regulates tumorigenesis through suppression of BC200. Endocr Relat Cancer. 2018;25:967-979. [RCA] [PubMed] [DOI] [Full Text] [Cited by in Crossref: 15] [Cited by in RCA: 17] [Article Influence: 2.4] [Reference Citation Analysis (0)] |
| 49. | Bejarano L, Jordāo MJC, Joyce JA. Therapeutic Targeting of the Tumor Microenvironment. Cancer Discov. 2021;11:933-959. [RCA] [PubMed] [DOI] [Full Text] [Cited by in Crossref: 151] [Cited by in RCA: 919] [Article Influence: 229.8] [Reference Citation Analysis (0)] |
| 50. | Xiao Y, Yu D. Tumor microenvironment as a therapeutic target in cancer. Pharmacol Ther. 2021;221:107753. [RCA] [PubMed] [DOI] [Full Text] [Cited by in Crossref: 67] [Cited by in RCA: 1135] [Article Influence: 227.0] [Reference Citation Analysis (2)] |
| 51. | Xie Y, Xie F, Zhang L, Zhou X, Huang J, Wang F, Jin J, Zeng L, Zhou F. Targeted Anti-Tumor Immunotherapy Using Tumor Infiltrating Cells. Adv Sci (Weinh). 2021;8:e2101672. [RCA] [PubMed] [DOI] [Full Text] [Full Text (PDF)] [Cited by in Crossref: 47] [Cited by in RCA: 41] [Article Influence: 10.3] [Reference Citation Analysis (0)] |
| 52. | Zhang H, Dai Z, Wu W, Wang Z, Zhang N, Zhang L, Zeng WJ, Liu Z, Cheng Q. Regulatory mechanisms of immune checkpoints PD-L1 and CTLA-4 in cancer. J Exp Clin Cancer Res. 2021;40:184. [RCA] [PubMed] [DOI] [Full Text] [Full Text (PDF)] [Cited by in Crossref: 321] [Cited by in RCA: 328] [Article Influence: 82.0] [Reference Citation Analysis (0)] |


