Published online Nov 15, 2022. doi: 10.4251/wjgo.v14.i11.2097
Peer-review started: March 25, 2022
First decision: June 2, 2022
Revised: June 16, 2022
Accepted: October 17, 2022
Article in press: October 17, 2022
Published online: November 15, 2022
Processing time: 235 Days and 9.9 Hours
Proteomic signatures of Ming's infiltrative gastric cancer (IGC) remain unknown.
To elucidate the molecular characteristics of IGC at the proteomics level.
Twelve pairs of IGC and adjacent normal tissues were collected and their proteomes were analyzed by high performance liquid chromatography tandem mass spectrometry. The identified peptides were sequenced de novo and matched against the SwissProt database using Maxquant software. The differentially expressed proteins (DEPs) were screened using |log2(Fold change)| > 1 and P-adj < 0.01 as the thresholds. The expression levels of selected proteins were verified by Western blotting. The interaction network of the DEPs was constructed with the STRING database and visualized using Cytoscape with cytoHubba software. The DEPs were functionally annotated using clusterProfiler, STRING and DAVID for Gene Ontology (GO) and Kyoto Encyclopedia of Genes and Genomes (KEGG) pathways. P < 0.05 was considered statistically significant.
A total of 7361 DEPs were identified, of which 94 were significantly up-regulated and 223 were significantly down-regulated in IGC relative to normal gastric tissues. The top 10 up-regulated proteins were MRTO4, BOP1, PES1, WDR12, BRIX1, NOP2, POLR1C, NOC2L, MYBBP1A and TSR1, and the top 10 down-regulated proteins were NDUFS8, NDUFS6, NDUFA8, NDUFA5, NDUFC2, NDUFB8, NDUFB5, NDUFB9, UQCRC2 and UQCRC1. The up-regulated proteins were enriched for 9 biological processes including DNA replication, ribosome biogenesis and initiation of DNA replication, and the cellular component MCM complex. Among the down-regulated proteins, 17 biological processes were enriched, including glucose metabolism, pyruvic acid metabolism and fatty acid β-oxidation. In addition, the mitochondrial inner membrane, mitochondrial matrix and mitochondrial proton transport ATP synthase complex were among the 6 enriched cellular components, and 11 molecular functions including reduced nicotinamide adenine dinucleotide dehydrogenase activity, acyl-CoA dehydrogenase activity and nicotinamide adenine dinucleotide binding were also enriched. The significant KEGG pathways for the up-regulated proteins were DNA replication, cell cycle and mismatch repair, whereas 18 pathways including oxidative phosphorylation, fatty acid degradation and phenylalanine metabolism were significantly enriched among the down-regulated proteins.
The proteins involved in cell cycle regulation, DNA replication and mismatch repair, and metabolism were significantly altered in IGC, and the proteomic profile may enable the discovery of novel biomarkers.
Core Tip: A total of 7361 proteins were identified and 317 proteins were significantly abnormally expressed in infiltrative gastric cancer (IGC). Twenty hub proteins were found and some of them were verified in IGC. Cell cycle regulation, DNA replication and mismatch repair, and metabolism were significantly altered in IGC.
- Citation: Zhang LH, Zhuo HQ, Hou JJ, Zhou Y, Cheng J, Cai JC. Proteomic signatures of infiltrative gastric cancer by proteomic and bioinformatic analysis. World J Gastrointest Oncol 2022; 14(11): 2097-2107
- URL: https://www.wjgnet.com/1948-5204/full/v14/i11/2097.htm
- DOI: https://dx.doi.org/10.4251/wjgo.v14.i11.2097
Gastric cancer (GC) is the fourth most prevalent malignancy worldwide and ranks third in terms of mortality, especially in Asia[1,2]. It is divided into infiltrative GC (IGC) and expanding GC (EGC) according to Ming’s system of classification, which is related to Bormann classification (protrusion and ulcer type), Lauren classification (intestinal and diffuse type) and World Health Organization classifica
Twelve pairs of IGC tissues and normal resection margin tissues were obtained from Zhongshan Hospital Affiliated to Xiamen University. The samples were fixed in formalin and snap frozen at -80 °C. The frozen tissue sections were stained with hematoxylin and eosin as per standard protocols, and examined by the chief surgeon and chief physician of the pathology department. All patients signed an informed consent form, and the study was approved by the ethics committee of Zhongshan Hospital affiliated to Xiamen University.
The frozen tissue samples were homogenized in liquid nitrogen, and ultrasonicated with lysis buffer (8 mol/L urea, 1% protease inhibitor and 2 mmol/L EDTA). The protein samples were reduced with 5 mmol/L dithiothreitol at 56 °C for 30 min, and then incubated with 11 mmol/L iodoacetamide for 15 min at room temperature in the dark. The urea concentration of the sample was diluted to less than 2 mol/L.
The peptides were fractionated by high pH reverse HPLC using an Agilent 300 Extend C18 column (5 μm particle size, 4.6 mm inner diameter, 250 mm length), and a step gradient of 8% to 32% acetonitrile at pH 9. Sixty components were separated in 60 min. The peptides were pooled into 6 components and freeze-dried under vacuum. The lyophilized peptides were dissolved in 0.1% v/v aqueous formic acid and then separated using the EASY-nLC 1000 ultra-high performance liquid system. Mobile phase A consisted of 0.1% formic acid and 2% acetonitrile, and mobile phase B was an aqueous solution of 0.1% formic acid and 90% acetonitrile. The gradient setting was as follows: 0-62 min, 5%-22% B; 62-82 min, 22%-35% B; 82-86 min, 35%-80% B; 86-90 min, 80% B. The flow rate was maintained at 450 nL/min.
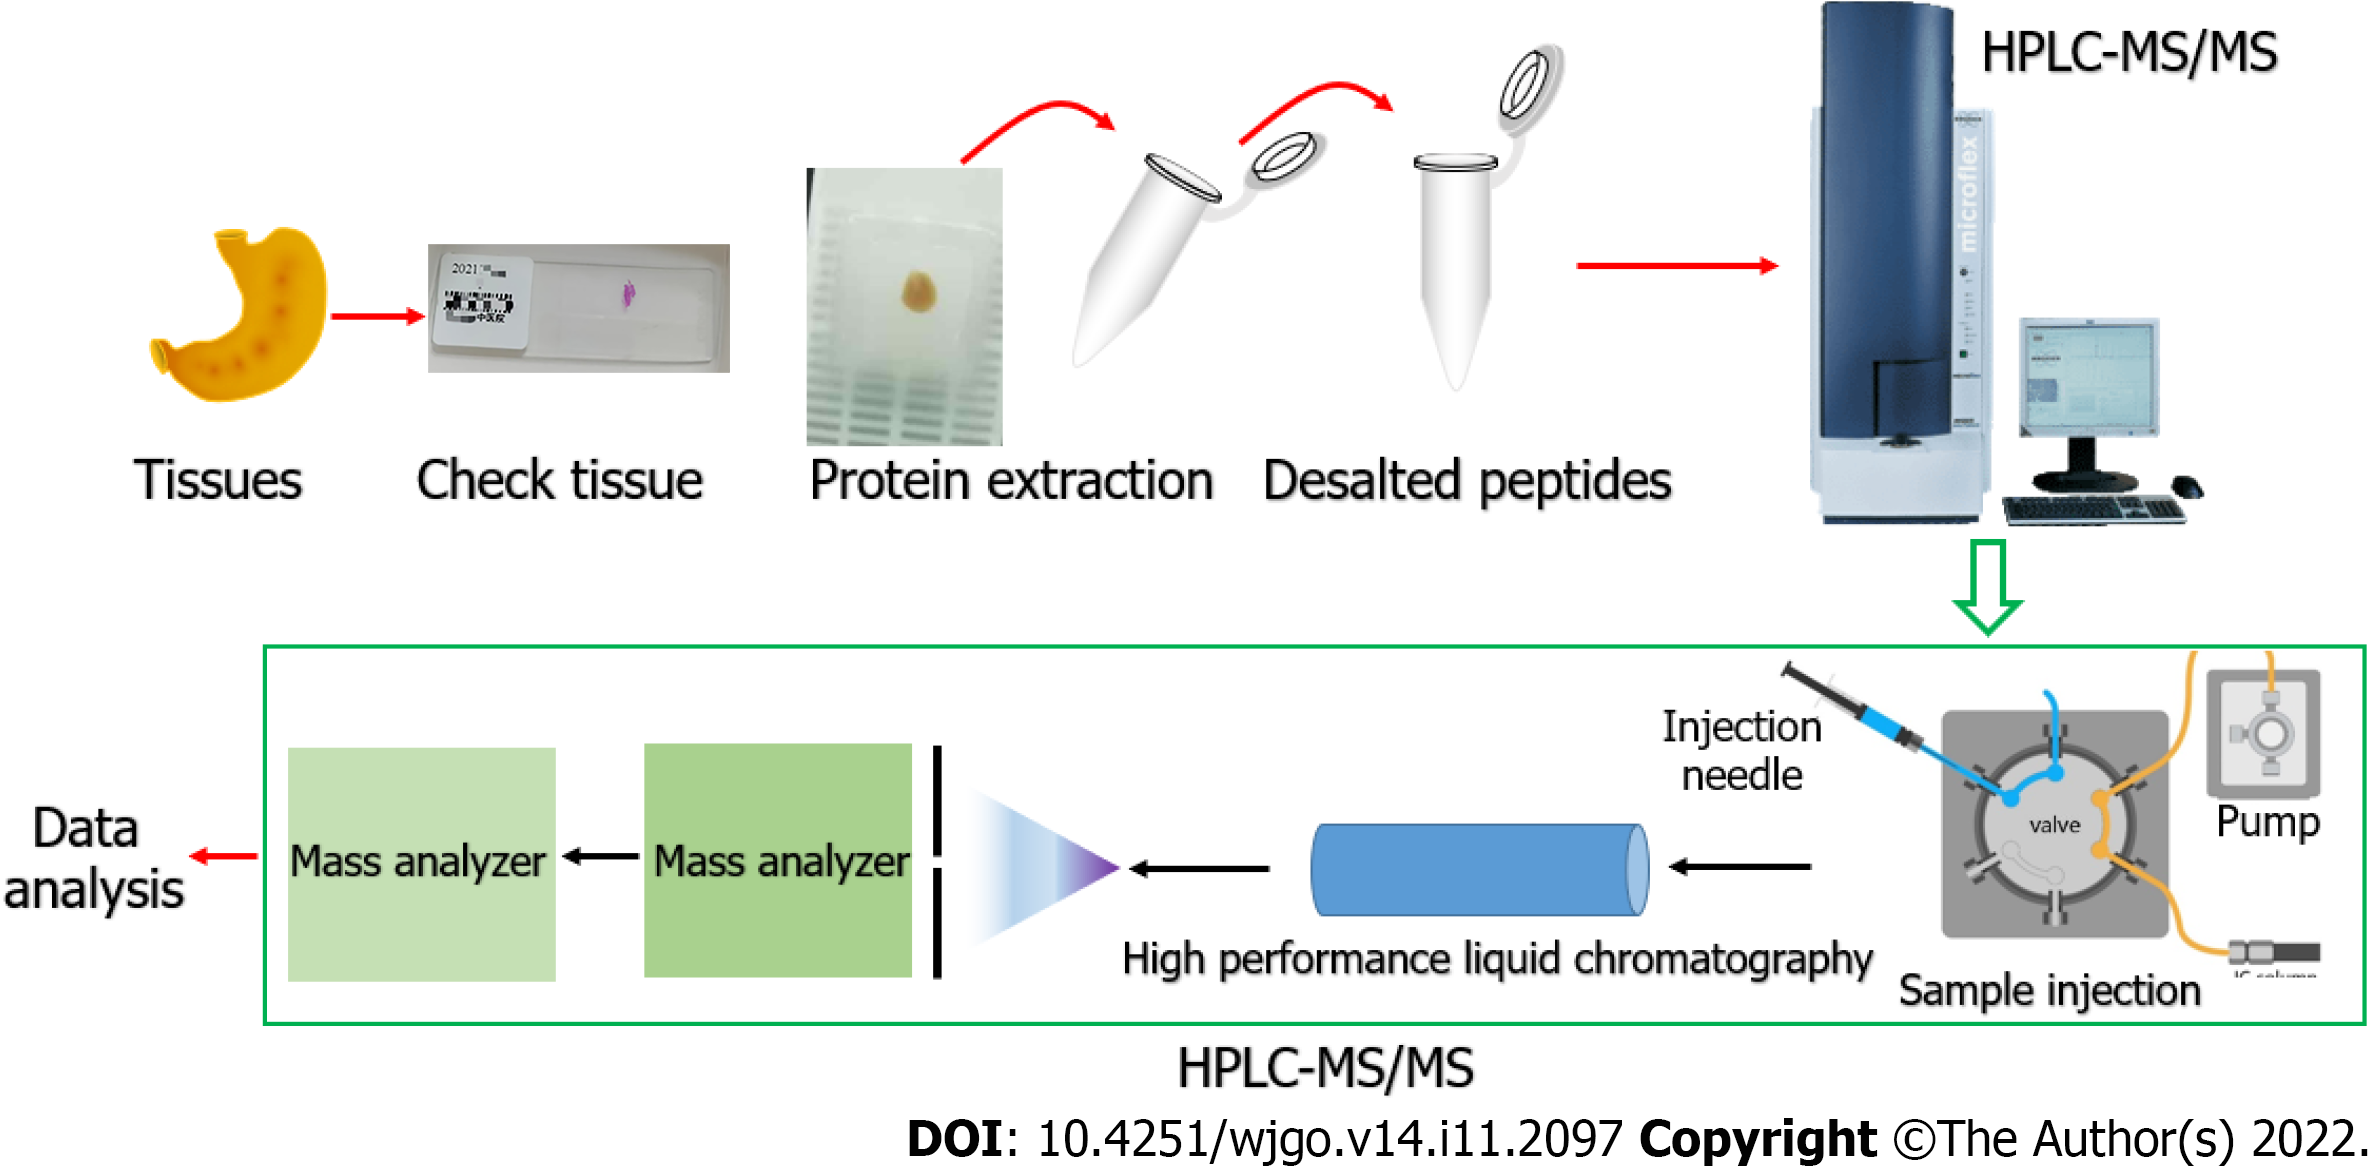
The separated peptides were then injected into the NSI ion source and analyzed by the Q ExactiveTM Plus mass spectrometer. The ion source voltage was set to 2 kV, and the peptide precursor ions and their secondary fragments were detected and analyzed by high-resolution Orbitrap. The scanning range of the primary mass spectrometer was set to 350-1800 m/z, the scanning resolution to 70000, and the secondary scanning resolution to 17500. Data were acquired using a data-dependent scanning program. The entire process of HPLC-MS/MS is briefly summarized and shown in Figure 1.
The secondary mass spectrum data were searched against the SwissProtHuman (20317 sequences) database using Maxquant (version 1.5.2.8). The search parameters were as follows: restriction enzyme: Trypsin/P; number of missing cleavage sites: 2; mass error tolerance of the primary precursor ion of the first search and the main search: 20 ppm and 5 ppm, respectively; mass error tolerance of the secondary fragment ion: 0.02 Da; fixed modification: cysteine alkylation; and variable modification: oxidation of methionine and acetylation of the N-terminus. The false discovery rate for protein identification and PSM identification was set to 1%.
Total protein was extracted using RIPA lysis buffer (Thermo Scientific, United Kingdom), and its concentration was determined with an enhanced bicinchoninic acid assay kit (CWBio, China). Around 40 mg protein per sample was separated by sodium dodecyl sulfate-polyacrylamide gel electrophoresis, and transferred to polyvinylidene difluoride membranes (CWBio, China). After blocking with 5% non-fat milk for 1 h at room temperature, the membranes were incubated overnight with primary antibodies targeting MRTO4 (1:2000, ab212044, Abcam, United States), BOP1 (1:3000, ab32053, Abcam, United States), PES1 (1:5000, ab56701, Abcam, United States), NDUFS8 (1:3000, ab226760, Abcam, United States), NDUFS6 (1:3000, ab226760, Abcam, United States), NDUFA8 (1:3000, ab226760, Abcam, United States) and β-actin (1:5000, ab8226, Abcam, United States) at 4 °C. The membranes were washed thrice with TBST (Tris-buffered saline with Tween 60), and probed with horseradish peroxidase-conjugated secondary antibody (1:5000) for 1.5 h at room temperature. The protein bands were visualized using an enhanced chemiluminescence system, and the membranes were exposed to X-ray films (Bio-Rad, United States). Densitometric analysis was performed using Image Pro-Plus software (Media Cybernetics, United States), and relative protein expression levels were normalized to β-actin.
The protein-protein interaction (PPI) network was analyzed using STRING (https://string-db.org/, version 11.0)[7] with Homo sapiens as the species. The DEPs were imported into the STRING website, and the Cytoscape plug-in cytoHubba was used to screen for hub proteins. The data were from experiments, databases, co-expression and co-occurrence, and the interaction score was 0.4. The TSV format file of PPI results was imported into Cytoscape (version 3.8.2) software for visual editing and network display.
ClusterProfiler enrichment analysis: The bioconductor, org.Hs.eg.db and clusterProfiler packages[8] were simultaneously installed in the R software. The gene names of the DEPs were converted to the ENTERZID format using org.Hs.eg.db package. The enrichGO software was used for GO (biological processes, BP; cell components, CC; molecular functions, MF) enrichment analysis and enrichKEGG for KEGG pathway enrichment analysis. P value < 0.05 was considered as a significant enrichment.
STRING enrichment analysis: The selected proteomic gene names were enriched and analyzed on the STRING website (https://string-db.org/, version 11.0) using the full network mode with Homo sapiens as the enriched species. The type of interactions between the proteins was indicated by the network connection line. The data were retrieved from experiments, databases, and co-expression and co-occurrence analyses. The interaction score was set at 0.4, and P value < 0.05 was considered significant.
DAVID enrichment analysis: The selected proteomic genes were enriched in DAVID version 6.8 (The Database for Annotation, Visualization and Integrated Discovery; https://david.ncifcrf.gov/)[9,10] with Homo sapiens as the selected species. GO enrichment was analyzed by Gene_Ontology, and KEGG pathways by KEGG_PATHWAY. P value < 0.05 was considered statistically significant.
The difference in protein expression levels between IGC and normal tissues was analyzed by the paired t test using R (version R4.0.3, https://www.r-project.org/). The volcano graph was plotted using the ggplot and ggrepel packages. The protein interaction network was visualized in Cytoscape (version 3.8.2, https://cytoscape.org/) software[11]. The pictures were edited using Adobe Photoshop CS6 software.
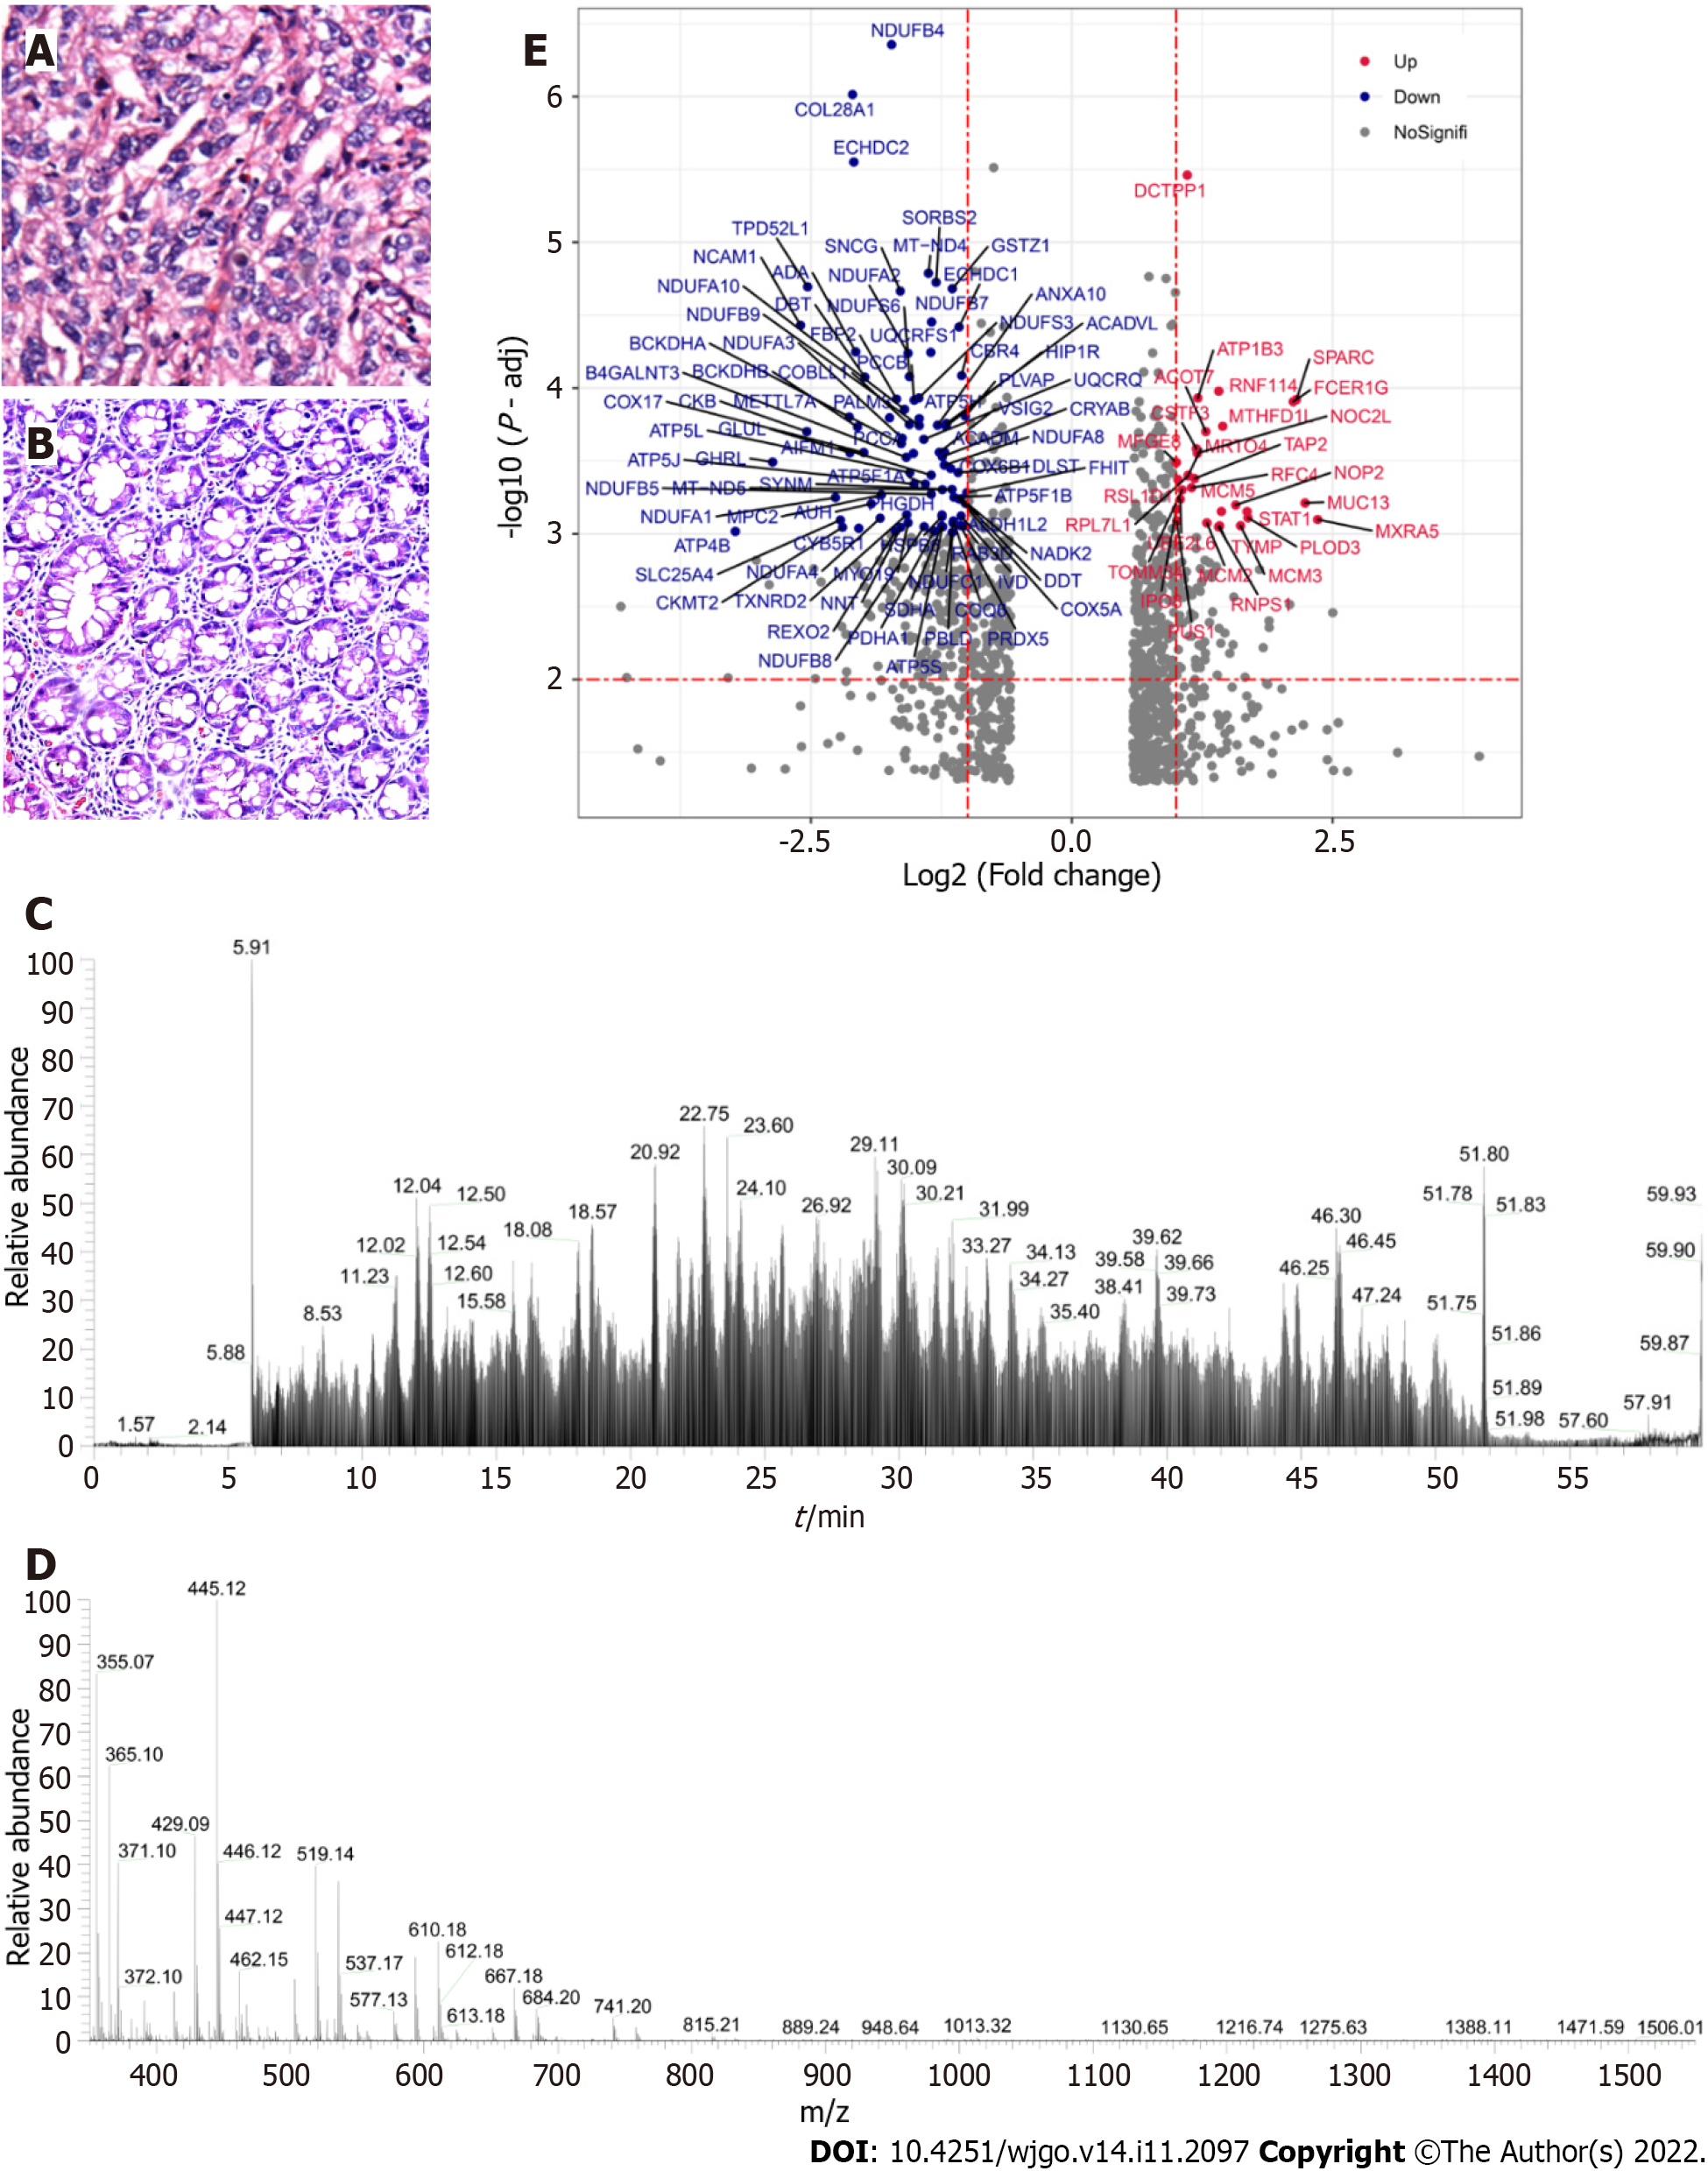
The proteomes of 12 pairs of histo-pathologically confirmed IGC and adjacent normal gastric tissues (Figure 2A and B) were profiled. The representative MS/MS fragments are shown in Figure 2C, and the expanded region of a single FTMS full scan with a mass range of 400-1800 m/z is shown in Figure 2D. There were a total of 7361 DEPs between IGC and normal tissues (P < 0.01), of which 94 were up-regulated and 223 were downregulated in the IGC samples (Figure 2E).
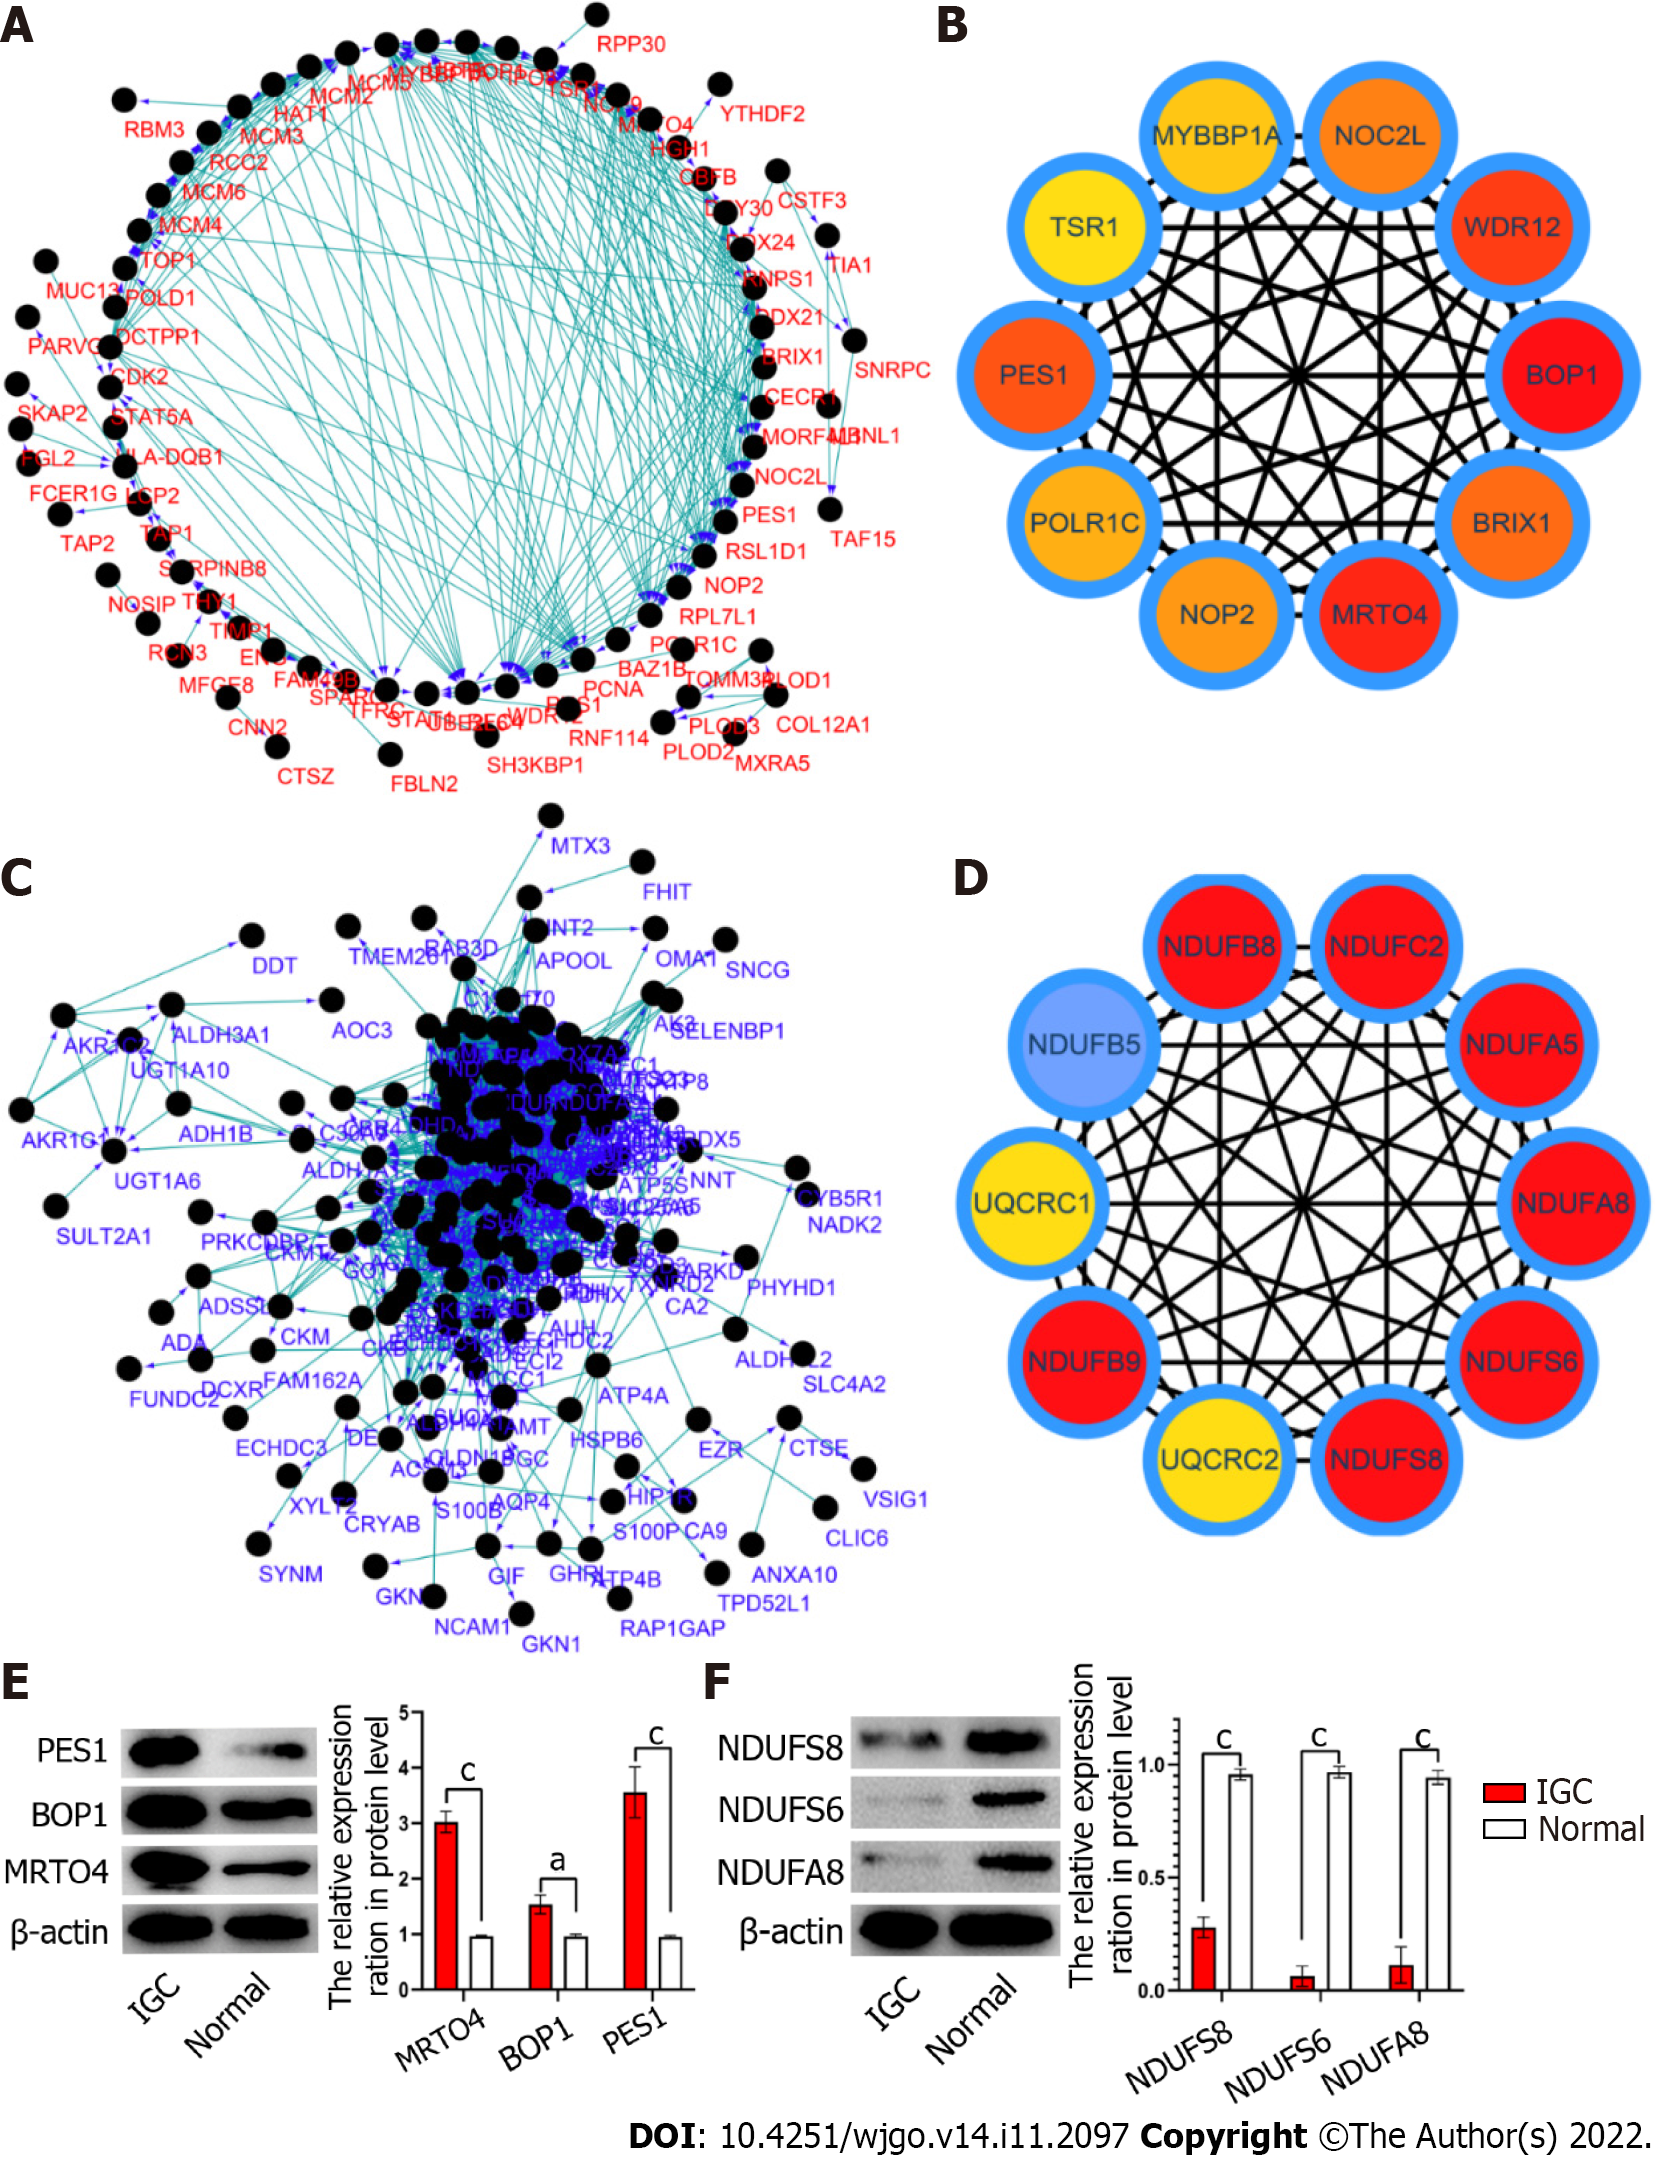
The interaction networks of the upregulated and downregulated proteins in IGC are shown in Figure 3A and C, respectively. According to the MCC algorithm, the top 10 up-regulated proteins were MRTO4, BOP1, PES1, WDR12, BRIX1, NOP2, POLR1C, NOC2L, MYBBP1A and TSR1 (Figure 3B), whereas NDUFS8, NDUFS6, NDUFA8, NDUFA5, NDUFC2, NDUFB8, NDUFB5, NDUFB9, UQCRC2 and UQCRC1 were the key down-regulated proteins (Figure 3D). The expression levels of MRTO4, BOP1, PES1 (Figure 3E), NDUFS8, NDUFS6 and NDUFA8 (Figure 3F) were verified in IGC tissues by western blotting.
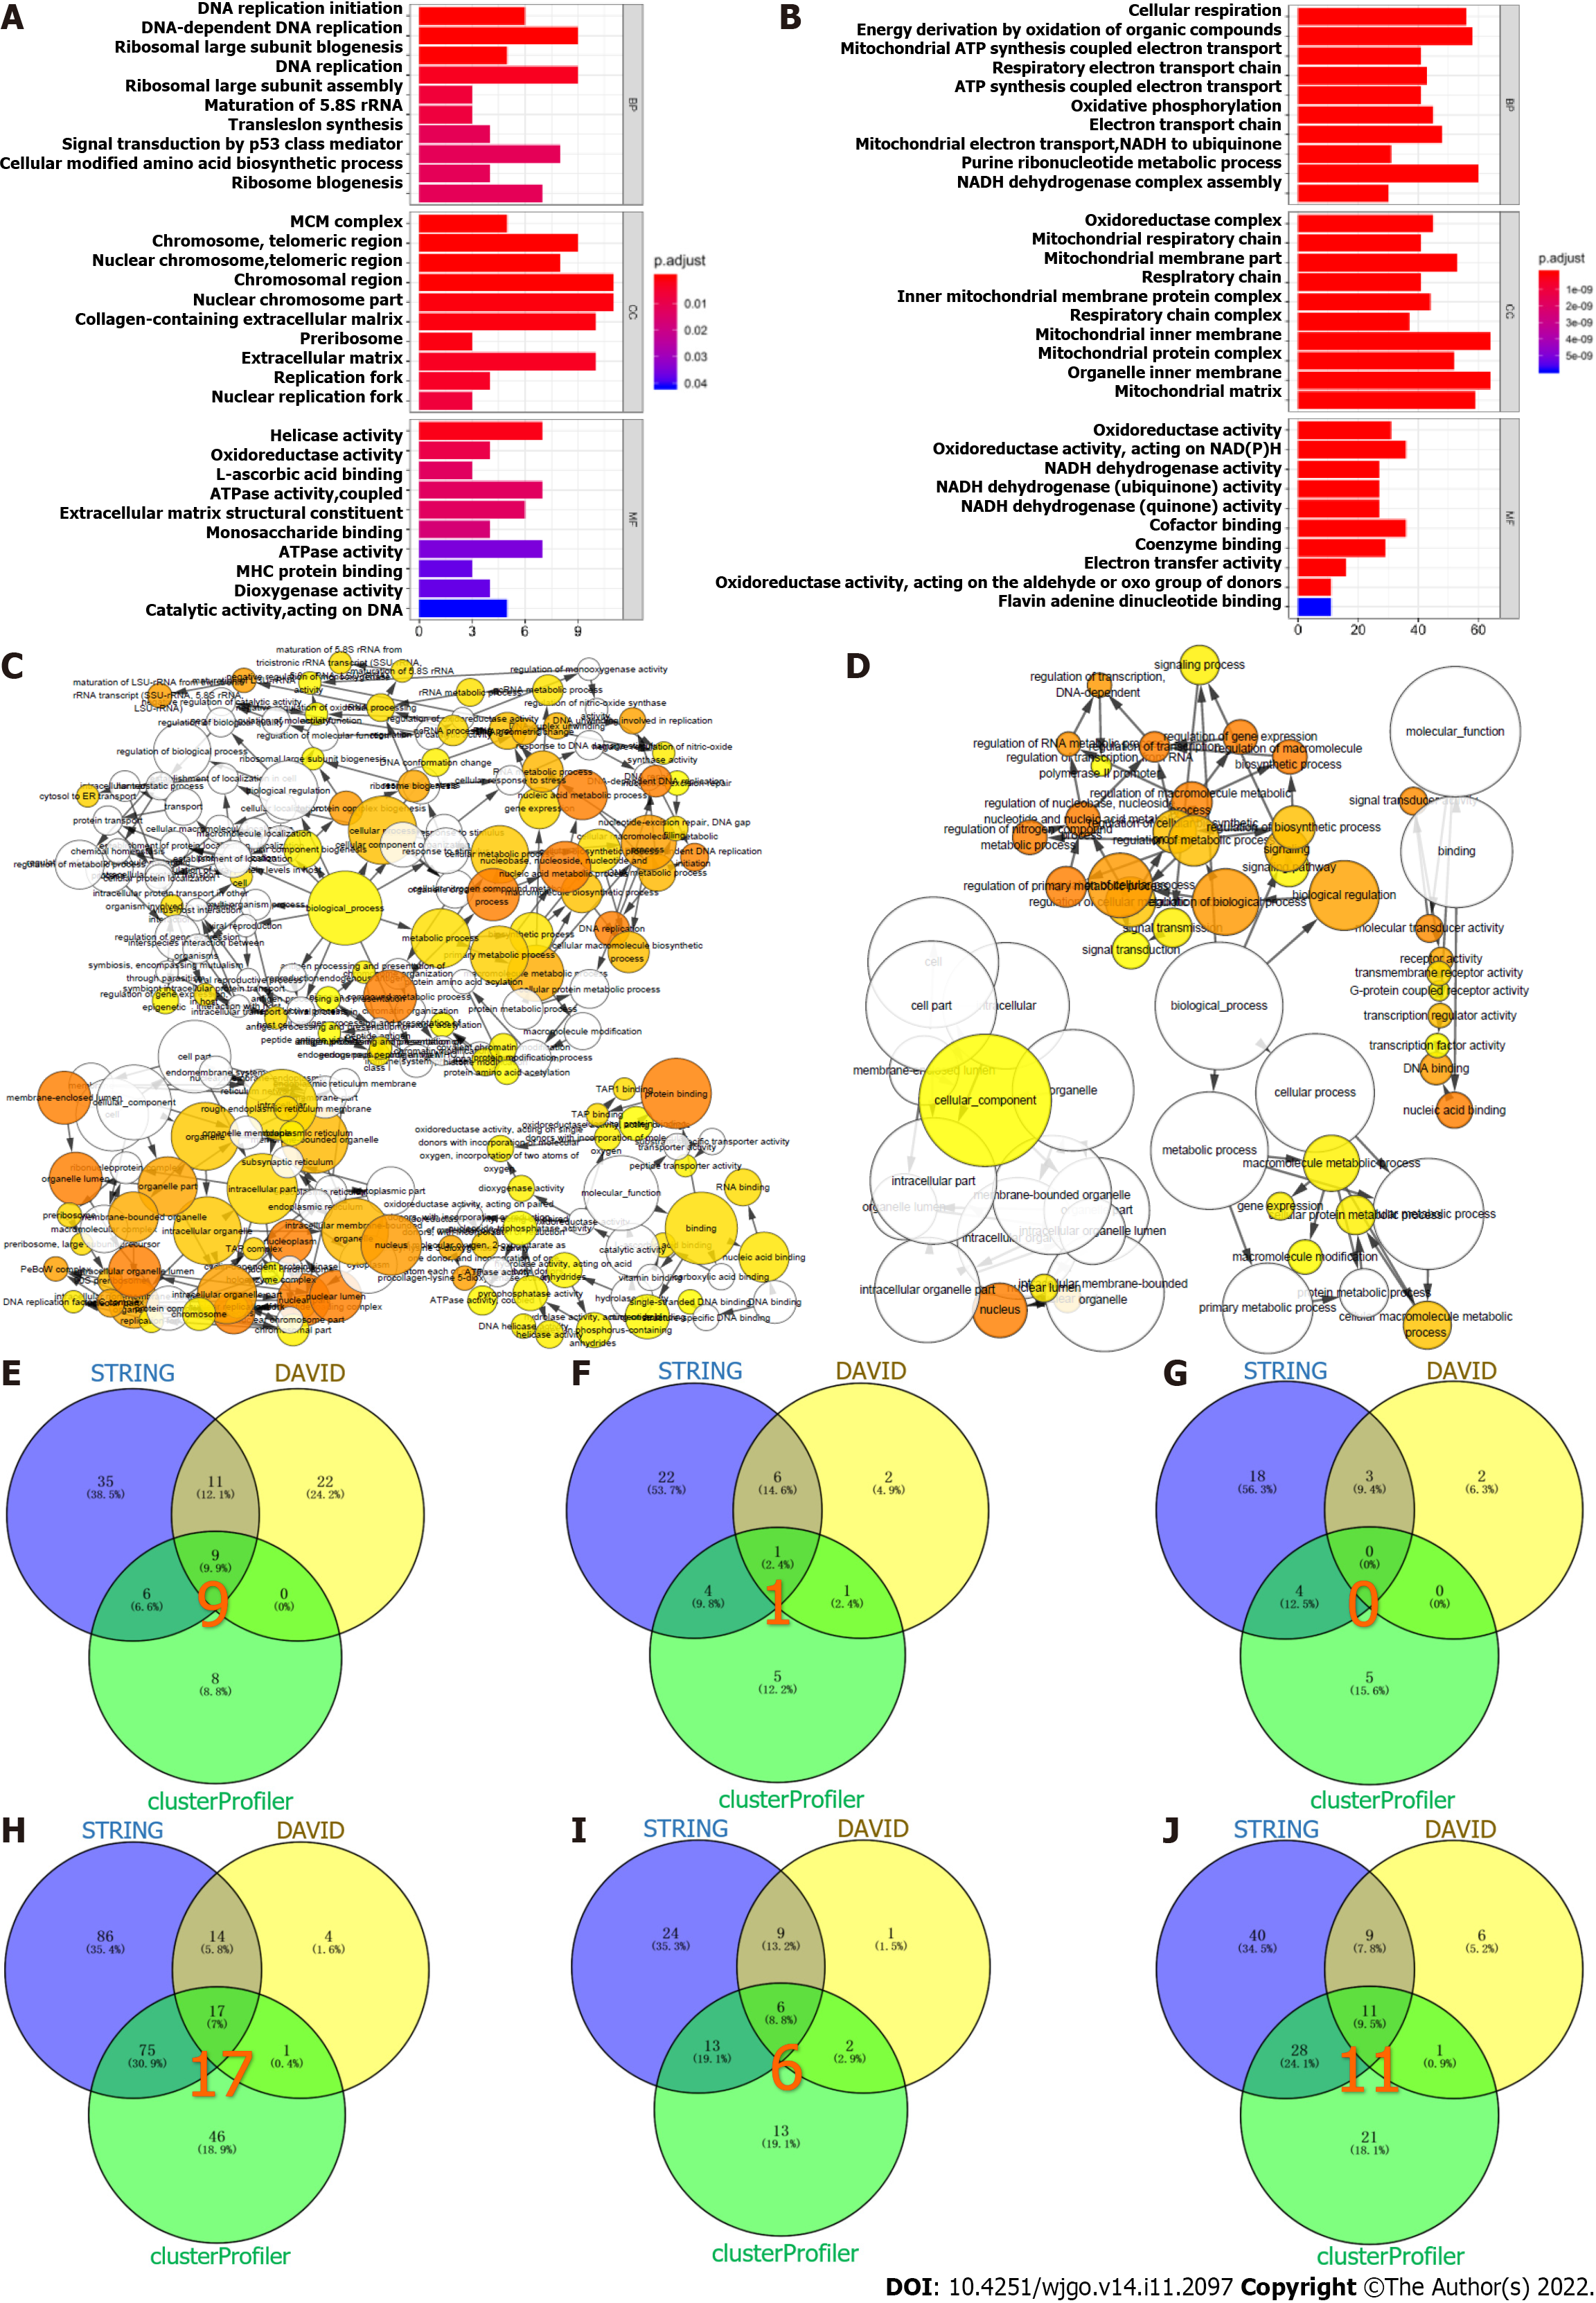
The significantly enriched GO terms for the up-regulated and down-regulated proteins and their interactive networks are shown in Figure 4A-D. The biological processes enriched in the upregulated proteins included DNA replication, ribosome biogenesis, and DNA replication initiation (Figure 4E), and MCM complex was the key cellular component (Figure 4F). The molecular functions did not show co-enrichment (Figure 4G). Among the significantly down-regulated proteins, 17 biological processes including glucose metabolism, pyruvate metabolism and fatty acid β-oxidation were significantly enriched (Figure 4H). In addition, 6 cell components including the mitochondrial inner membrane, mitochondrial matrix and mitochondrial proton-transporting ATP synthase complex (Figure 4I), and 11 molecular functions including reduced nicotinamide adenine dinucleotide (NADH) dehydrogenase activity, acyl-CoA dehydrogenase activity and nicotinamide adenine dinucleotide (NAD) binding (Figure 4J) were enriched.
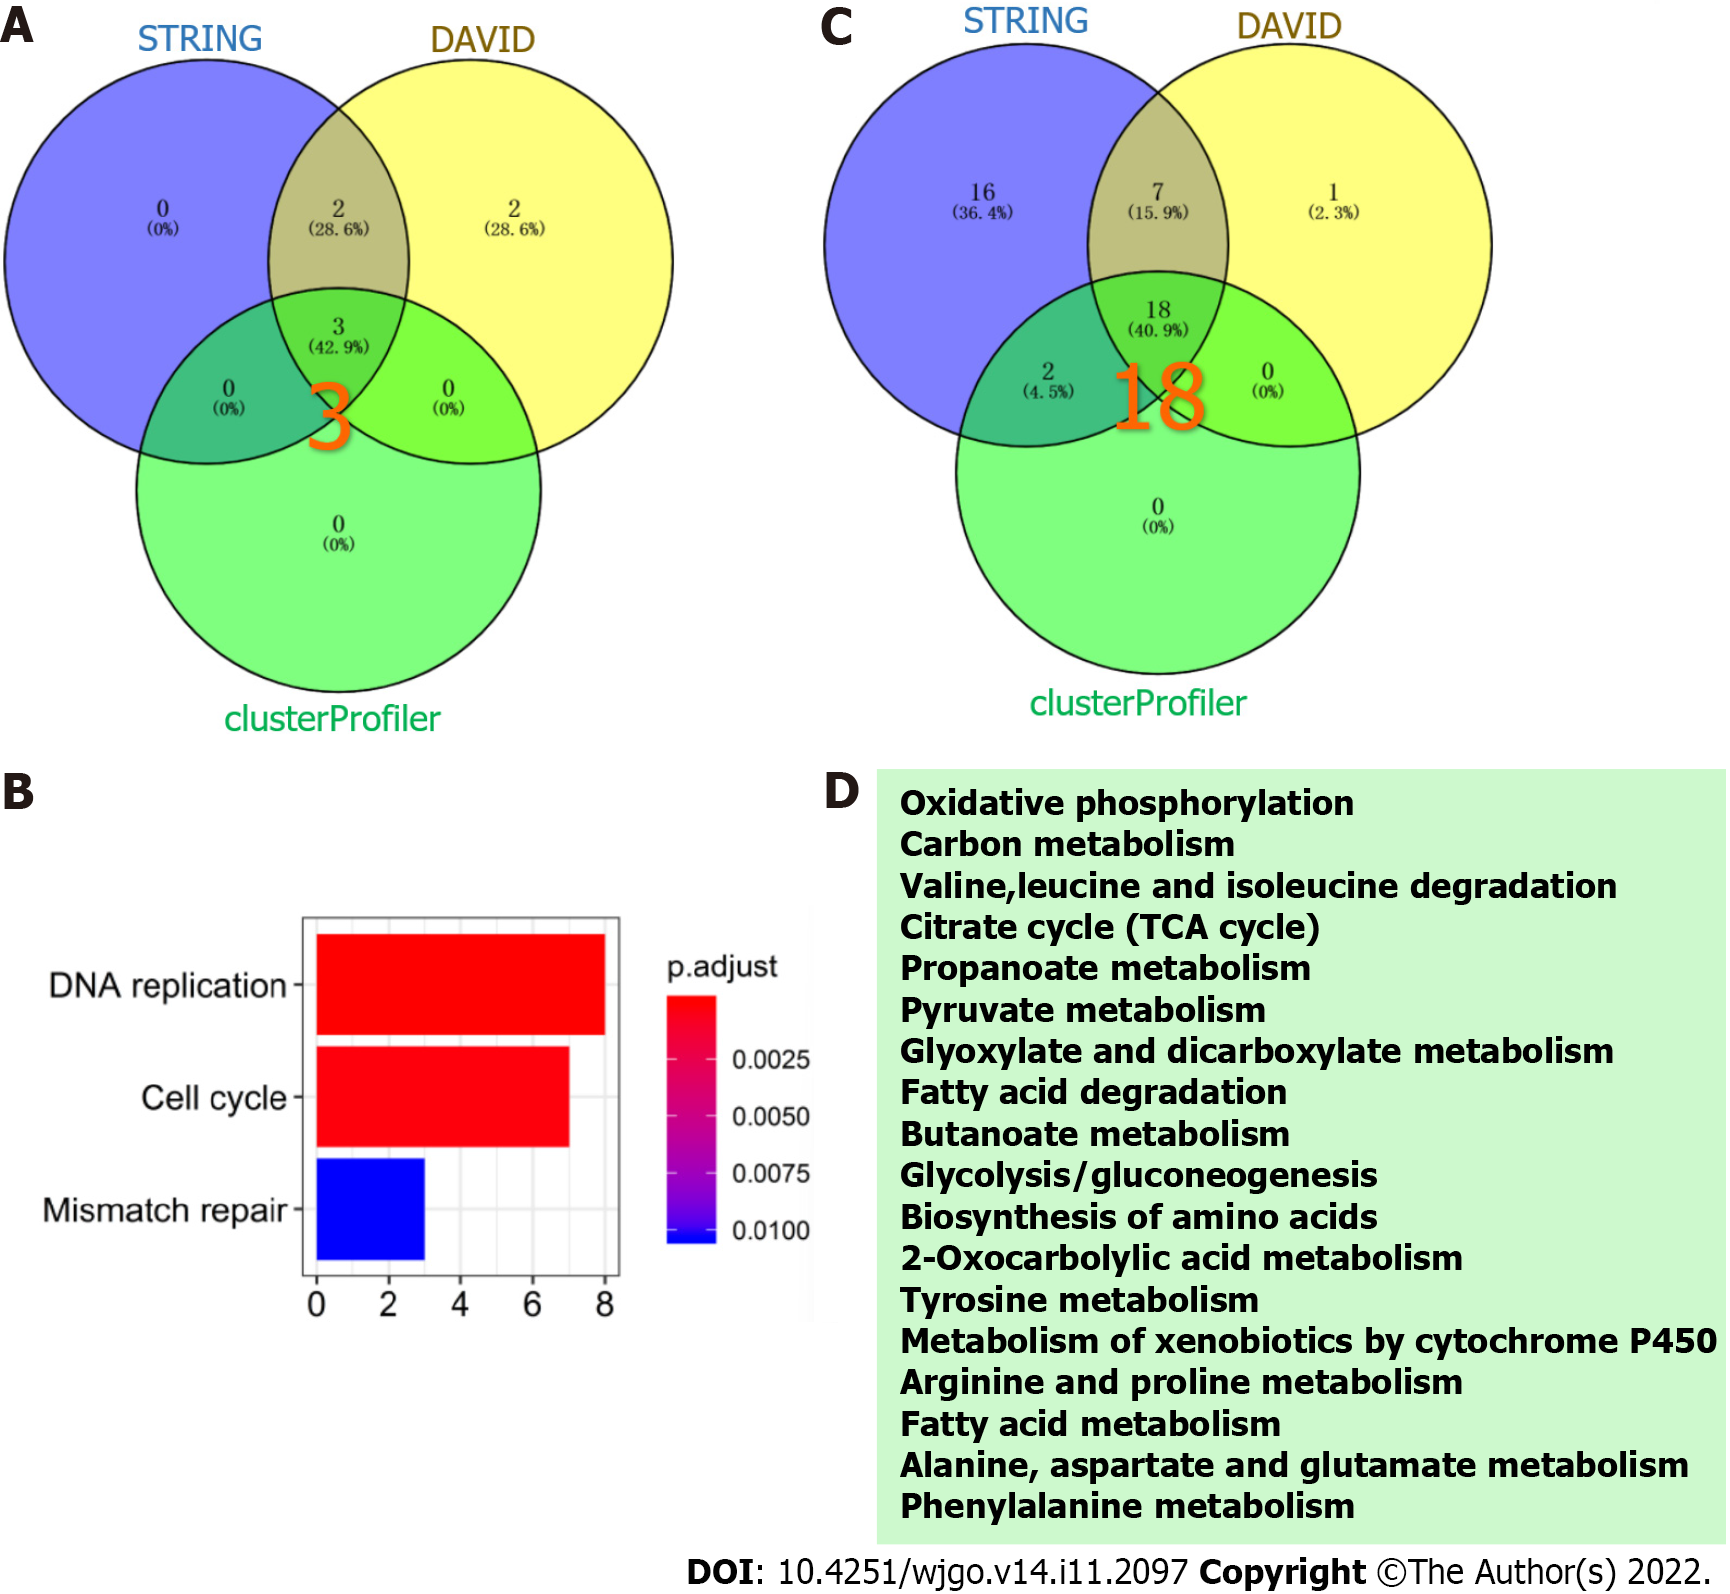
Three KEGG pathways were significantly enriched in the up-regulated proteins (Figure 5A), including DNA replication, cell cycle and mismatch repair (Figure 5B). Among the down-regulated proteins, 18 KEGG pathways were enriched (Figure 5C), such as oxidative phosphorylation, fatty acid degradation, and phenylalanine metabolism (Figure 5D).
The top 20 hub proteins identified in the IGC tissues were MRTO4, BOP1, PES1, WDR12, BRIX1, NOP2, POLR1C, NOC2L, MYBBP1A, TSR1, NDUFS8, NDUFS6, NDUFA8, NDUFA5, NDUFC2, NDUFB8, NDUFB5, NDUFB9, UQCRC2 and UQCRC1. PES1 is highly expressed in GC tissues, and knocking down PES1 in GC cells inhibited their proliferation[12]. On the other hand, UQCRC2 is downregulated in GC and its overexpression inhibited the migration and invasion of the tumor cells[13]. Therefore, these proteins are promising prognostic biomarkers of IGC.
The proteins that were upregulated in IGC tissues showed significant enrichment of DNA replication, ribosome biogenesis and DNA replication initiation, MCM complex, and the cell cycle and mismatch repair signal pathways. This strongly suggests that these proteins exert a pro-proliferative and oncogenic function in IGC, most likely by promoting DNA replication, cell cycle progression and mismatch repair. Changes in the MCM complex have been previously reported in IGC cells, and are regulated by miRNAs[14]. In addition, DNA replication and cell cycle signaling pathways are key factors involved in the proliferation of GC cells[15,16], whereas the mismatch repair pathway affects drug resistance and metastasis[17-21].
The down-regulated proteins were enriched in glucose metabolism, pyruvate metabolism, phenylalanine metabolism, fatty acid β-oxidation, oxidative phosphorylation, mitochondrial inner membrane, mitochondrial matrix, mitochondrial proton transport ATP synthase complex, NADH dehydrogenase activity, acyl-CoA dehydrogenase activity and NAD binding. This is indicative of aberrant mitochondrial metabolism in the IGC cells. Consistent with our findings, a previous study reported dysregulated oxidative phosphorylation in GC[22].
The significant DEPs identified in our study are potential diagnostic and prognostic markers, as well as therapeutic targets in IGC, and will have to be validated in a large cohort from multiple centers. Furthermore, the proteomic signatures of IGC provide insights into the possible mechanisms underlying IGC progression, which likely involve DNA replication, cell cycle, mismatch repair, and energy metabolism pathways, and will also contribute to precision medicine for more accurate diagnosis and better treatment effect.
This study has several limitations that ought to be considered. First, only 12 paired IGC and adjacent normal tissues were analyzed, and the sample size will have to be increased by involving multiple centers in the follow-up study. Second, few proteins could be verified, and the number will have to be increased in future studies by mass spectrometry.
The prognosis of infiltrative gastric cancer (IGC) patients remains relatively poor. Therefore, it is necessary to explore the molecular mechanisms underlying the occurrence and development of IGC.
The proteomic signatures of IGC remain unknown.
To profile the proteome of IGC.
The proteins from IGC and normal tissue samples were analyzed by high performance liquid chromatography tandem mass spectrometry and searched against the database via Maxquant software. The differentially expressed proteins (DEPs) were screened using |log2(Fold Change)| > 1 and P-adj < 0.01 as the thresholds. The expression levels of some proteins were verified by Western blotting. The interaction network of DEPs was constructed using the STRING database, and the key proteins were visualized using Cytoscape cytoHubba software. Finally, clusterProfiler, STRING and DAVID were used for Gene Ontology (GO) and Kyoto Encyclopedia of Genes and Genomes (KEGG) pathway enrichment analysis of DEPs, with P < 0.05 as the threshold.
A total of 7361 DEPs were identified, of which 94 were significantly up-regulated and 223 were significantly down-regulated in IGC relative to normal gastric tissues. The top 10 up-regulated proteins were MRTO4, BOP1, PES1, WDR12, BRIX1, NOP2, POLR1C, NOC2L, MYBBP1A and TSR1, and the top 10 down-regulated proteins were NDUFS8, NDUFS6, NDUFA8, NDUFA5, NDUFC2, NDUFB8, NDUFB5, NDUFB9, UQCRC2 and UQCRC1. The up-regulated proteins were enriched for 9 biological processes including DNA replication, ribosome biogenesis and initiation of DNA replication, and the cellular component MCM complex. Among the down-regulated proteins, 17 biological processes were enriched, including glucose metabolism, pyruvic acid metabolism and fatty acid β-oxidation. In addition, the mitochondrial inner membrane, mitochondrial matrix and mitochondrial proton transport ATP synthase complex were among the 6 enriched cellular components among the down-regulated proteins, and 11 molecular functions including reduced nicotinamide adenine dinucleotide dehydrogenase activity, acyl-CoA dehydrogenase activity and nicotinamide adenine dinucleotide binding were also enriched. The significant KEGG pathways for the up-regulated proteins were DNA replication, cell cycle and mismatch repair, whereas 18 pathways including oxidative phosphorylation, fatty acid degradation and phenylalanine metabolism were significantly enriched among the down-regulated proteins.
The proteins involved in cell cycle regulation, DNA replication and mismatch repair, and metabolism were significantly altered in IGC, which provides a basis for the future identification of novel biomarkers.
This study reveals the proteomic signature of IGC.
Provenance and peer review: Unsolicited article; Externally peer reviewed.
Peer-review model: Single blind
Specialty type: Oncology
Country/Territory of origin: China
Peer-review report’s scientific quality classification
Grade A (Excellent): 0
Grade B (Very good): B, B
Grade C (Good): C
Grade D (Fair): 0
Grade E (Poor): 0
P-Reviewer: Menendez-Menendez J, Spain; M'Koma AE, United States; Nakaji K, Japan S-Editor: Gao CC L-Editor: Webster J P-Editor: Zhao S
| 1. | Bray F, Ferlay J, Soerjomataram I, Siegel RL, Torre LA, Jemal A. Global cancer statistics 2018: GLOBOCAN estimates of incidence and mortality worldwide for 36 cancers in 185 countries. CA Cancer J Clin. 2018;68:394-424. [RCA] [PubMed] [DOI] [Full Text] [Cited by in Crossref: 53206] [Cited by in RCA: 55853] [Article Influence: 7979.0] [Reference Citation Analysis (132)] |
| 2. | Chen W, Zheng R, Baade PD, Zhang S, Zeng H, Bray F, Jemal A, Yu XQ, He J. Cancer statistics in China, 2015. CA Cancer J Clin. 2016;66:115-132. [RCA] [PubMed] [DOI] [Full Text] [Cited by in Crossref: 11444] [Cited by in RCA: 13215] [Article Influence: 1468.3] [Reference Citation Analysis (3)] |
| 3. | Cimerman M, Repse S, Jelenc F, Omejc M, Bitenc M, Lamovec J. Comparison of Lauren's, Ming's and WHO histological classifications of gastric cancer as a prognostic factor for operated patients. Int Surg. 1994;79:27-32. [PubMed] |
| 4. | Garnier P, Vielh P, Asselain B, Durand JC, Girodet J, Pilleron JP, Salmon RJ. [Prognostic value of the Lauren and Ming classifications in gastric adenocarcinoma. Multidimensional analysis]. Gastroenterol Clin Biol. 1988;12:553-558. [PubMed] |
| 5. | Ribeiro MM, Sarmento JA, Sobrinho Simões MA, Bastos J. Prognostic significance of Lauren and Ming classifications and other pathologic parameters in gastric carcinoma. Cancer. 1981;47:780-784. [RCA] [PubMed] [DOI] [Full Text] [Cited by in RCA: 2] [Reference Citation Analysis (0)] |
| 6. | Luebke T, Baldus SE, Grass G, Bollschweiler E, Thiele J, Dienes HP, Hoelscher AH, Moenig SP. Histological grading in gastric cancer by Ming classification: correlation with histopathological subtypes, metastasis, and prognosis. World J Surg. 2005;29:1422-7; discussion 1428. [RCA] [PubMed] [DOI] [Full Text] [Cited by in Crossref: 23] [Cited by in RCA: 27] [Article Influence: 1.4] [Reference Citation Analysis (0)] |
| 7. | Szklarczyk D, Gable AL, Lyon D, Junge A, Wyder S, Huerta-Cepas J, Simonovic M, Doncheva NT, Morris JH, Bork P, Jensen LJ, Mering CV. STRING v11: protein-protein association networks with increased coverage, supporting functional discovery in genome-wide experimental datasets. Nucleic Acids Res. 2019;47:D607-D613. [RCA] [PubMed] [DOI] [Full Text] [Full Text (PDF)] [Cited by in Crossref: 10161] [Cited by in RCA: 11752] [Article Influence: 1958.7] [Reference Citation Analysis (1)] |
| 8. | Yu G, Wang LG, Han Y, He QY. clusterProfiler: an R package for comparing biological themes among gene clusters. OMICS. 2012;16:284-287. [RCA] [PubMed] [DOI] [Full Text] [Cited by in Crossref: 11591] [Cited by in RCA: 22263] [Article Influence: 1712.5] [Reference Citation Analysis (0)] |
| 9. | Huang da W, Sherman BT, Lempicki RA. Systematic and integrative analysis of large gene lists using DAVID bioinformatics resources. Nat Protoc. 2009;4:44-57. [RCA] [PubMed] [DOI] [Full Text] [Cited by in Crossref: 24735] [Cited by in RCA: 27986] [Article Influence: 1749.1] [Reference Citation Analysis (0)] |
| 10. | Huang da W, Sherman BT, Lempicki RA. Bioinformatics enrichment tools: paths toward the comprehensive functional analysis of large gene lists. Nucleic Acids Res. 2009;37:1-13. [RCA] [PubMed] [DOI] [Full Text] [Full Text (PDF)] [Cited by in Crossref: 10350] [Cited by in RCA: 11172] [Article Influence: 657.2] [Reference Citation Analysis (0)] |
| 11. | Otasek D, Morris JH, Bouças J, Pico AR, Demchak B. Cytoscape Automation: empowering workflow-based network analysis. Genome Biol. 2019;20:185. [RCA] [PubMed] [DOI] [Full Text] [Full Text (PDF)] [Cited by in Crossref: 938] [Cited by in RCA: 1032] [Article Influence: 172.0] [Reference Citation Analysis (0)] |
| 12. | Li J, Zhou X, Lan X, Zeng G, Jiang X, Huang Z. Repression of PES1 expression inhibits growth of gastric cancer. Tumour Biol. 2016;37:3043-3049. [RCA] [PubMed] [DOI] [Full Text] [Cited by in Crossref: 6] [Cited by in RCA: 7] [Article Influence: 0.7] [Reference Citation Analysis (0)] |
| 13. | Wang DW, Su F, Zhang T, Yang TC, Wang HQ, Yang LJ, Zhou FF, Feng MH. The miR-370/UQCRC2 axis facilitates tumorigenesis by regulating epithelial-mesenchymal transition in Gastric Cancer. J Cancer. 2020;11:5042-5055. [RCA] [PubMed] [DOI] [Full Text] [Full Text (PDF)] [Cited by in Crossref: 4] [Cited by in RCA: 13] [Article Influence: 2.6] [Reference Citation Analysis (0)] |
| 14. | Cheng J, Zhuo H, Wang L, Zheng W, Chen X, Hou J, Zhao J, Cai J. Identification of the Combinatorial Effect of miRNA Family Regulatory Network in Different Growth Patterns of GC. Mol Ther Oncolytics. 2020;17:531-546. [RCA] [PubMed] [DOI] [Full Text] [Full Text (PDF)] [Cited by in Crossref: 21] [Cited by in RCA: 16] [Article Influence: 3.2] [Reference Citation Analysis (0)] |
| 15. | Rozacky J, Nemec AA, Sweasy JB, Kidane D. Gastric cancer associated variant of DNA polymerase beta (Leu22Pro) promotes DNA replication associated double strand breaks. Oncotarget. 2015;6:24474-24487. [RCA] [PubMed] [DOI] [Full Text] [Full Text (PDF)] [Cited by in Crossref: 6] [Cited by in RCA: 12] [Article Influence: 1.3] [Reference Citation Analysis (0)] |
| 16. | Zhu L, Wang C, Lin S, Zong L. CircKIAA0907 Retards Cell Growth, Cell Cycle, and Autophagy of Gastric Cancer In Vitro and Inhibits Tumorigenesis In Vivo via the miR-452-5p/KAT6B Axis. Med Sci Monit. 2020;26:e924160. [RCA] [PubMed] [DOI] [Full Text] [Full Text (PDF)] [Cited by in Crossref: 6] [Cited by in RCA: 14] [Article Influence: 2.8] [Reference Citation Analysis (0)] |
| 17. | An JY, Choi YY, Lee J, Hyung WJ, Kim KM, Noh SH, Choi MG, Cheong JH. A Multi-cohort Study of the Prognostic Significance of Microsatellite Instability or Mismatch Repair Status after Recurrence of Resectable Gastric Cancer. Cancer Res Treat. 2020;52:1153-1161. [RCA] [PubMed] [DOI] [Full Text] [Full Text (PDF)] [Cited by in Crossref: 4] [Cited by in RCA: 13] [Article Influence: 2.6] [Reference Citation Analysis (0)] |
| 18. | Dislich B, Blaser N, Berger MD, Gloor B, Langer R. Preservation of Epstein-Barr virus status and mismatch repair protein status along the metastatic course of gastric cancer. Histopathology. 2020;76:740-747. [RCA] [PubMed] [DOI] [Full Text] [Cited by in Crossref: 8] [Cited by in RCA: 12] [Article Influence: 3.0] [Reference Citation Analysis (0)] |
| 19. | Kim SM, An JY, Byeon SJ, Lee J, Kim KM, Choi MG, Lee JH, Sohn TS, Bae JM, Kim S. Prognostic value of mismatch repair deficiency in patients with advanced gastric cancer, treated by surgery and adjuvant 5-fluorouracil and leucovorin chemoradiotherapy. Eur J Surg Oncol. 2020;46:189-194. [RCA] [PubMed] [DOI] [Full Text] [Cited by in Crossref: 6] [Cited by in RCA: 12] [Article Influence: 2.0] [Reference Citation Analysis (0)] |
| 20. | Sugimoto R, Endo M, Osakabe M, Toya Y, Yanagawa N, Matsumoto T, Sugai T. Immunohistochemical Analysis of Mismatch Repair Gene Proteins in Early Gastric Cancer Based on Microsatellite Status. Digestion. 2021;102:691-700. [RCA] [PubMed] [DOI] [Full Text] [Cited by in Crossref: 6] [Cited by in RCA: 9] [Article Influence: 2.3] [Reference Citation Analysis (0)] |
| 21. | Verma R, Agarwal AK, Sakhuja P, Sharma PC. Microsatellite instability in mismatch repair and tumor suppressor genes and their expression profiling provide important targets for the development of biomarkers in gastric cancer. Gene. 2019;710:48-58. [RCA] [PubMed] [DOI] [Full Text] [Cited by in Crossref: 14] [Cited by in RCA: 13] [Article Influence: 2.2] [Reference Citation Analysis (0)] |
| 22. | Su F, Zhou FF, Zhang T, Wang DW, Zhao D, Hou XM, Feng MH. Quantitative proteomics identified 3 oxidative phosphorylation genes with clinical prognostic significance in gastric cancer. J Cell Mol Med. 2020;24:10842-10854. [RCA] [PubMed] [DOI] [Full Text] [Full Text (PDF)] [Cited by in Crossref: 7] [Cited by in RCA: 16] [Article Influence: 3.2] [Reference Citation Analysis (0)] |


