Copyright
©The Author(s) 2016.
World J Gastrointest Oncol. Jul 15, 2016; 8(7): 573-582
Published online Jul 15, 2016. doi: 10.4251/wjgo.v8.i7.573
Published online Jul 15, 2016. doi: 10.4251/wjgo.v8.i7.573
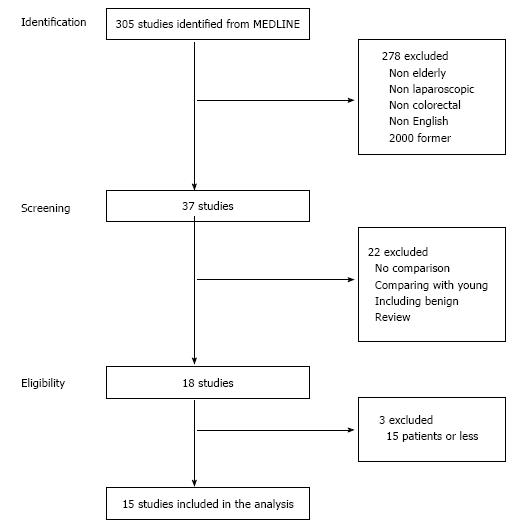
Figure 1 Study profile.
Figure 2 Forest plot of the mean difference for operative time.
LAC: Laparoscopic surgery; OC: Open surgery.
Figure 3 Forest plot of the mean difference for amount of estimated blood loss.
LAC: Laparoscopic surgery; OC: Open surgery.
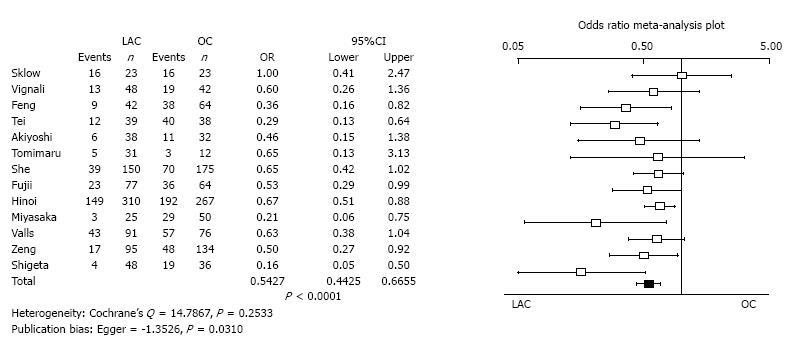
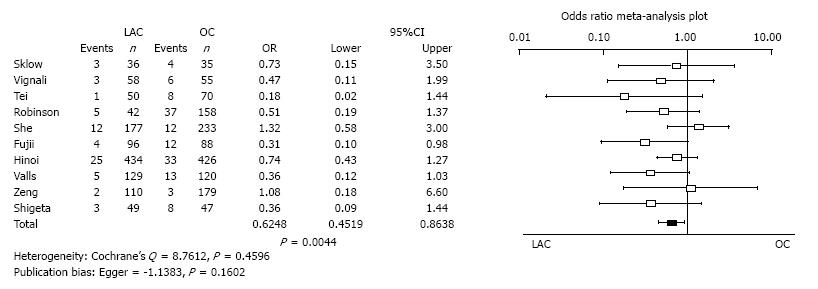
Figure 4 Forest plot of the odds ratio for overall morbidity.
LAC: Laparoscopic surgery; OC: Open surgery.
Figure 5 Forest plot of the odds ratio for incisional surgical site infection.
LAC: Laparoscopic surgery; OC: Open surgery.
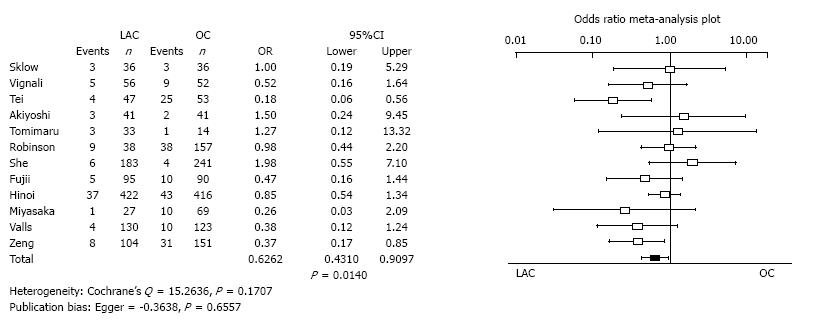
Figure 6 Forest plot of the odds ratio for anastomotic leakage.
LAC: Laparoscopic surgery; OC: Open surgery.
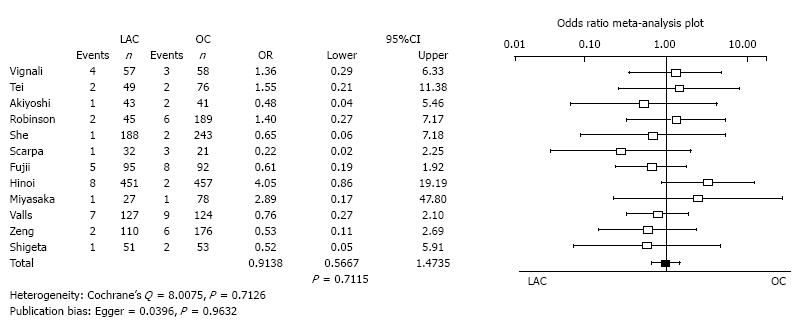
Figure 7 Forest plot of the odds ratio for bowel obstruction and ileus.
LAC: Laparoscopic surgery; OC: Open surgery.
Figure 8 Forest plot of the odds ratio for cardiovascular complication.
LAC: Laparoscopic surgery; OC: Open surgery.
Figure 9 Forest plot of the odds ratio for overall survival.
LAC: Laparoscopic surgery; OC: Open surgery.
Figure 10 Forest plot of the odds ratio for disease specific survival.
LAC: Laparoscopic surgery; OC: Open surgery.
- Citation: Fujii S, Tsukamoto M, Fukushima Y, Shimada R, Okamoto K, Tsuchiya T, Nozawa K, Matsuda K, Hashiguchi Y. Systematic review of laparoscopic vs open surgery for colorectal cancer in elderly patients. World J Gastrointest Oncol 2016; 8(7): 573-582
- URL: https://www.wjgnet.com/1948-5204/full/v8/i7/573.htm
- DOI: https://dx.doi.org/10.4251/wjgo.v8.i7.573


