Copyright
©The Author(s) 2025.
World J Gastrointest Oncol. Jun 15, 2025; 17(6): 105664
Published online Jun 15, 2025. doi: 10.4251/wjgo.v17.i6.105664
Published online Jun 15, 2025. doi: 10.4251/wjgo.v17.i6.105664
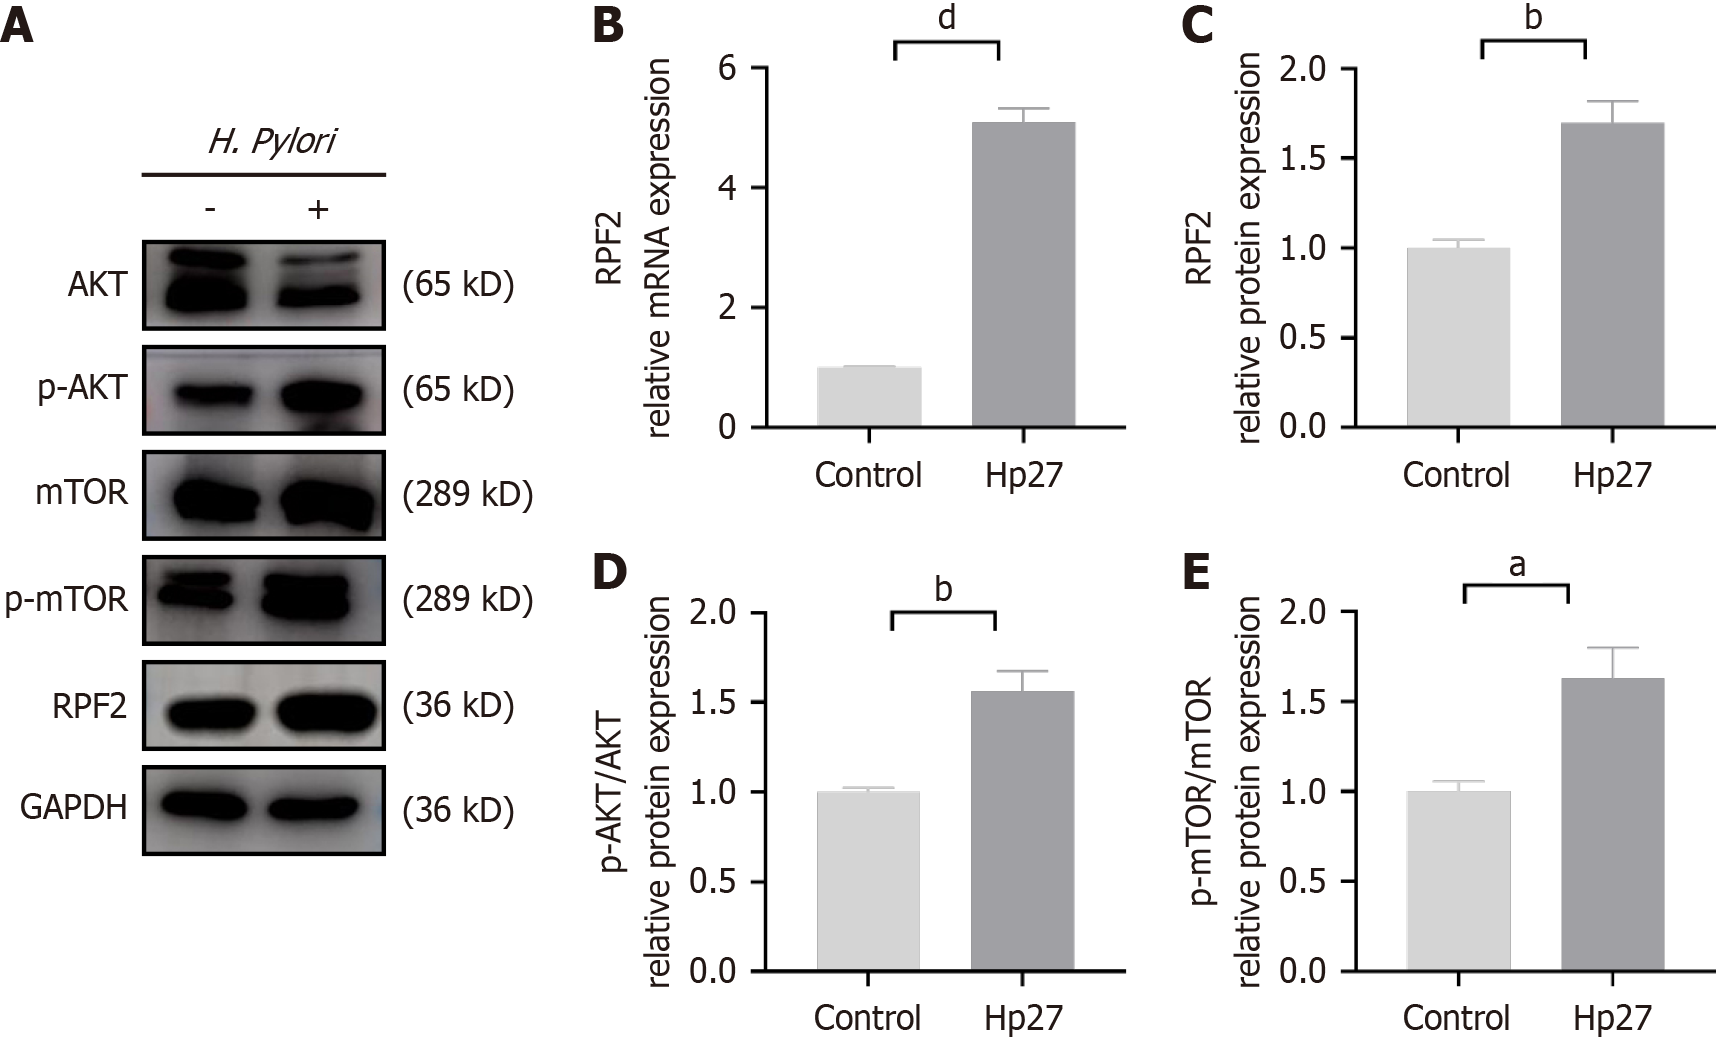
Figure 1 RPF2 and protein kinase B/mammalian target of rapamycin expression in Helicobacter pylori-infected cells.
A: Western blots of RPF2 and protein kinase B (AKT)/mammalian target of rapamycin (mTOR); B: RPF2 mRNA level (1.00 ± 0.02 vs 5.10 ± 0.23); C: RPF2 protein levels (1.00 ± 0.05 vs 1.70 ± 0.12); D: Phospho-AKT protein levels; E: Phospho-mTOR protein levels. Mean ± SE. aP < 0.05. bP < 0.01. dP < 0.0001. AKT: Protein kinase B; p-AKT: Phospho-protein kinase B; mTOR: Mammalian target of rapamycin; p-mTOR: Phospho-mammalian target of rapamycin; GAPDH: Glyceraldehyde-3-phosphate dehydrogenase; H. pylori: Helicobacter pylori.
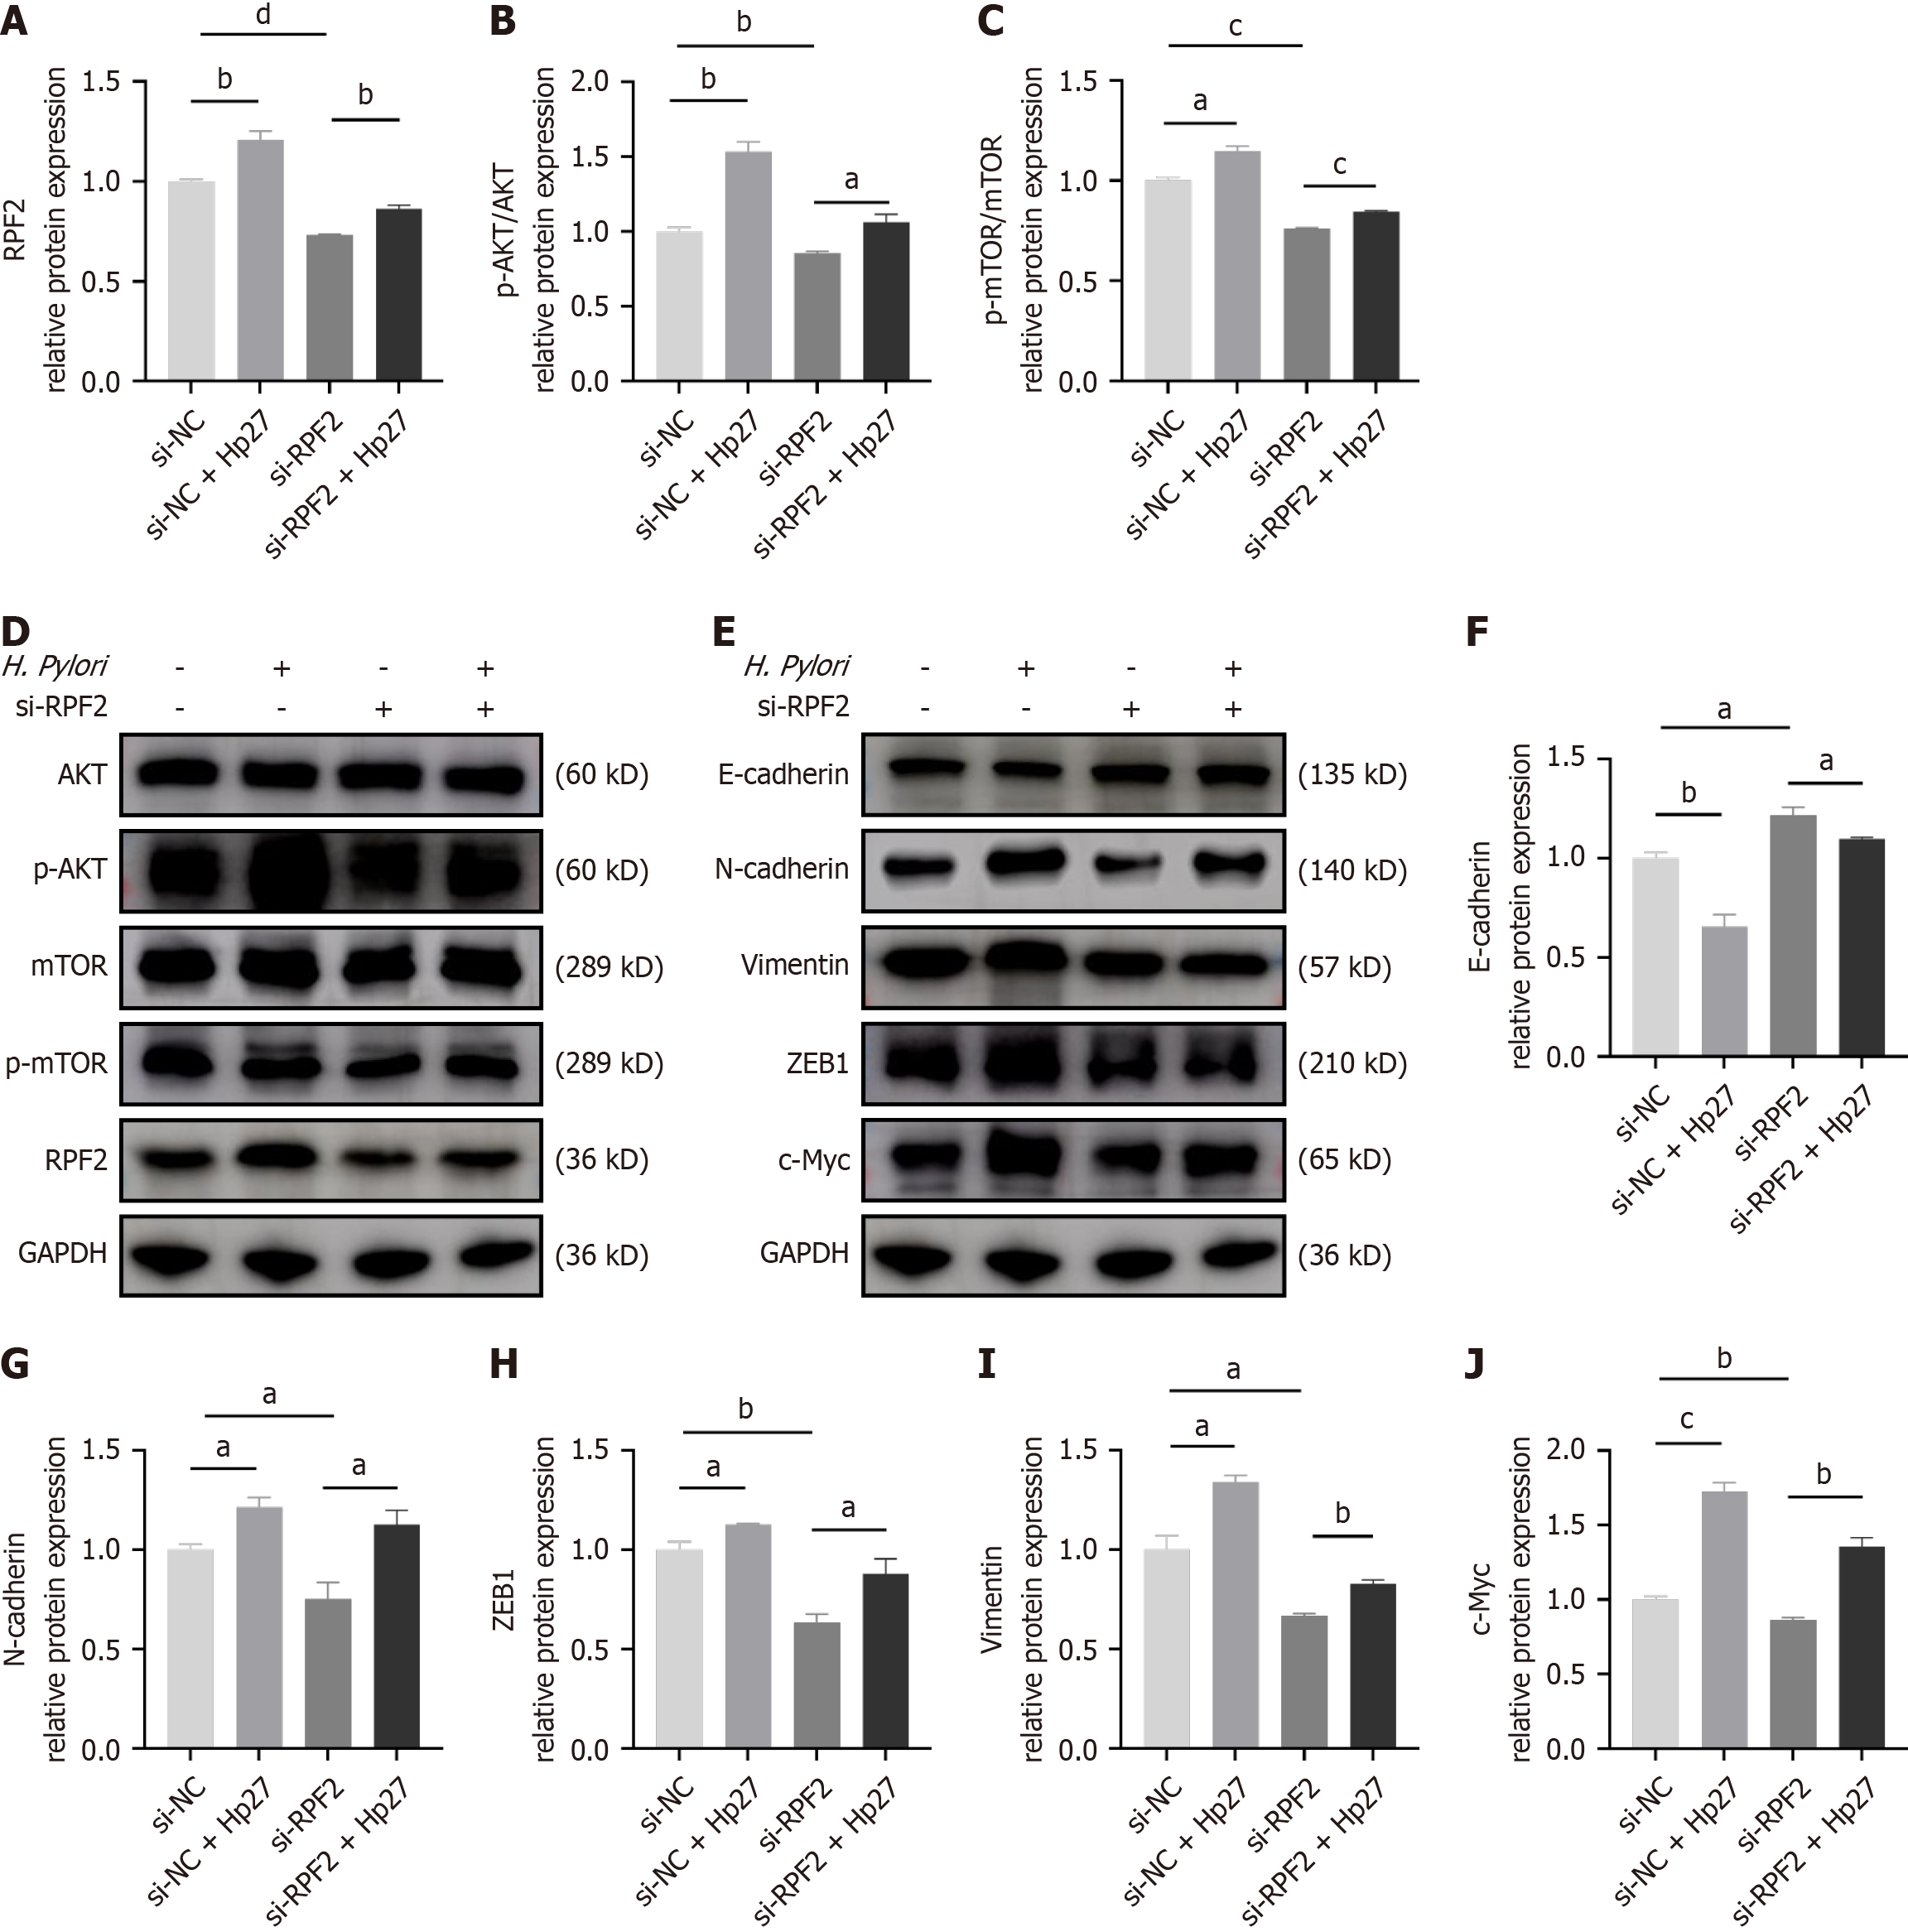
Figure 2 Protein kinase B/mammalian target of rapamycin and epithelial-mesenchymal transition protein expression in RPF2 gene silencing cells.
A-C: RPF2 and protein kinase B (AKT)/mammalian target of rapamycin (mTOR) protein levels; D: Western blots of RPF2 and AKT/mTOR; E: Western blots of epithelial-mesenchymal (EMT) transition and c-Myc; F-J: EMT and c-Myc protein levels. aP < 0.05. bP < 0.01. cP < 0.001. dP < 0.0001. AKT: Protein kinase B; p-AKT: Phospho-protein kinase B; mTOR: Mammalian target of rapamycin; p-mTOR: Phospho-mammalian target of rapamycin; GAPDH: Glyceraldehyde-3-phosphate dehydrogenase; H. pylori: Helicobacter pylori; si-NC: Small interfering-negative control; si-RPF2: Small interfering-RPF2.
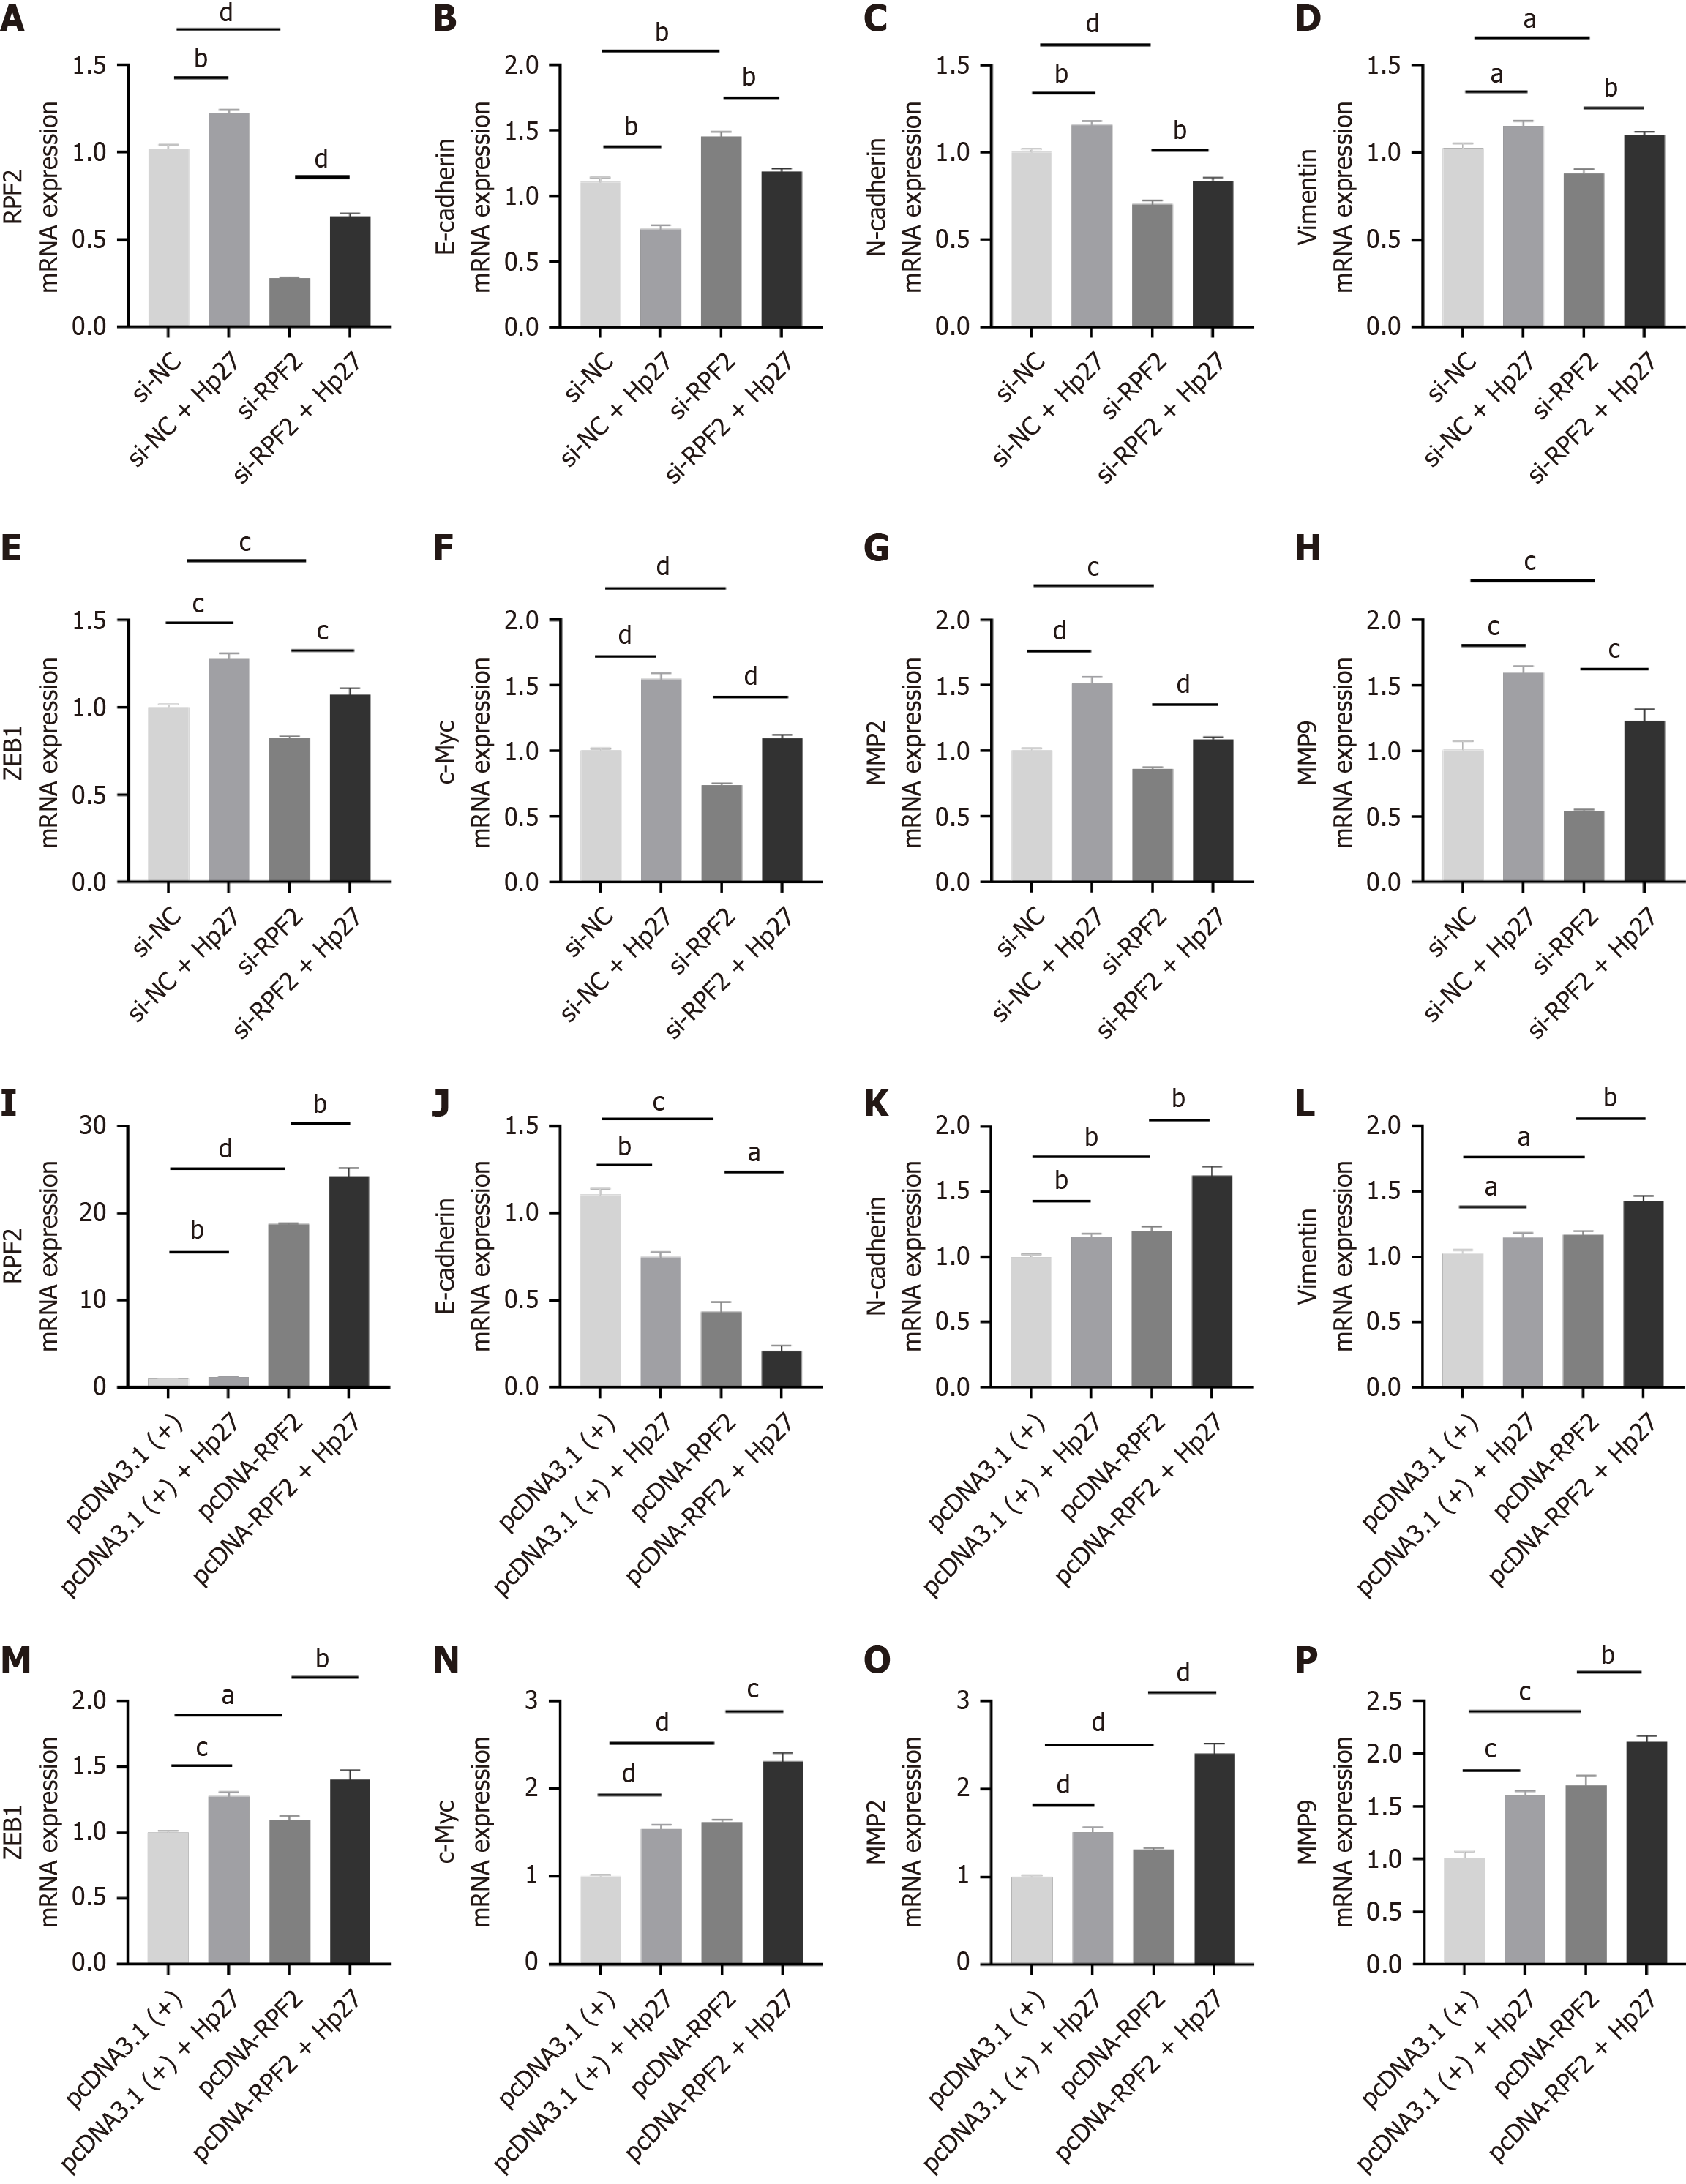
Figure 3 Changes in mRNA expression of epithelial-mesenchymal transition related factors, MMP2 and MMP9 in silencing/overex
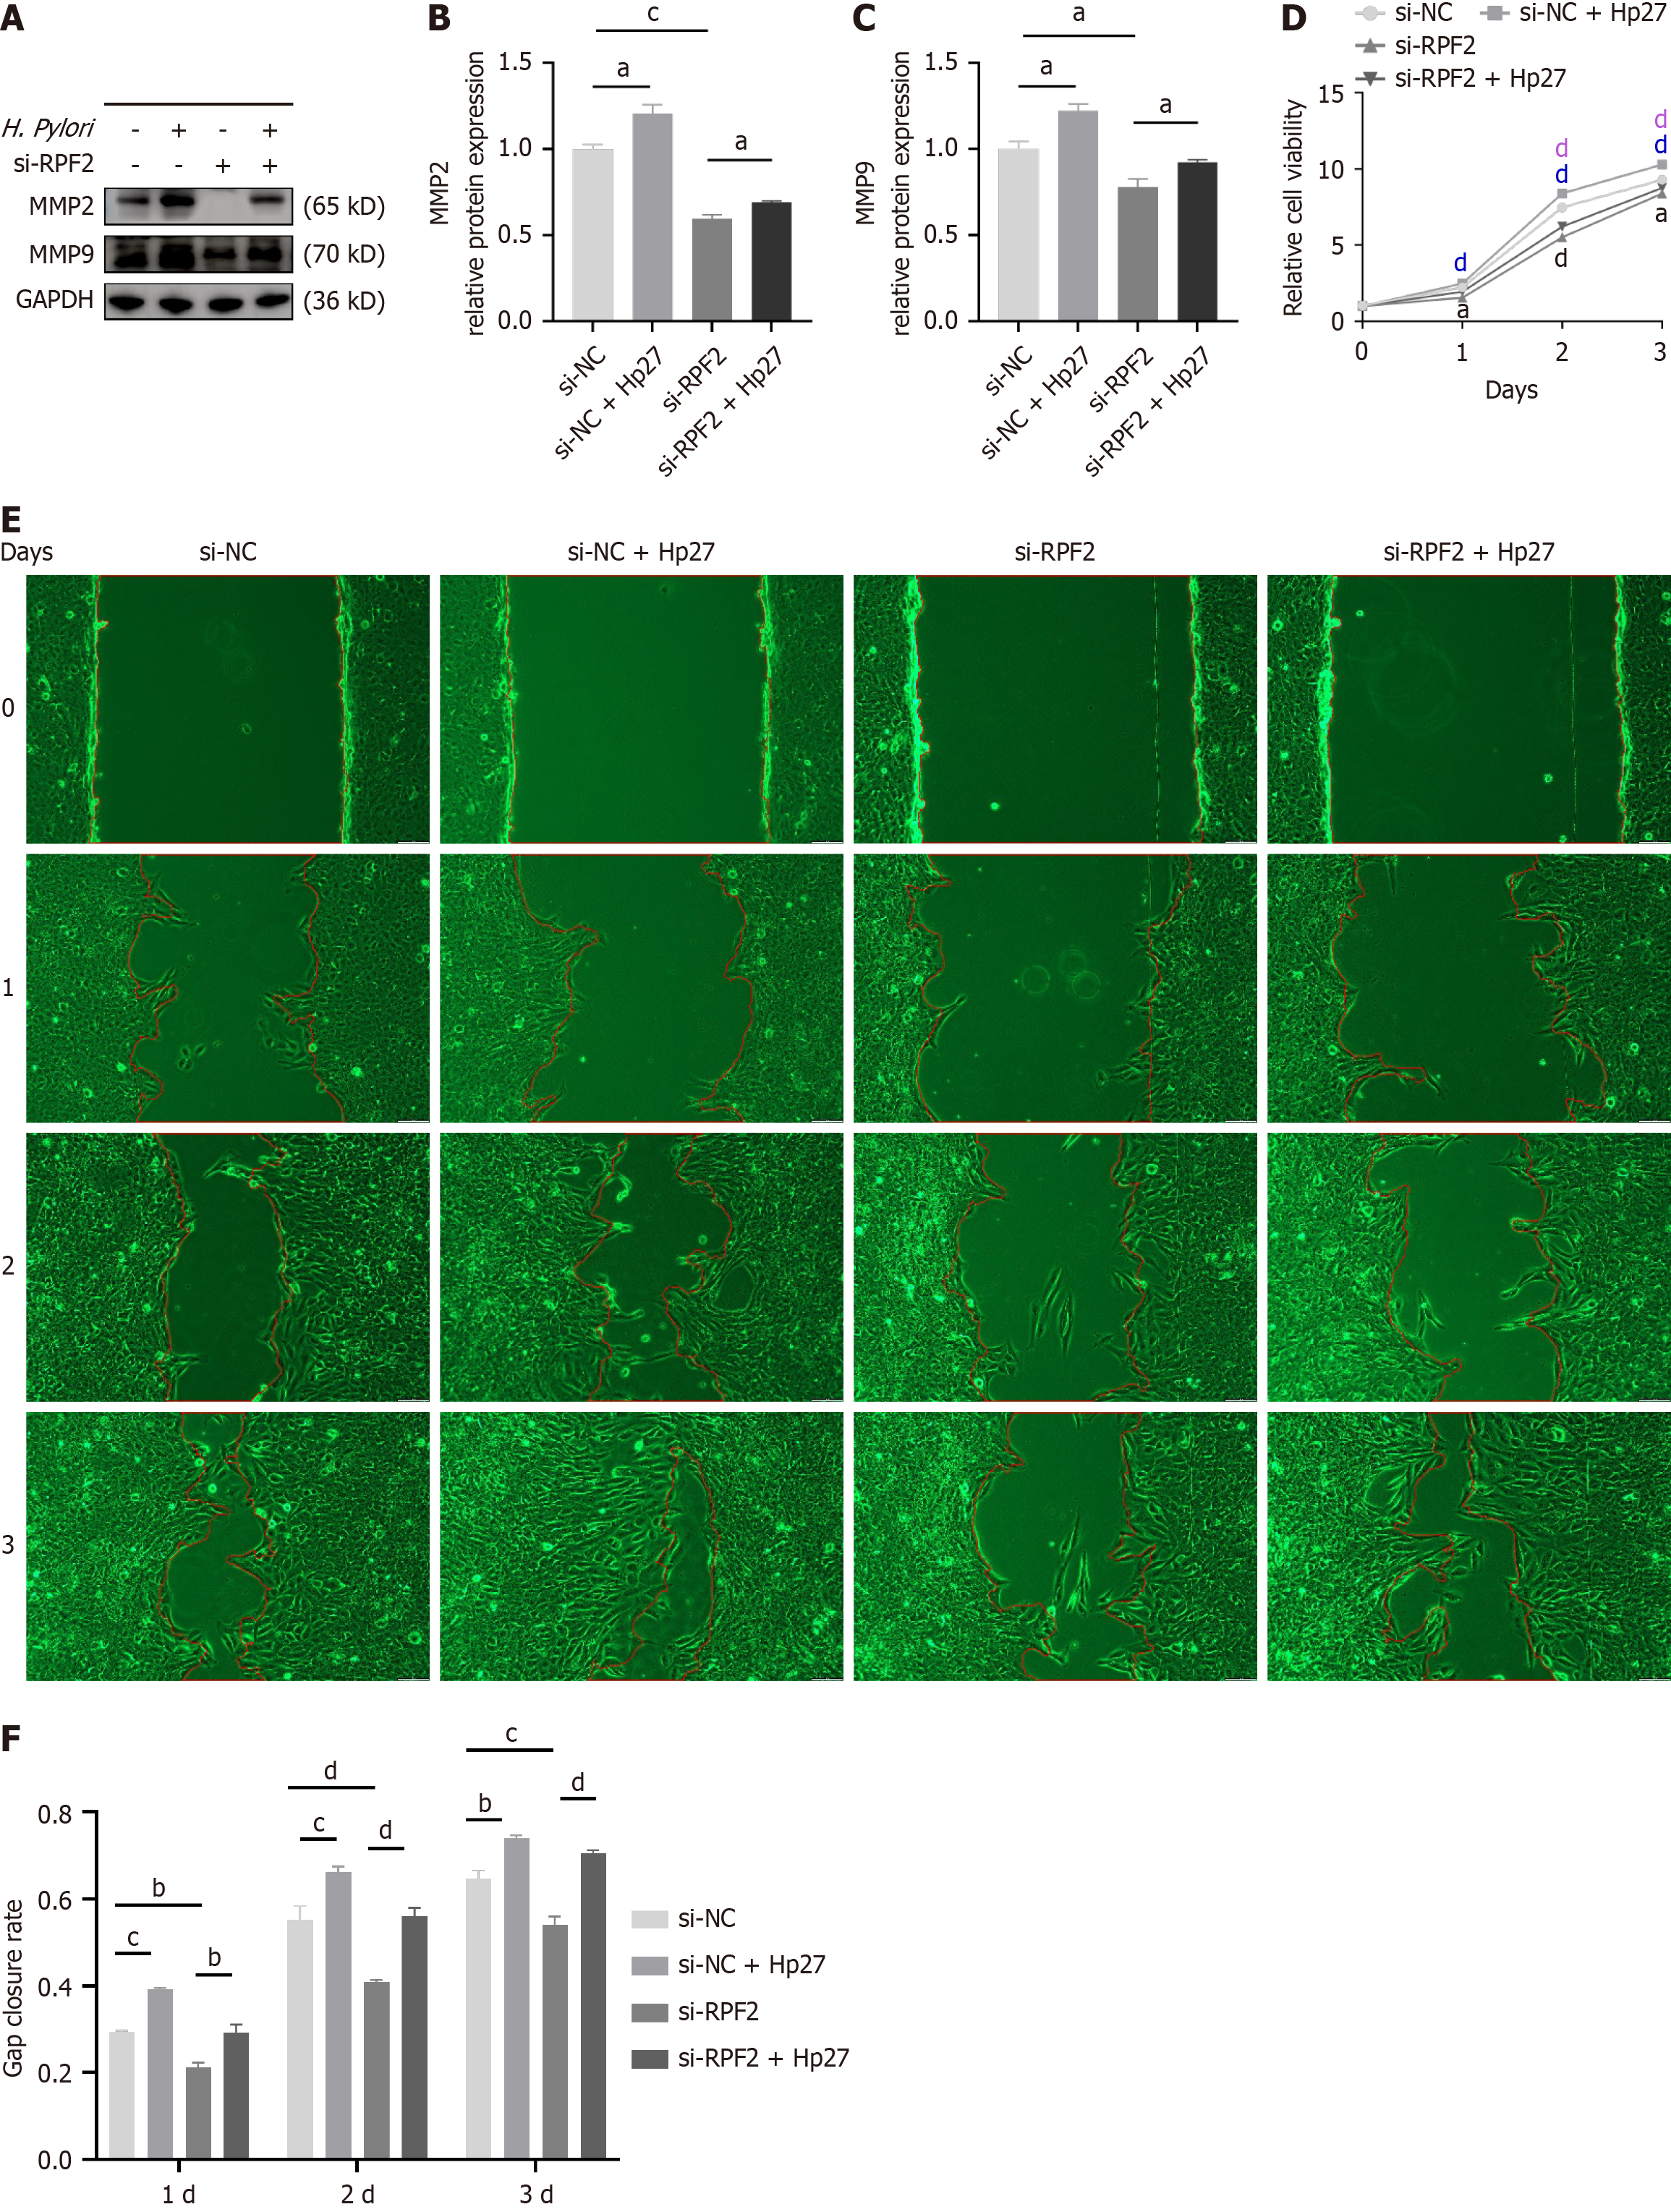
Figure 4 Effect of RPF2 knockdown on MMP2 and MMP9 expression, cell viability and migration.
A: Western blots for MMP2 and MMP9; B and C: MMP2 and MMP9 protein levels; D: Cell counting kit 8 in silencing cells; E: Pictures of wound healing assay in silencing cells; F: Gap closure rate after wound healing assay in knockdown cells. Purple represents small interfering-negative control + Hp27 vs small interfering-negative control. Blue represents small interfering-RPF2 vs small interfering-negative control. Gray represents small interfering-RPF2 + Hp27 vs small interfering-RPF2. aP < 0.05. bP < 0.01. cP < 0.001. dP < 0.0001. si-NC: Small interfering-negative control; si-RPF2: Small interfering-RPF2; GAPDH: Glyceraldehyde-3-phosphate dehydrogenase; H. pylori: Helicobacter pylori.
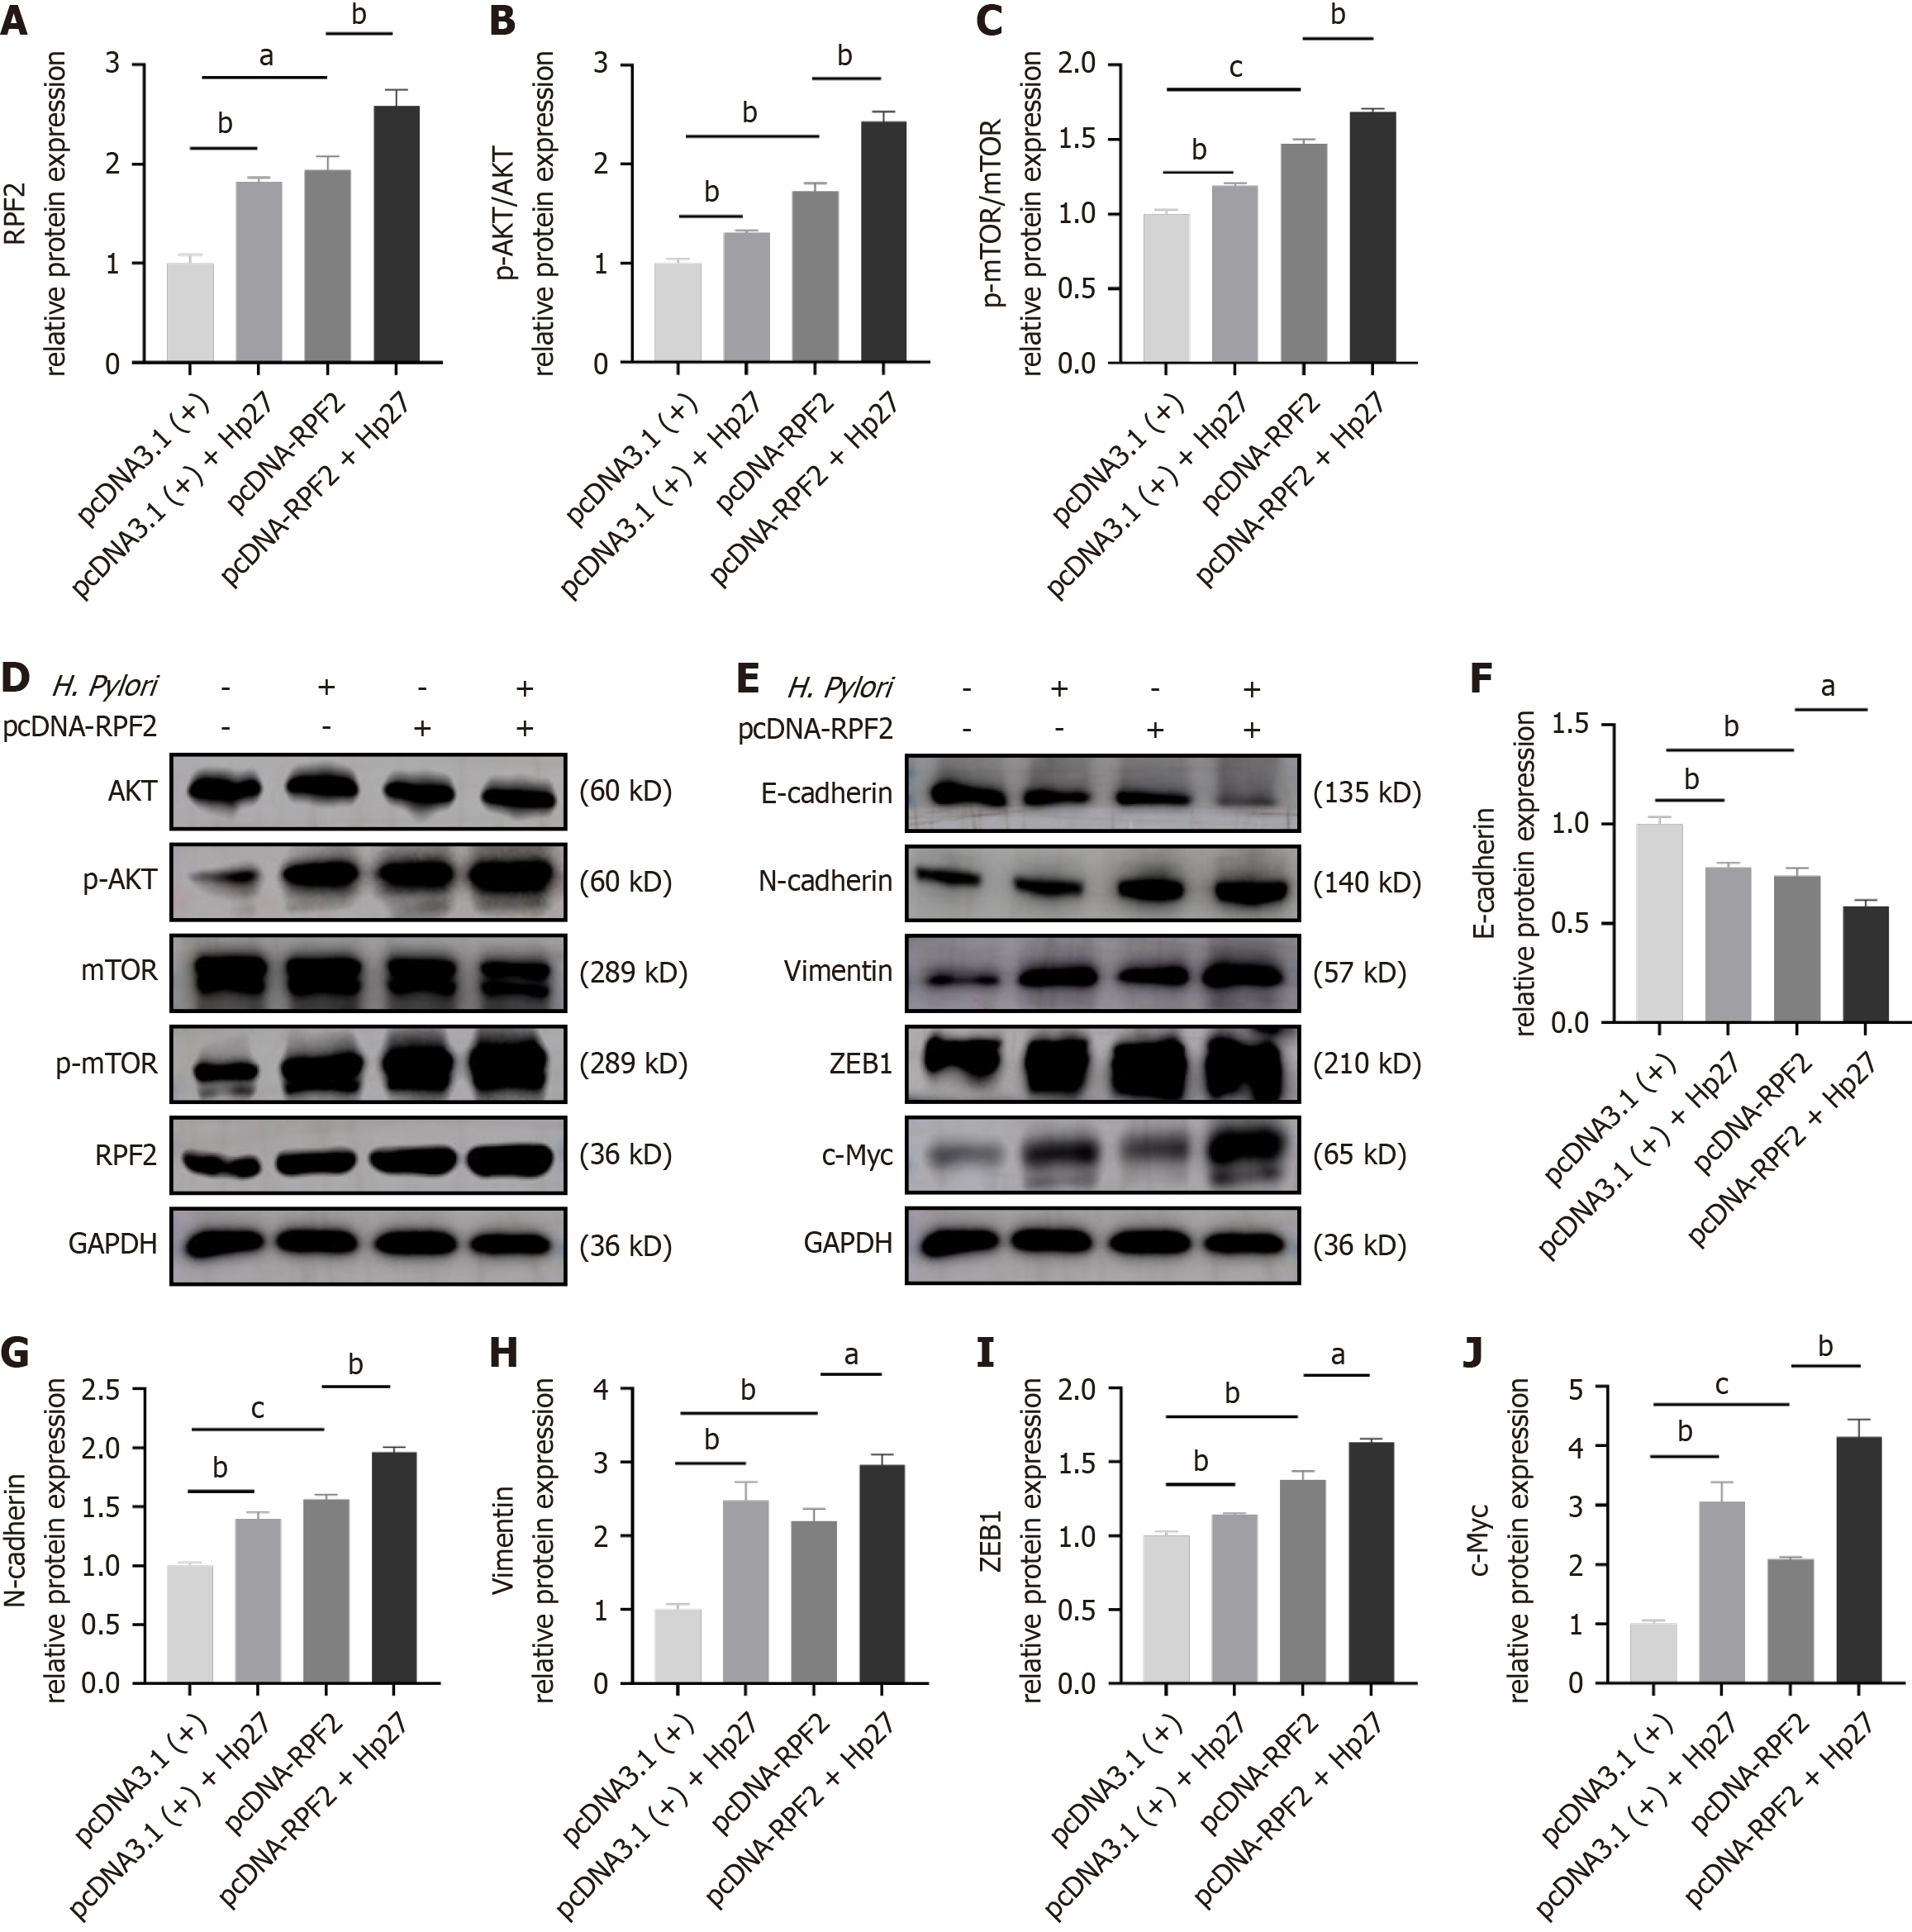
Figure 5 Changes in the expression of protein kinase B/mammalian target of rapamycin and epithelial-mesenchymal transition proteins in RPF2-overexpressing cells.
A-C: RPF2 and protein kinase B (AKT)/mammalian target of rapamycin (mTOR) protein levels; D: Western blots for RPF2 and AKT/mTOR; E: Western blot pictures of epithelial-mesenchymal transition (EMT) and c-Myc; F-J: EMT and c-Myc protein levels. aP < 0.05. bP < 0.01. cP < 0.001. AKT: Protein kinase B; p-AKT: Phospho-protein kinase B; mTOR: Mammalian target of rapamycin; p-mTOR: Phospho-mammalian target of rapamycin; GAPDH: Glyceraldehyde-3-phosphate dehydrogenase; H. pylori: Helicobacter pylori.
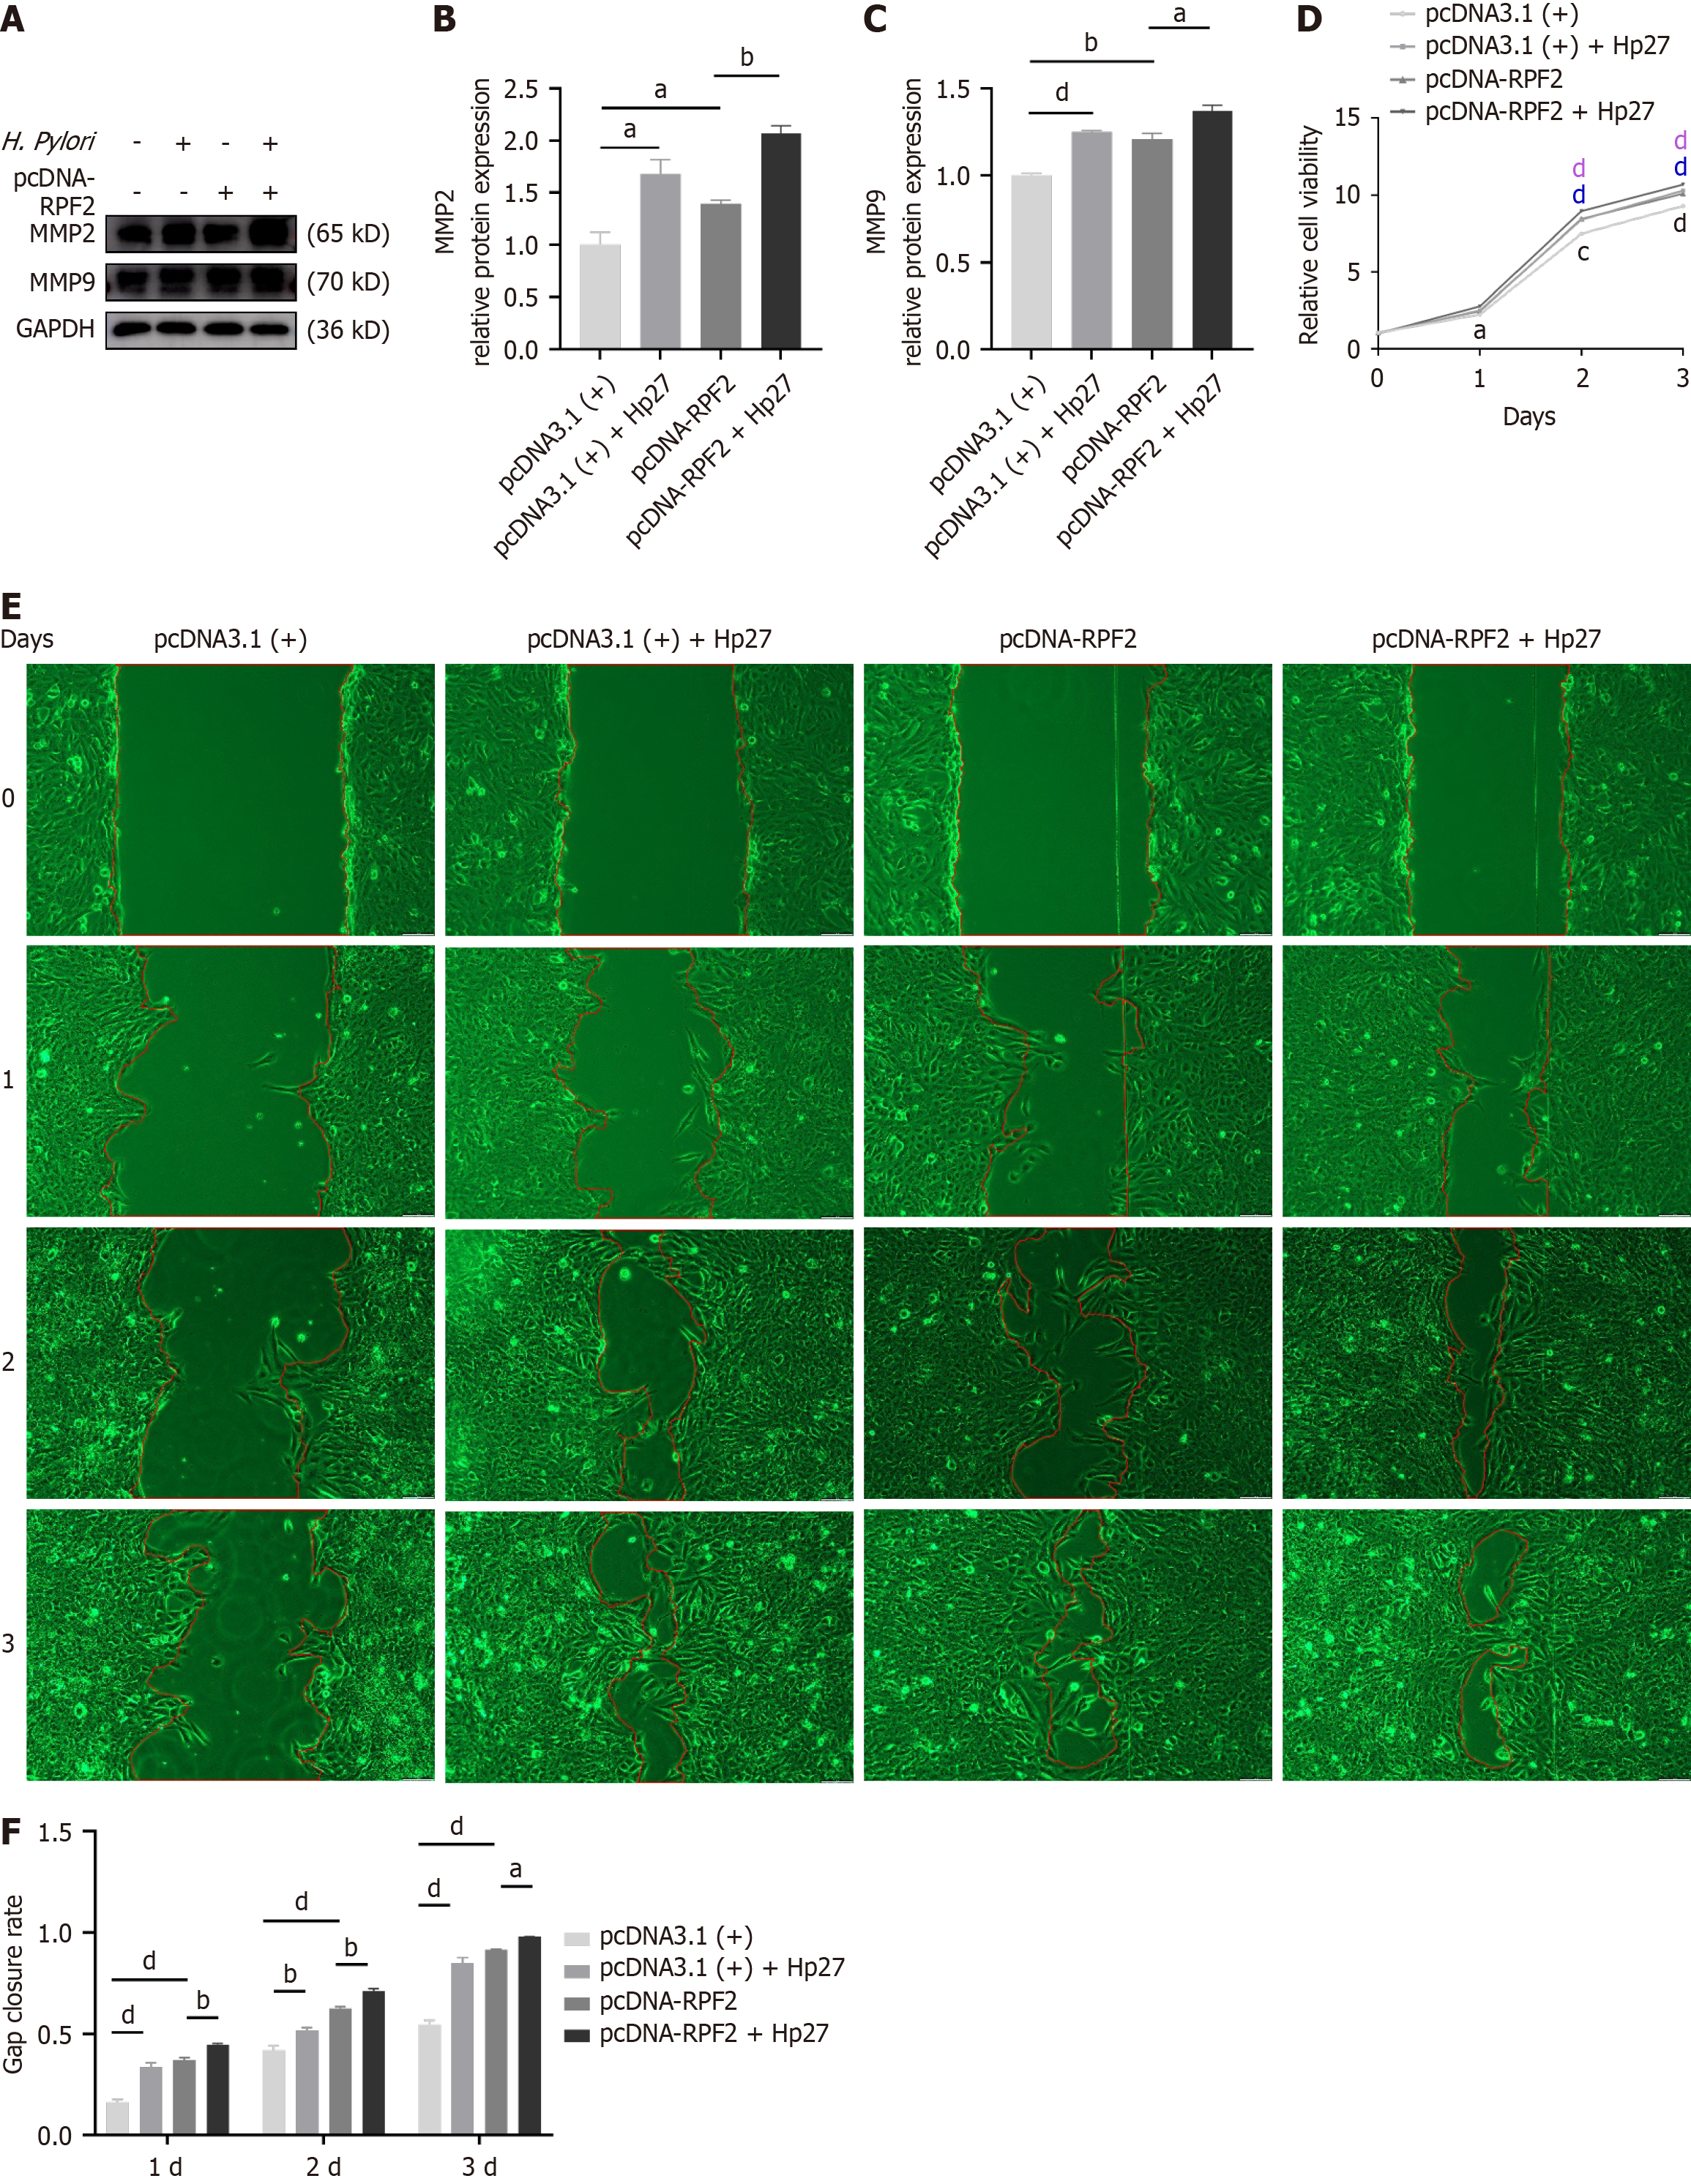
Figure 6 Effect of RPF2-overexpression on MMP2 and MMP9 expression, cell viability and migration.
A: Western blots of MMP2 and MMP9; B and C: MMP2 and MMP9 protein levels; D: Cell counting kit 8 in overexpressing cells; E: Pictures of wound healing assay in overexpressing cells; F: Gap closure rate after wound healing assay in overexpressing cells. Purple represents small interfering-negative control + Hp27 vs small interfering-negative control. Blue represents small interfering-RPF2 vs small interfering-negative control. Gray represents small interfering-RPF2 + Hp27 vs small interfering-RPF2. aP < 0.05. bP < 0.01. cP < 0.001. dP < 0.0001. GAPDH: Glyceraldehyde-3-phosphate dehydrogenase; H. pylori: Helicobacter pylori.
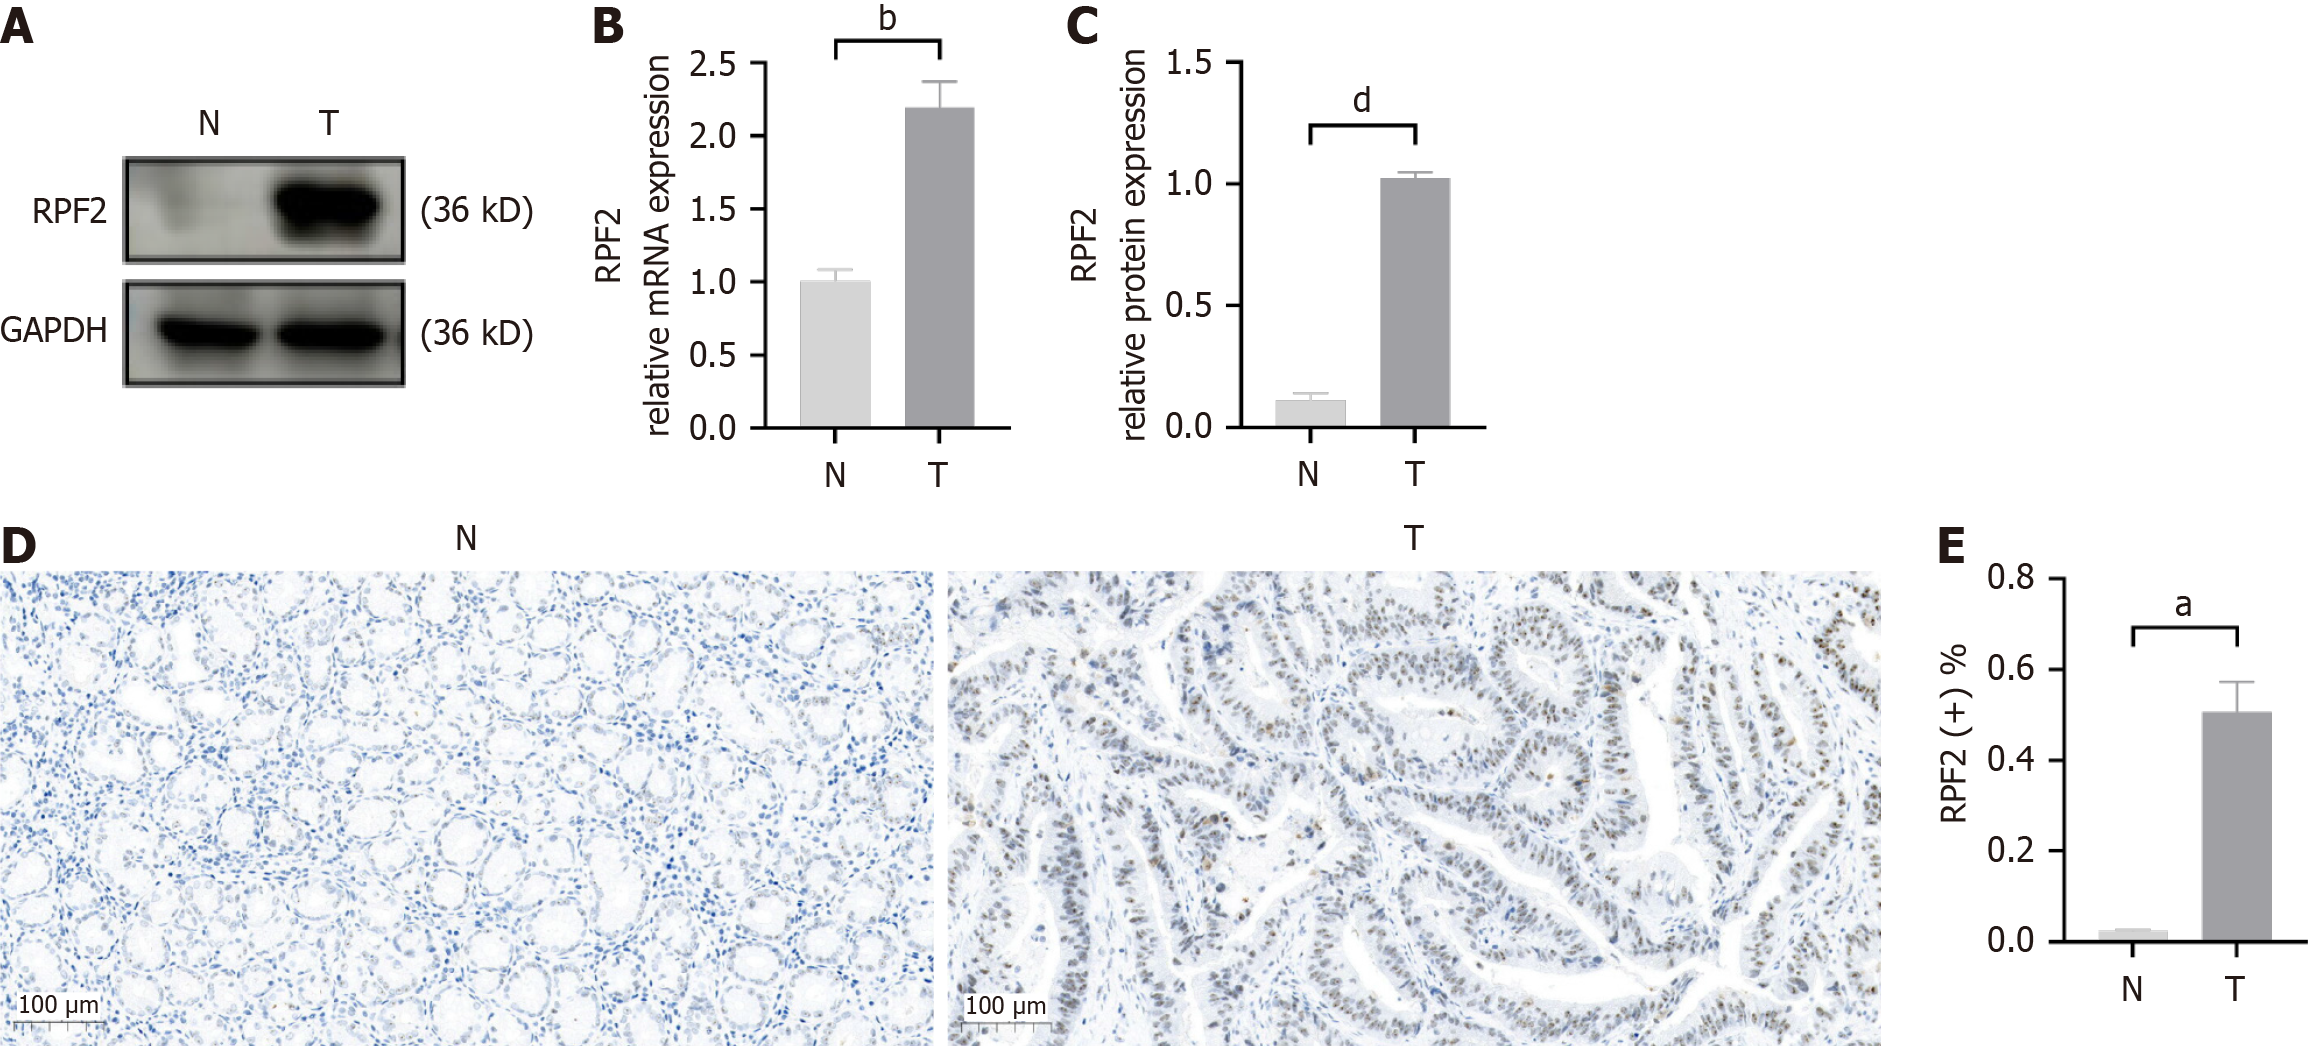
Figure 7 RPF2 expression in clinical gastric cancer tissues.
A: Western blots of RPF2 in clinical gastric cancer tissues; B: mRNA levels of RPF2 in clinical gastric cancer tissues (1.01 ± 0.08 vs 2.19 ± 0.18); C: Protein levels of RPF2 in clinical gastric cancer tissues (0.11 ± 0.03 vs 1.02 ± 0.03); D and E: Localization and expression of RPF2 protein in gastric cancer tissues (0.03 ± 0.01 vs 0.51 ± 0.07). Mean ± SE. N: Normal tissues; T: Tumor tissues.
- Citation: Hua YQ, Guo KX, Ni P, Wang D, An TY, Gao YY, Zhang RG. RPF2 regulates the protein kinase B/mammalian target of rapamycin pathway in the pathogenesis of Helicobacter pylori. World J Gastrointest Oncol 2025; 17(6): 105664
- URL: https://www.wjgnet.com/1948-5204/full/v17/i6/105664.htm
- DOI: https://dx.doi.org/10.4251/wjgo.v17.i6.105664


