Copyright
©The Author(s) 2025.
World J Gastrointest Oncol. Jun 15, 2025; 17(6): 105160
Published online Jun 15, 2025. doi: 10.4251/wjgo.v17.i6.105160
Published online Jun 15, 2025. doi: 10.4251/wjgo.v17.i6.105160
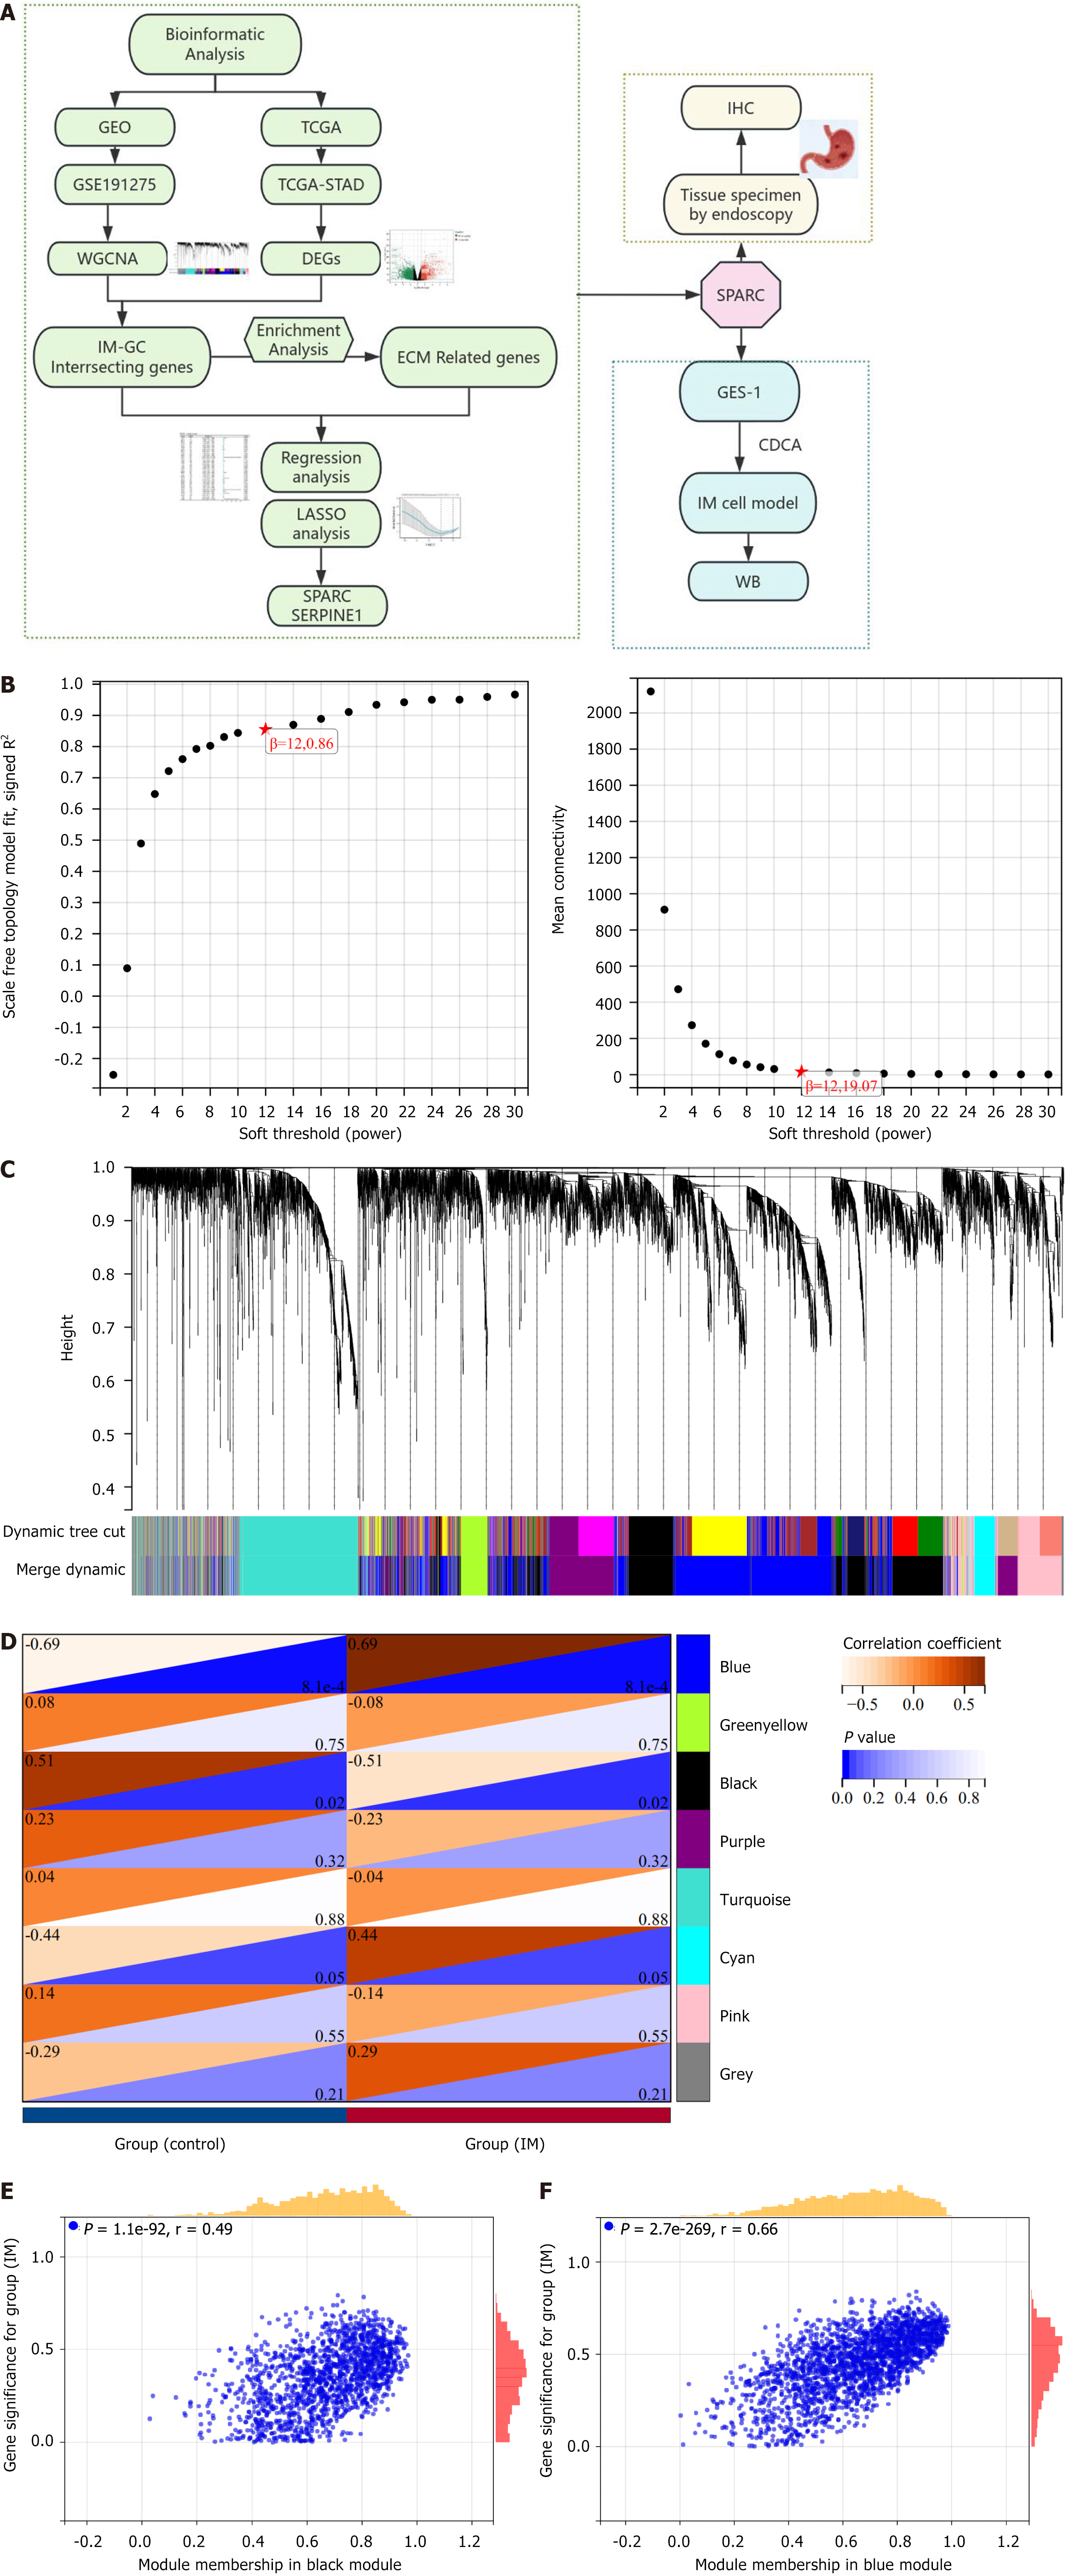
Figure 1 Flowchart and weighted gene co-expression network analysis.
A: Flowchart of research; B: The optimal β soft threshold was determined as 12 through scale-free topology and average connectivity analysis; C: Cluster analysis of characteristic gene modules resulted in the identification of eight modules; D-F: Heatmaps showed the correlation between phenotypes and characteristic gene modules confirmed black membership and blue membership as hub modules. GEO: Gene Expression Omnibus; TCGA: The Cancer Genome Atlas; STAD: Stomach adenocarcinoma; IM: Intestinal metaplasia; GC: Gastric cancer; ECM: Extracellular matrix; LASSO: Least absolute shrinkage and selection operator; WGCNA: Weighted gene co-expression network analysis; DEGs: Differentially expressed genes; CDCA: Chenodeoxycholic acid; WB: Western blot; IHC: Immunohistochemistry; SPARC: Secreted protein acidic and rich in cysteine.
Figure 2 The Cancer Genome Atlas-stomach adenocarcinoma volcano plot and intersection gene analysis.
A: Volcano plot for differentially expressed genes (DEGs) between normal and gastric cancer in The Cancer Genome Atlas-stomach adenocarcinoma (STAD); B and C: Venn diagram of the intersection of hub genes in intestinal metaplasia with DEGs in STAD; D and E: Gene Ontology and Kyoto Encyclopedia of Genes and Genomes enrichment results of upregulated DEGs; F and G: Downregulated DEGs; H: The Venn diagram of the intersection of hub genes in intestinal metaplasia, upregulated DEGs in STAD, and genes related to the extracellular matrix; I: A heatmap of the expression of 18 intersecting genes in GSE191275; J: A heatmap of the expression of 18 intersecting genes in The Cancer Genome Atlas-STAD. DEGs: Differentially expressed genes; GO: Gene Ontology; KEGG: Kyoto Encyclopedia of Genes and Genomes; ECM: Extracellular matrix.
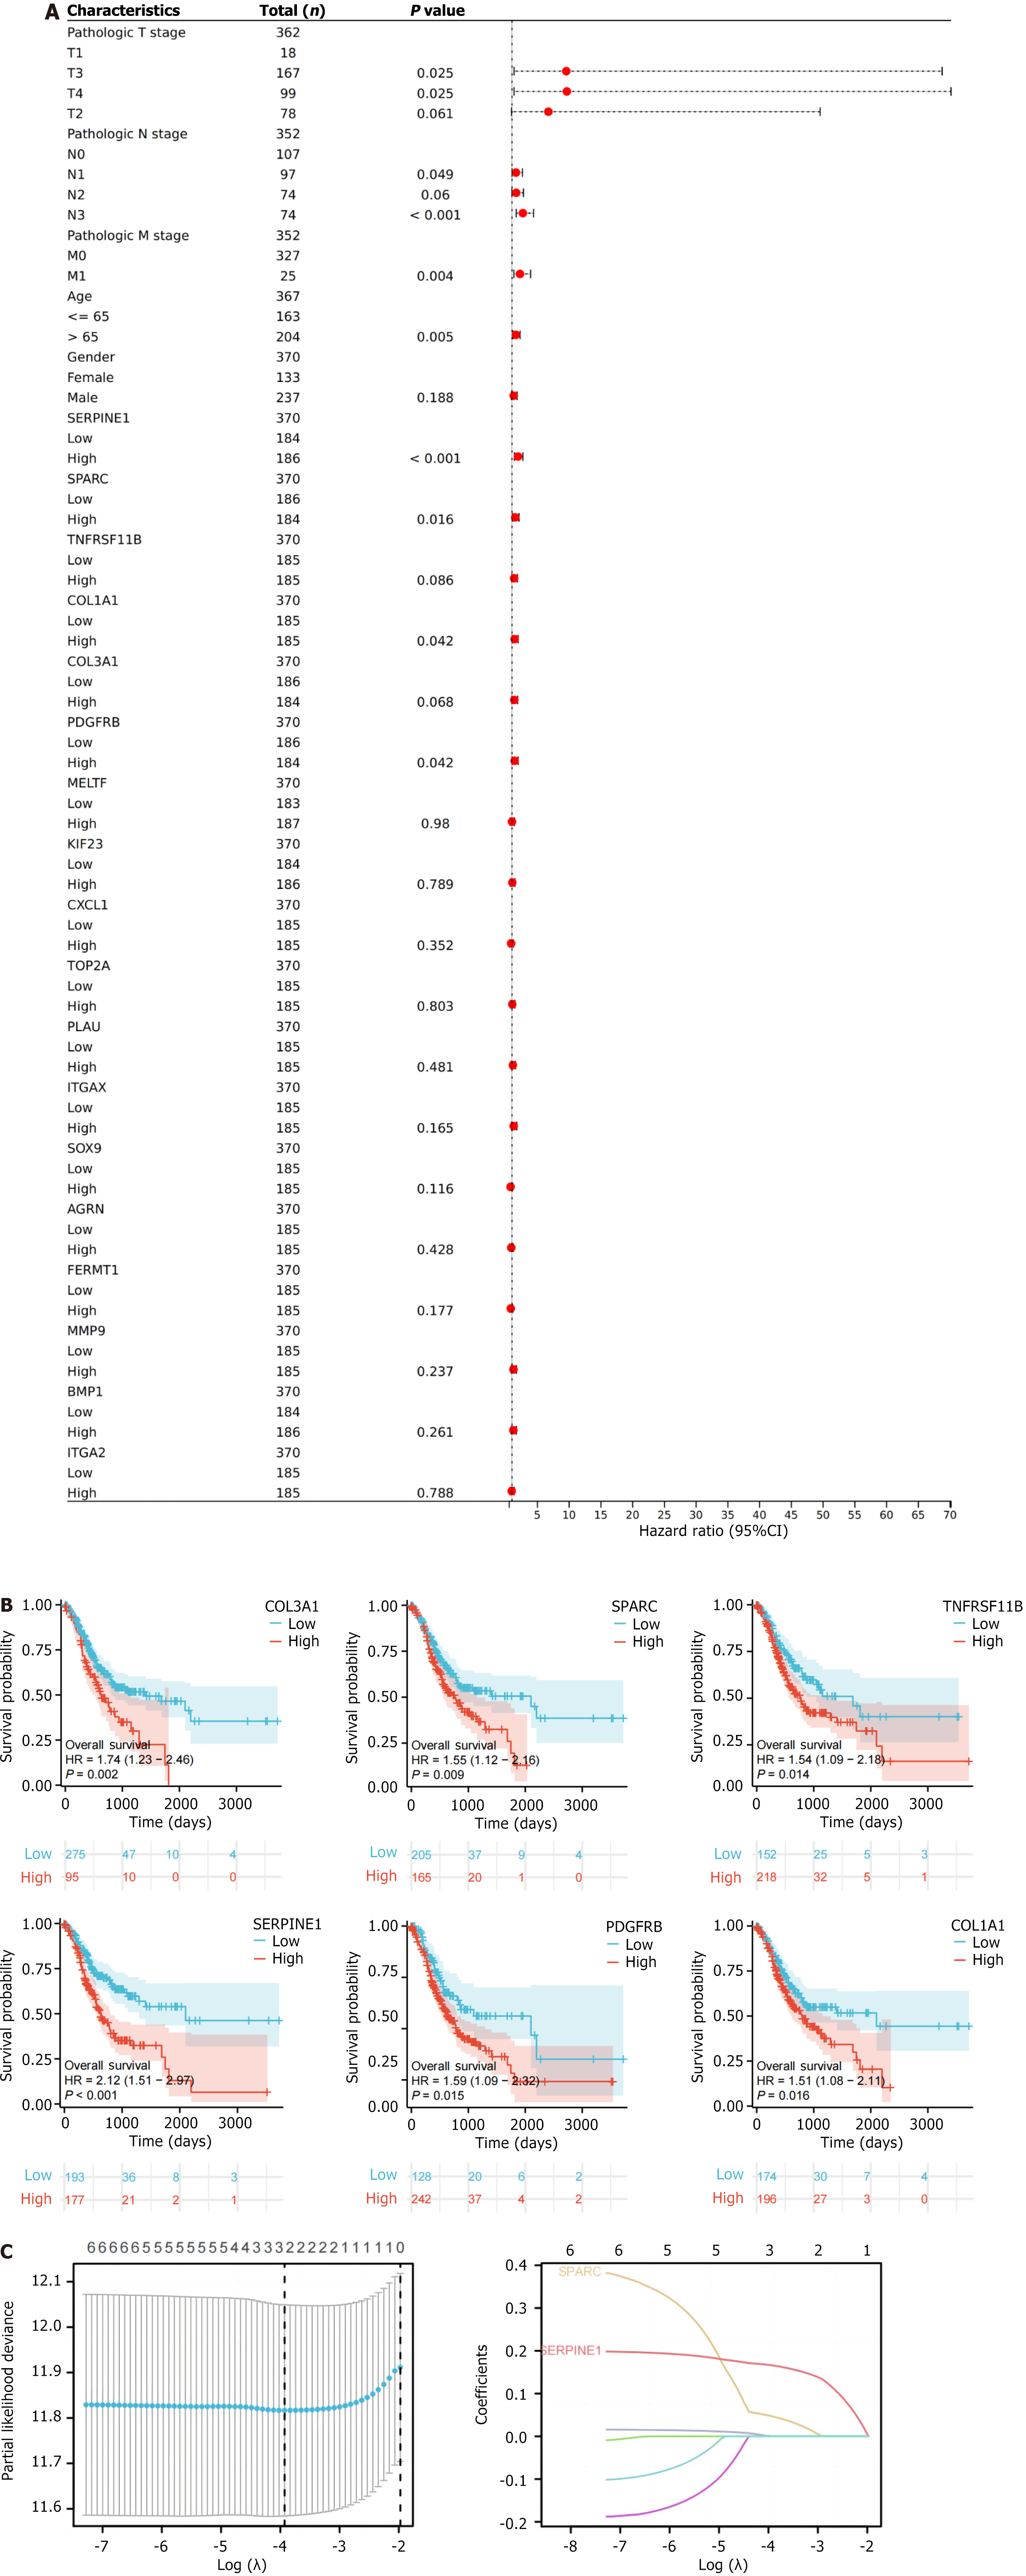
Figure 3 Prognostic analysis of intersecting genes and model establishment.
A: Forest plot of univariate regression analysis for 18 genes in The Cancer Genome Atlas-stomach adenocarcinoma dataset; B: Kaplan-Meier curve plot of six genes exhibiting an obvious relevance to overall survival; C: Least absolute shrinkage and selection operator analysis of six genes based on prognostic information from The Cancer Genome Atlas-colon adenocarcinoma. HR: Hazard ratio; CI: Confidence interval; SPARC: Secreted protein acidic and rich in cysteine.
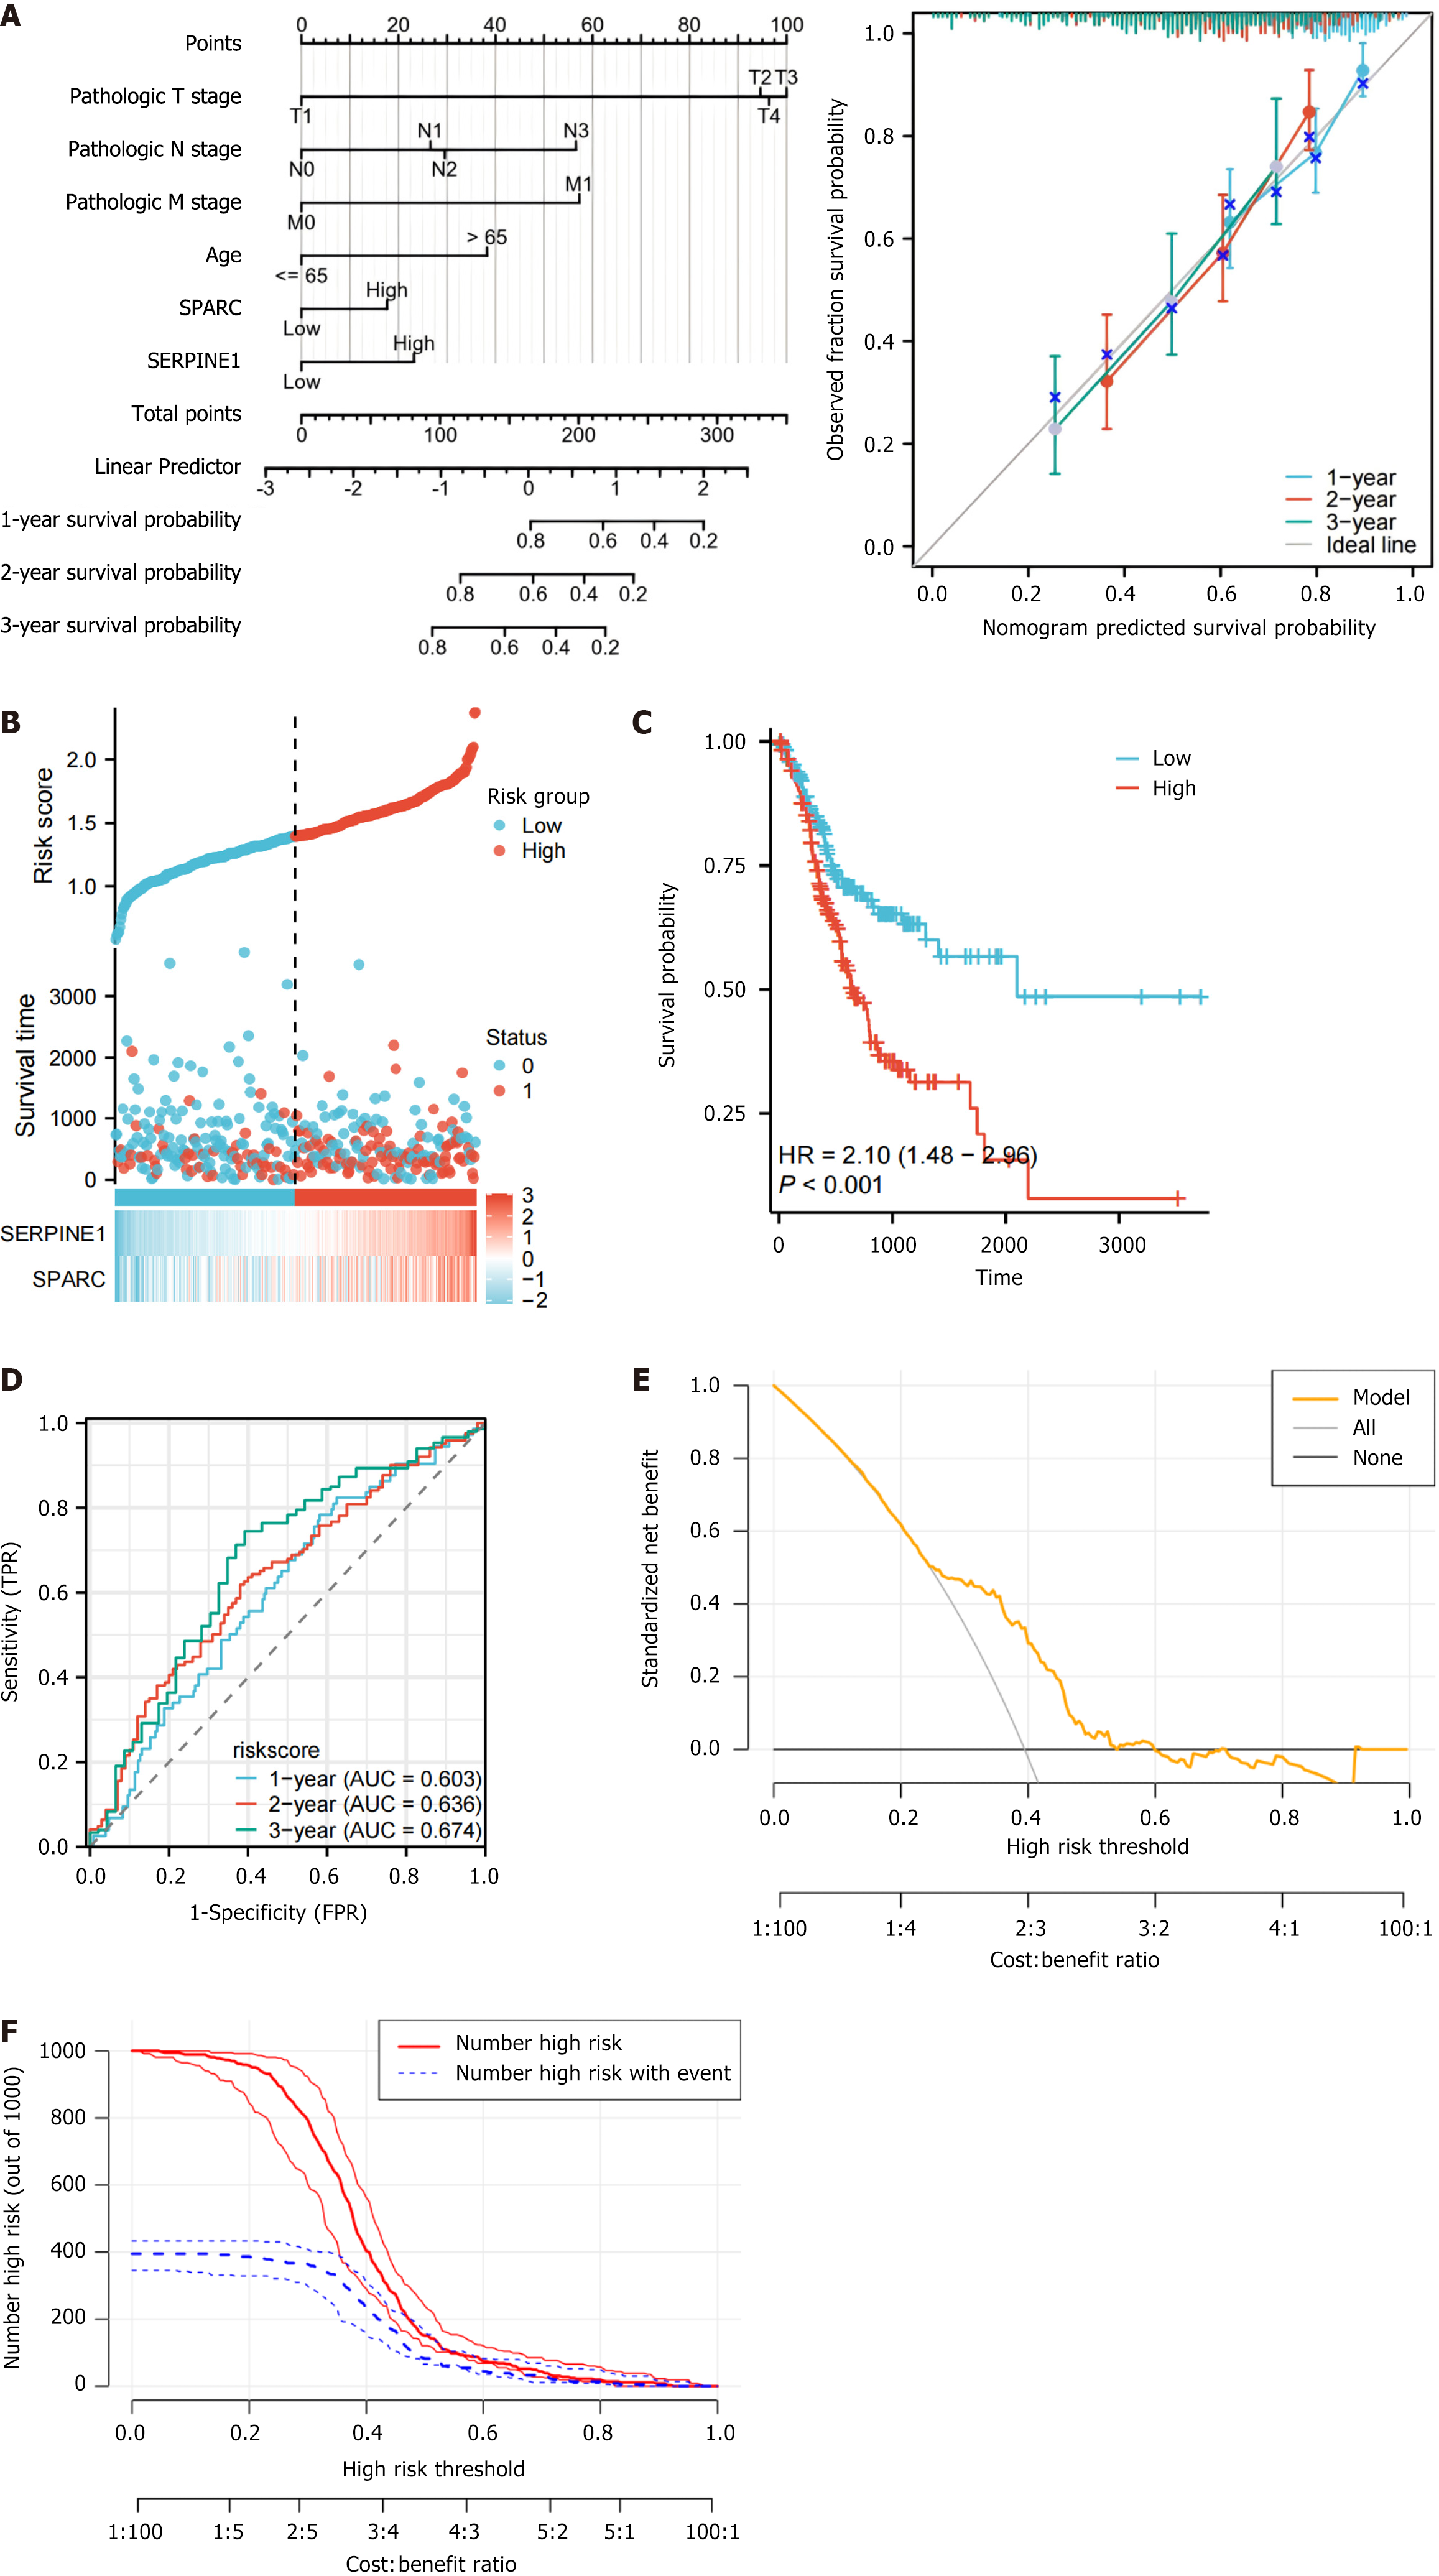
Figure 4 The establishment and validation of prognostic models.
A: Nomogram and prognostic calibration curve constructed based on clinical tumor node metastasis stage, age, and hub genes; B: Risk factor plot based on secreted protein acidic and rich in cysteine/SERPINE1 expression and risk score in the Cancer Genome Atlas-stomach adenocarcinoma dataset; C: Prognostic analysis and Kaplan-Meier curve for the two risk groups; D: Prognostic receiver operating characteristic curves at 1-year/2-year/3-year based on secreted protein acidic and rich in cysteine/SERPINE1 risk scores in the The Cancer Genome Atlas-stomach adenocarcinoma dataset; E: The decision curve analysis curve; F: The clinical impact curve. HR: Hazard ratio; TPR: True positive rate; FPR: False positive rate; AUC: Area under the curve; SPARC: Secreted protein acidic and rich in cysteine.
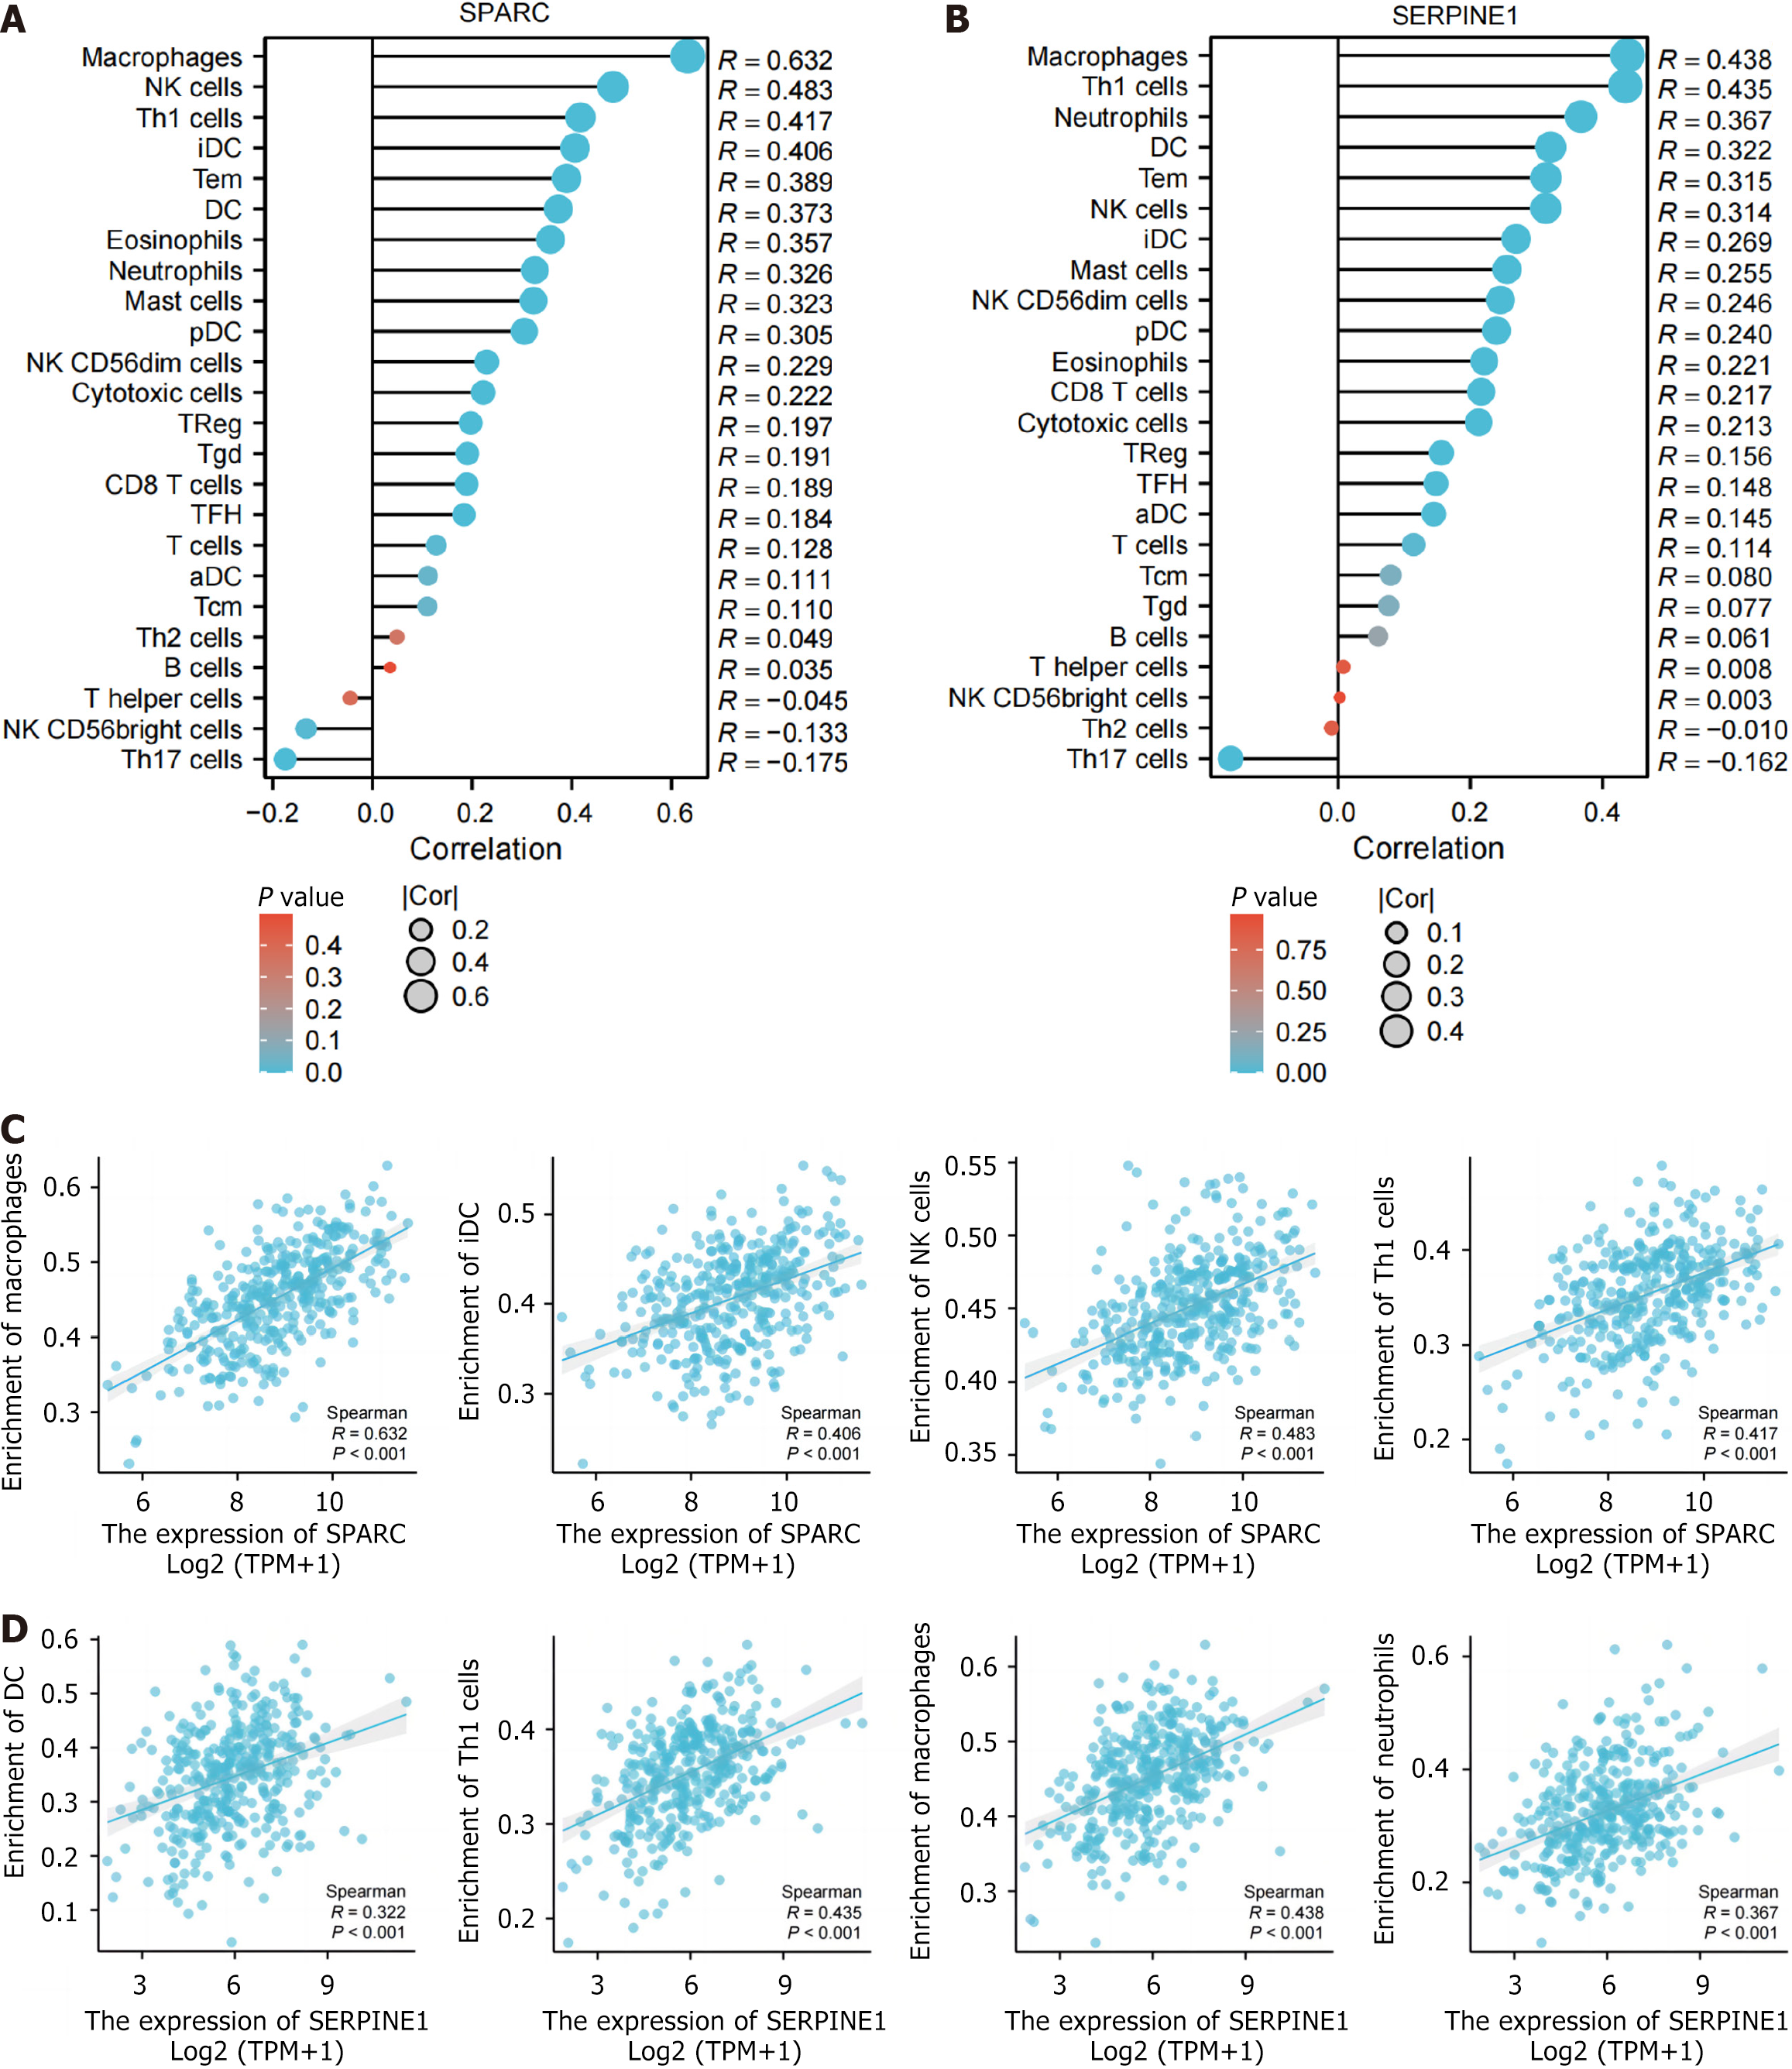
Figure 5 Secreted protein acidic and rich in cysteine/SERPINE1 immunoinfiltration analysis.
A and B: Secreted protein acidic and rich in cysteine (A) and SERPINE1 (B) in the data set the Cancer Genome Atlas (TCGA)-stomach adenocarcinoma (STAD) immune infiltration lollipop plot; C and D: Scatter plots of correlation between secreted protein acidic and rich in cysteine and major immune cells in TCGA-STAD (C) and between SERPINE1 and major immune cells in TCGA-STAD (D). NK: Natural killer; DC: Dendritic cells; iDC: Immature dendritic cells; pDC: Plasmacytoid dendritic cells; TFH: T follicular helper; aDC: Activated dendritic cells; CD: Cluster of differentiation; TPM: Transcripts per million; SPARC: Secreted protein acidic and rich in cysteine; Th: T helper cells; Treg: Regulatory T cells; Tgd: T gamma delta cells; Tcm: T central memory cells.
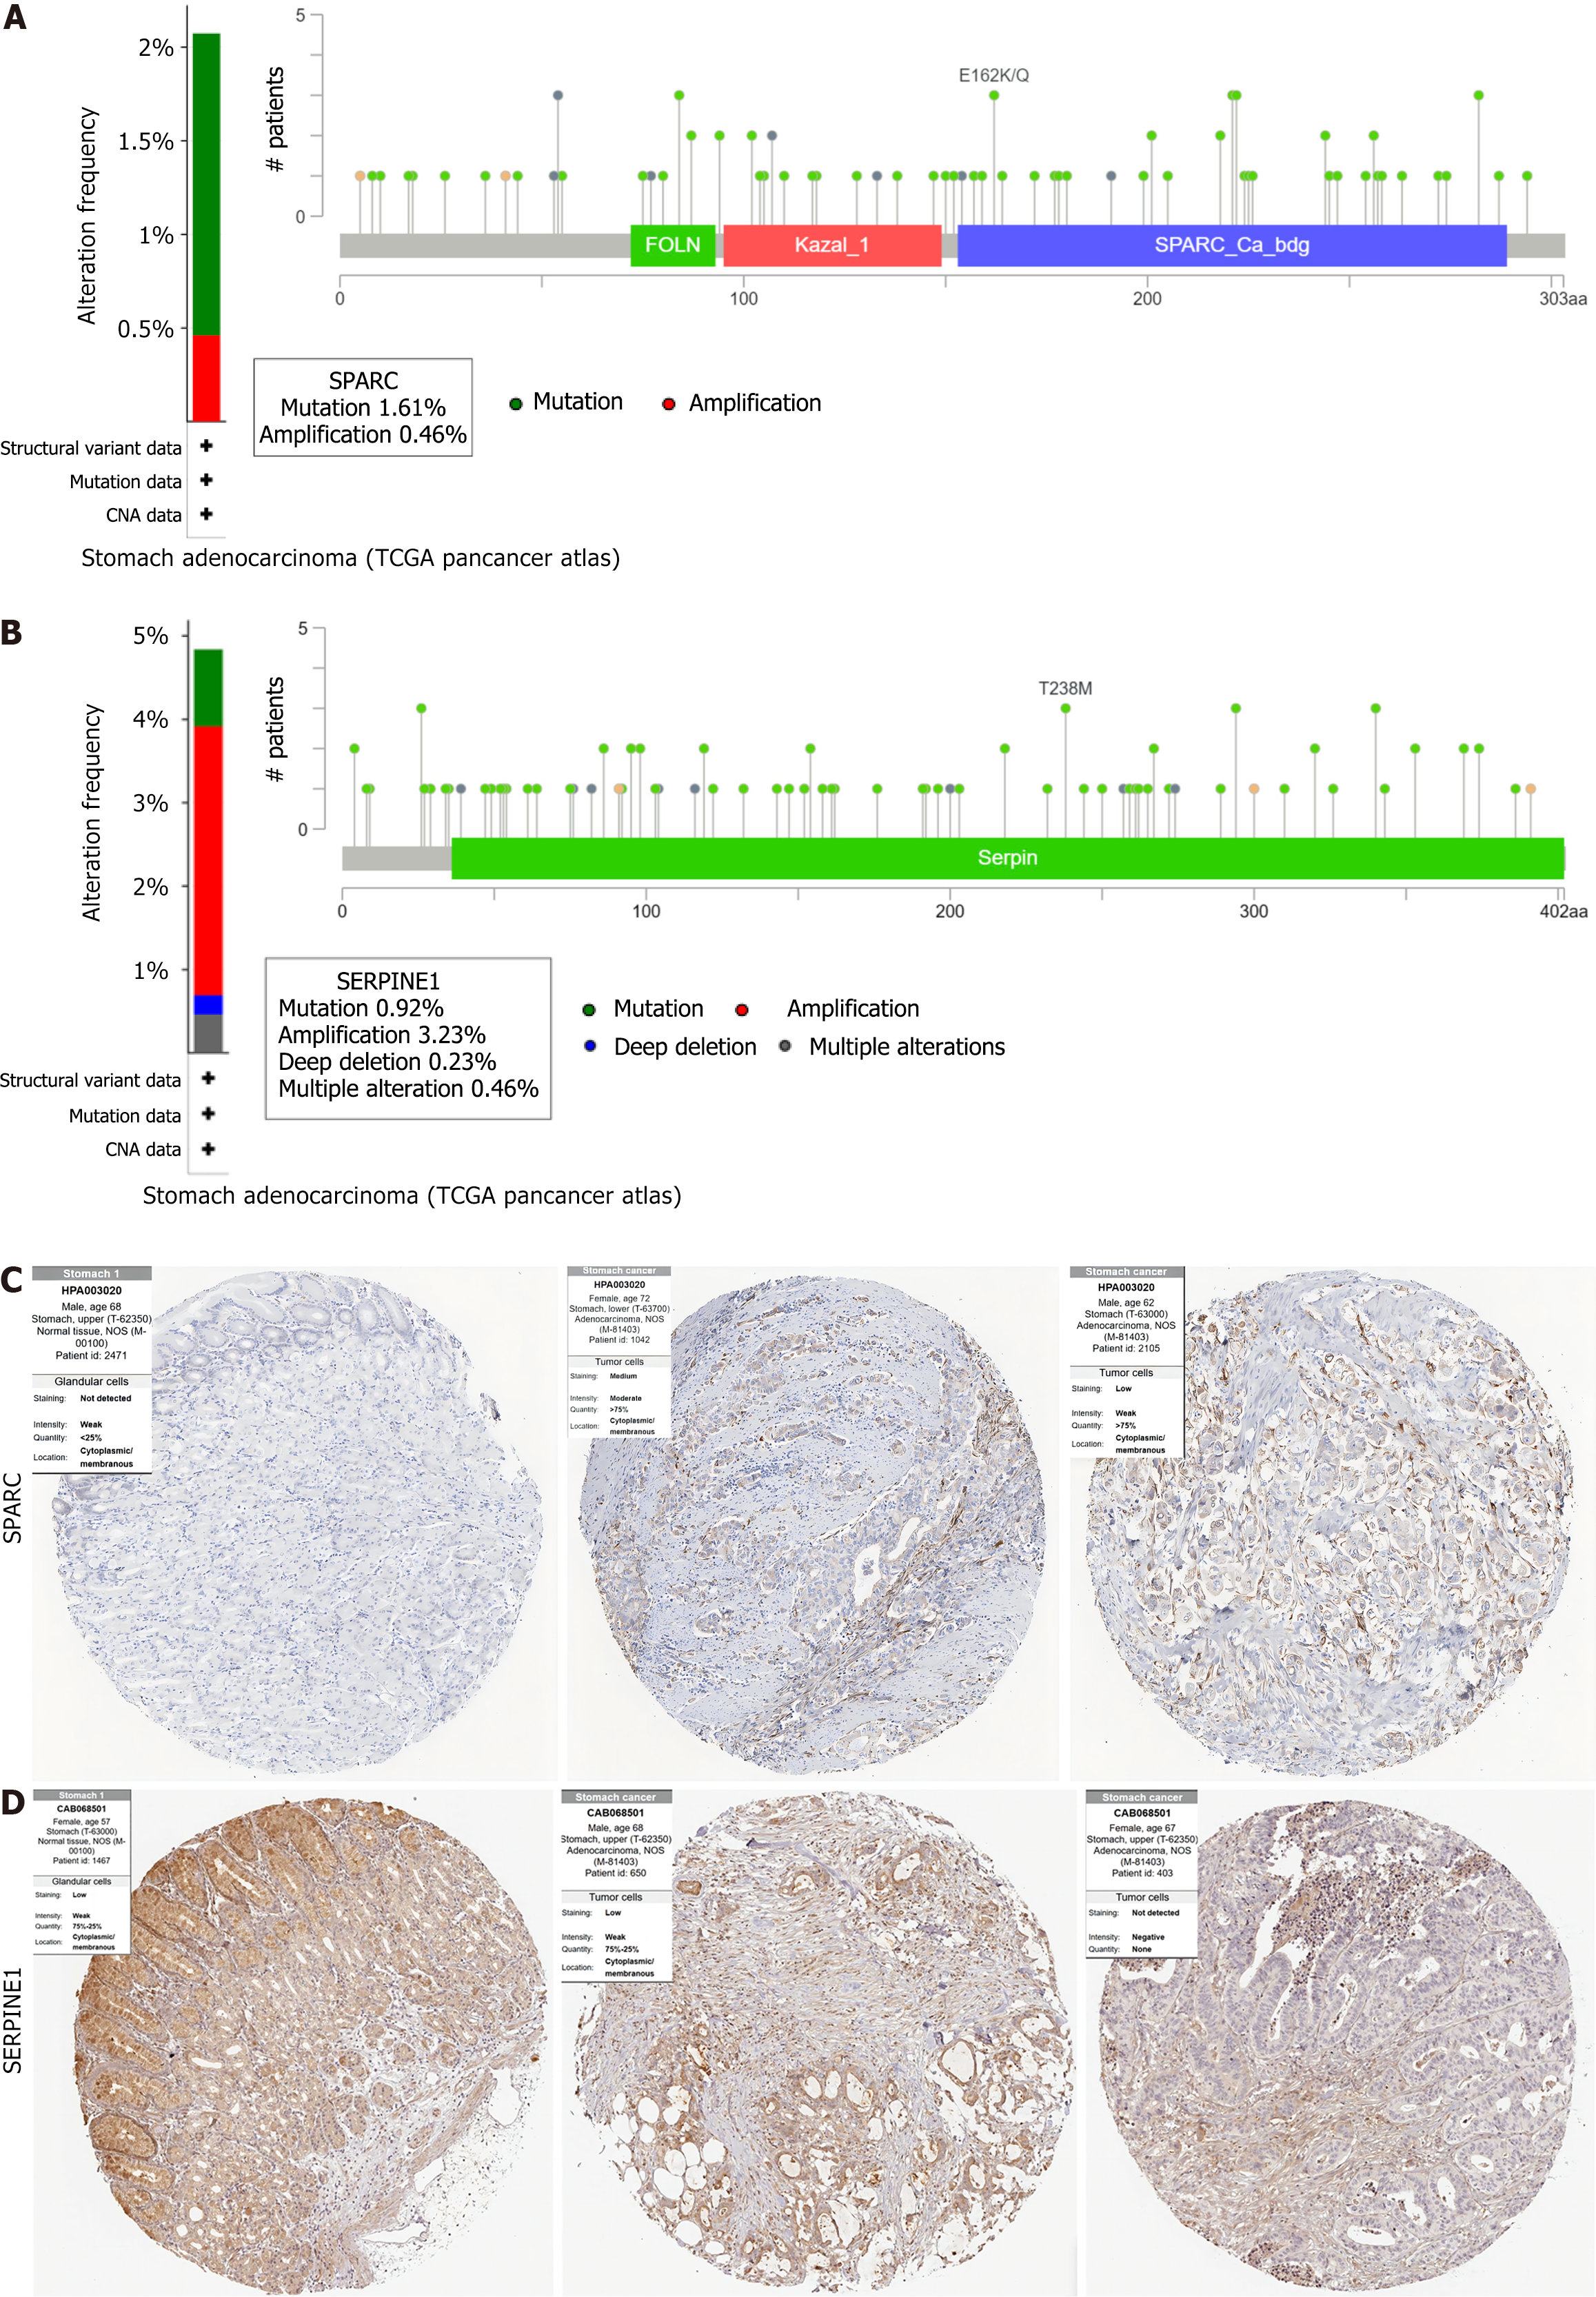
Figure 6 Genetic variation analysis and immunohistochemistry results in Human Protein Atlas of secreted protein acidic and rich in cysteine/SERPINE1.
A: Secreted protein acidic and rich in cysteine mutation analysis results; B: SERPINE1 mutation analysis results; C and D: Immunohistochemical images of Secreted protein acidic and rich in cysteine (C) and SERPINE1 (D) in normal gastric mucosa tissues and gastric cancer. SPARC: Secreted protein acidic and rich in cysteine.
Figure 7 Prognostic model validation and hub gene analysis.
A: Prognosis model in the GSE15459 dataset risk score Kaplan-Meier curve; B: Prognostic model in the GSE15459 dataset risk factor map; C: The time-varying prognostic receiver operating characteristic curve of the prognostic model in the GSE15459 dataset; D: TNFRSF11B COL1A1, COL3A1, SERPINE1, secreted protein acidic and rich in cysteine (SPARC), PDGFRB in diagnosis of least absolute shrinkage and selection operator GSE191275 dataset regression coefficient; E: Two variables with non-zero regression coefficients generated by the least absolute shrinkage and selection operator analysis in GSE191275: SPARC/TNFRSF11B; F and G: SPARC expression in The Cancer Genome Atlas (TCGA)-stomach adenocarcinoma (STAD) unpaired samples and paired samples; H: Expression of SPARC in normal gastric mucosa and intestinal metaplasia samples of GSE191275; I and J: SPARC was expressed in TCGA-STAD dataset at different clinical stages; K: Low and high SPARC expression groups had obviously different survivals in TCGA-STAD, clinical stage IV, T3T4 and N2N3 (P < 0.05); L: Radar map of SPARC expression in pancarcinoma; M: Prognosis and overall survival of SPARC in pancarcinoma. aP < 0.001. HR: Hazard ratio; TPR: True positive rate; FPR: False positive rate; TPM: Transcripts per million; AUC: Area under the curve; ACC: Adrenocortical carcinoma; BLCA: Bladder urothelial carcinoma; BRCA: Breast invasive carcinoma; CESC: Cervical squamous cell carcinoma and endocervical adenocarcinoma; CHOL: Cholangiocarcinoma; COAD: Colon adenocarcinoma; DLBC: Lymphoid neoplasm diffuse large B-cell lymphoma; ESCA: Esophageal carcinoma; GBM: Glioblastoma multiforme; HNSC: Head and neck squamous cell carcinoma; KICH: Kidney chromophobe; KIRC: Kidney renal clear cell carcinoma; KIRP: Kidney renal papillary cell carcinoma; LAML: Acute myeloid leukemia; LGG: Brain lower grade glioma; LIHC: Liver hepatocellular carcinoma; LUAD: Lung adenocarcinoma; LUSC: Lung squamous cell carcinoma; MESO: Mesothelioma; OV: Ovarian serous cystadenocarcinoma; PAAD: Pancreatic adenocarcinoma; PRAD: Prostate adenocarcinoma; PCPG: Pheochromocytoma and paraganglioma; READ: Rectum adenocarcinoma; SARC: Sarcoma; SKCM: Skin cutaneous melanoma; STAD: Stomach adenocarcinoma; TGCT: Testicular germ cell tumors; THCA: Thyroid carcinoma; THYM: Thymoma; UCS: Uterine carcinosarcoma; UVM: Uveal melanoma; UCEC: Uterine corpus endometrial carcinoma; SPARC: Secreted protein acidic and rich in cysteine.
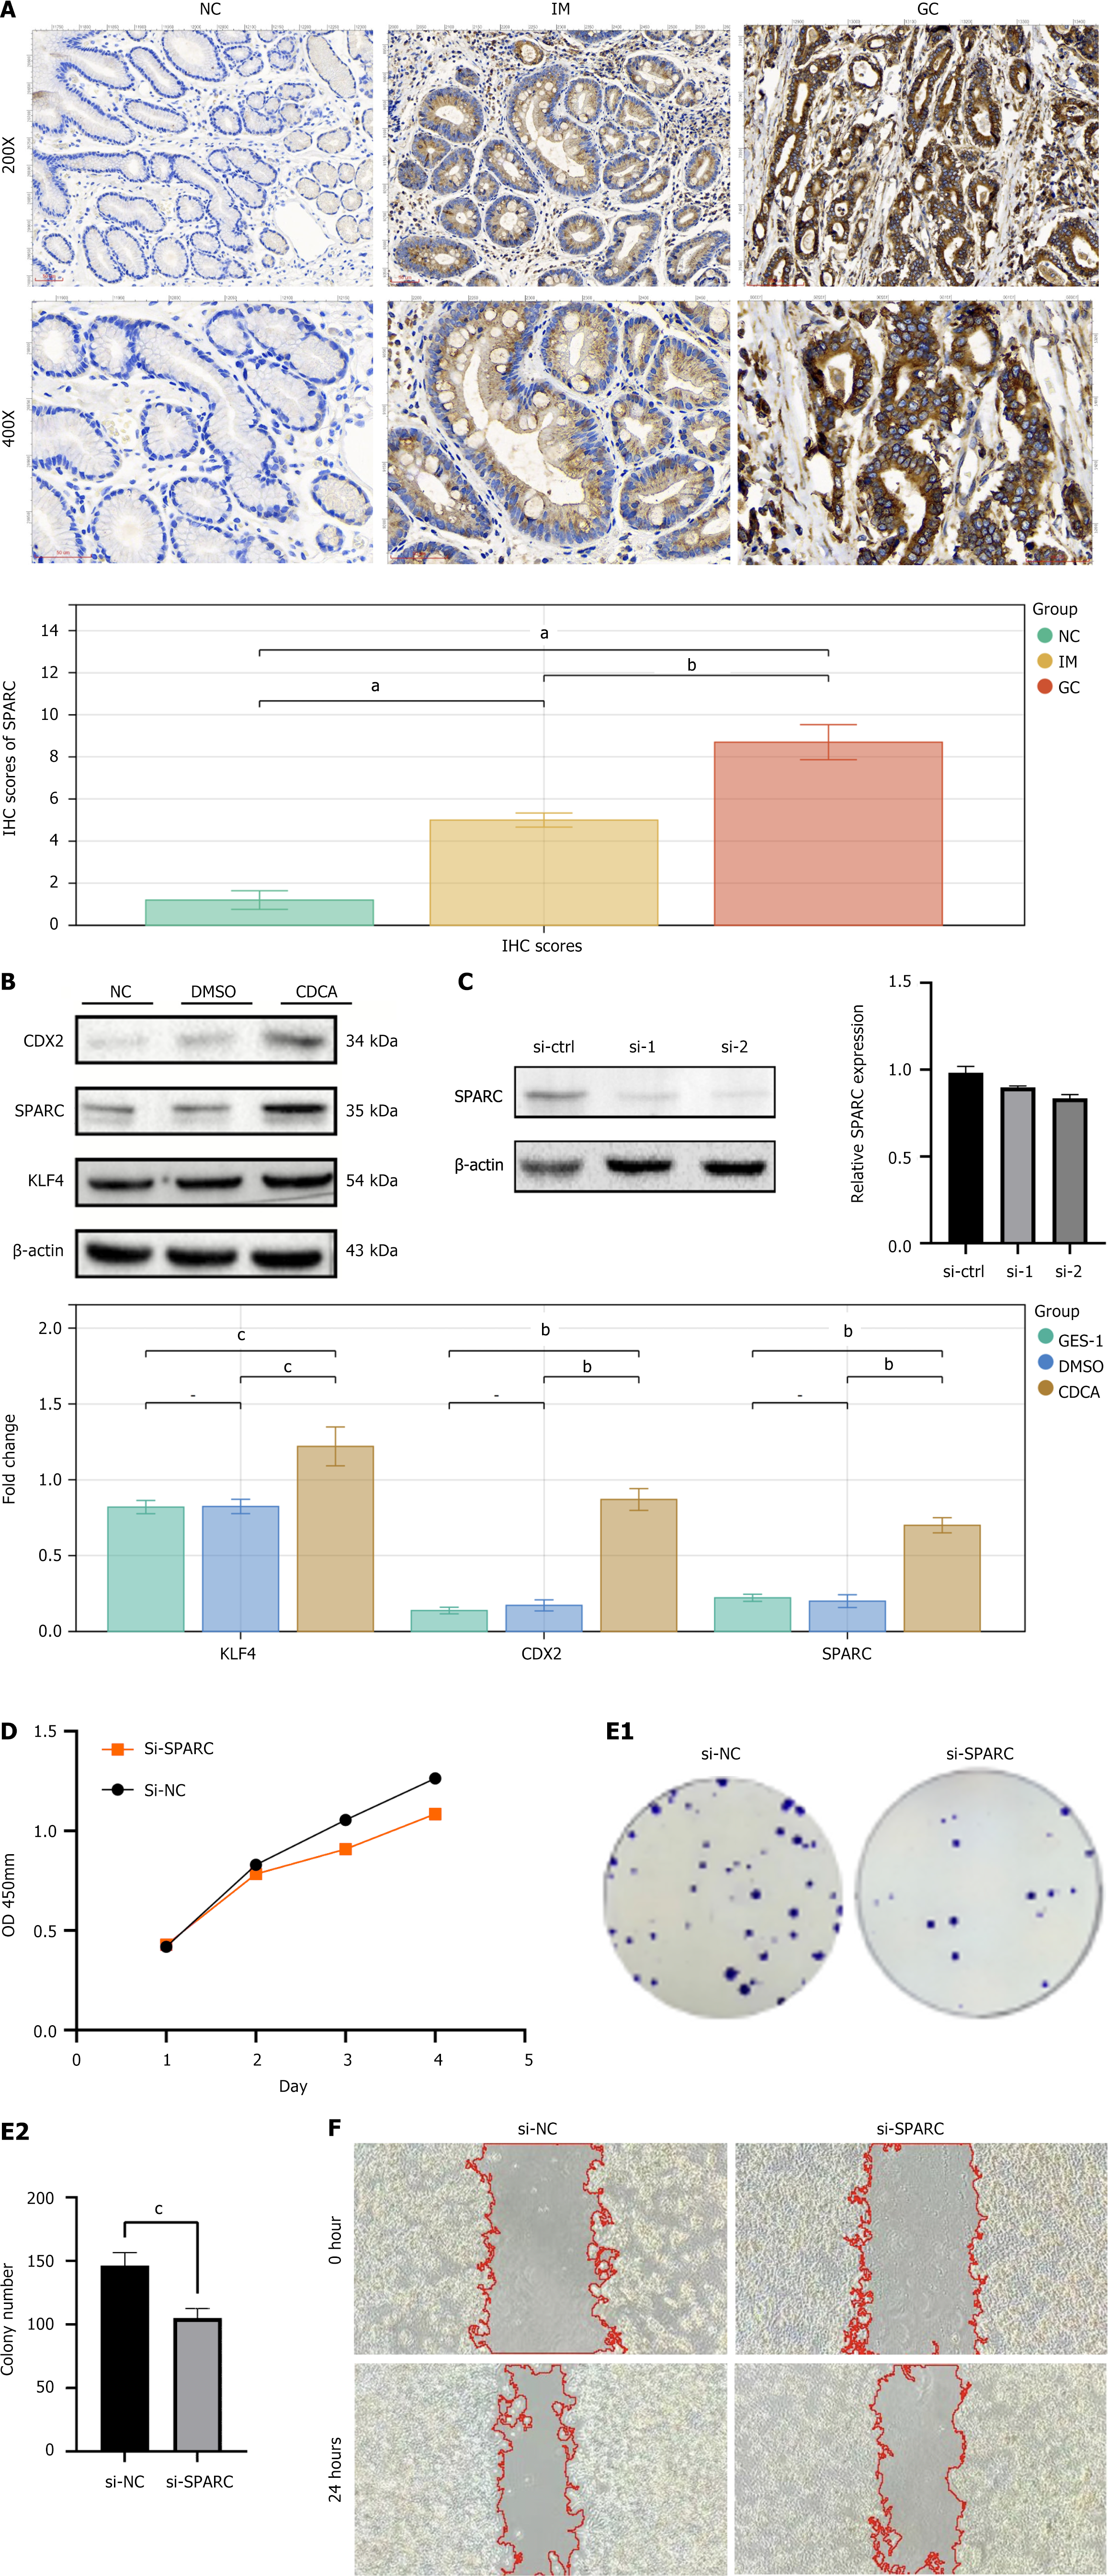
Figure 8 Secreted protein acidic and rich in cysteine expression in tissues and cells.
A: The immunohistochemistry results of secreted protein acidic and rich in cysteine (SPARC) in normal gastric mucosa, intestinal metaplasia (IM), and gastric cancer tissue; B: The western blot results of IM markers KLF4, CDX2, and SPARC in GES-1 cell line and chenodeoxycholic acid-induced GES-1 IM cell model; C: The validation results of SPARC knockdown by small interfering (si)-RNA through WB and quantitative real-time polymerase chain reaction; D: The line graph assessing cell proliferation by cell counting kit 8 assay after SPARC knockdown with small interfering (si)-RNA; E: The results of the colony formation assay after SPARC knockdown with si-RNA; F: The results of the cell wound healing assay after SPARC knockdown with si-RNA. aP < 0.001, bP < 0.01, cP < 0.05. NC: Normal control; IM: Intestinal metaplasia; GC: Gastric cancer; IHC: Immunohistochemistry; DMSO: Dimethyl sulfoxide; CDCA: Chenodeoxycholic acid; OD: Optical density; si-NC: Small interfering-normal control; si-SPARC: Small interfering-secreted protein acidic and rich in cysteine; SPARC: Secreted protein acidic and rich in cysteine.
- Citation: Wang L, Wang MH, Yuan YH, Xu RZ, Bai L, Wang MZ. Identification and validation of extracellular matrix-related genes in the progression of gastric cancer with intestinal metaplasia. World J Gastrointest Oncol 2025; 17(6): 105160
- URL: https://www.wjgnet.com/1948-5204/full/v17/i6/105160.htm
- DOI: https://dx.doi.org/10.4251/wjgo.v17.i6.105160


