Copyright
©The Author(s) 2025.
World J Gastrointest Oncol. Mar 15, 2025; 17(3): 98103
Published online Mar 15, 2025. doi: 10.4251/wjgo.v17.i3.98103
Published online Mar 15, 2025. doi: 10.4251/wjgo.v17.i3.98103
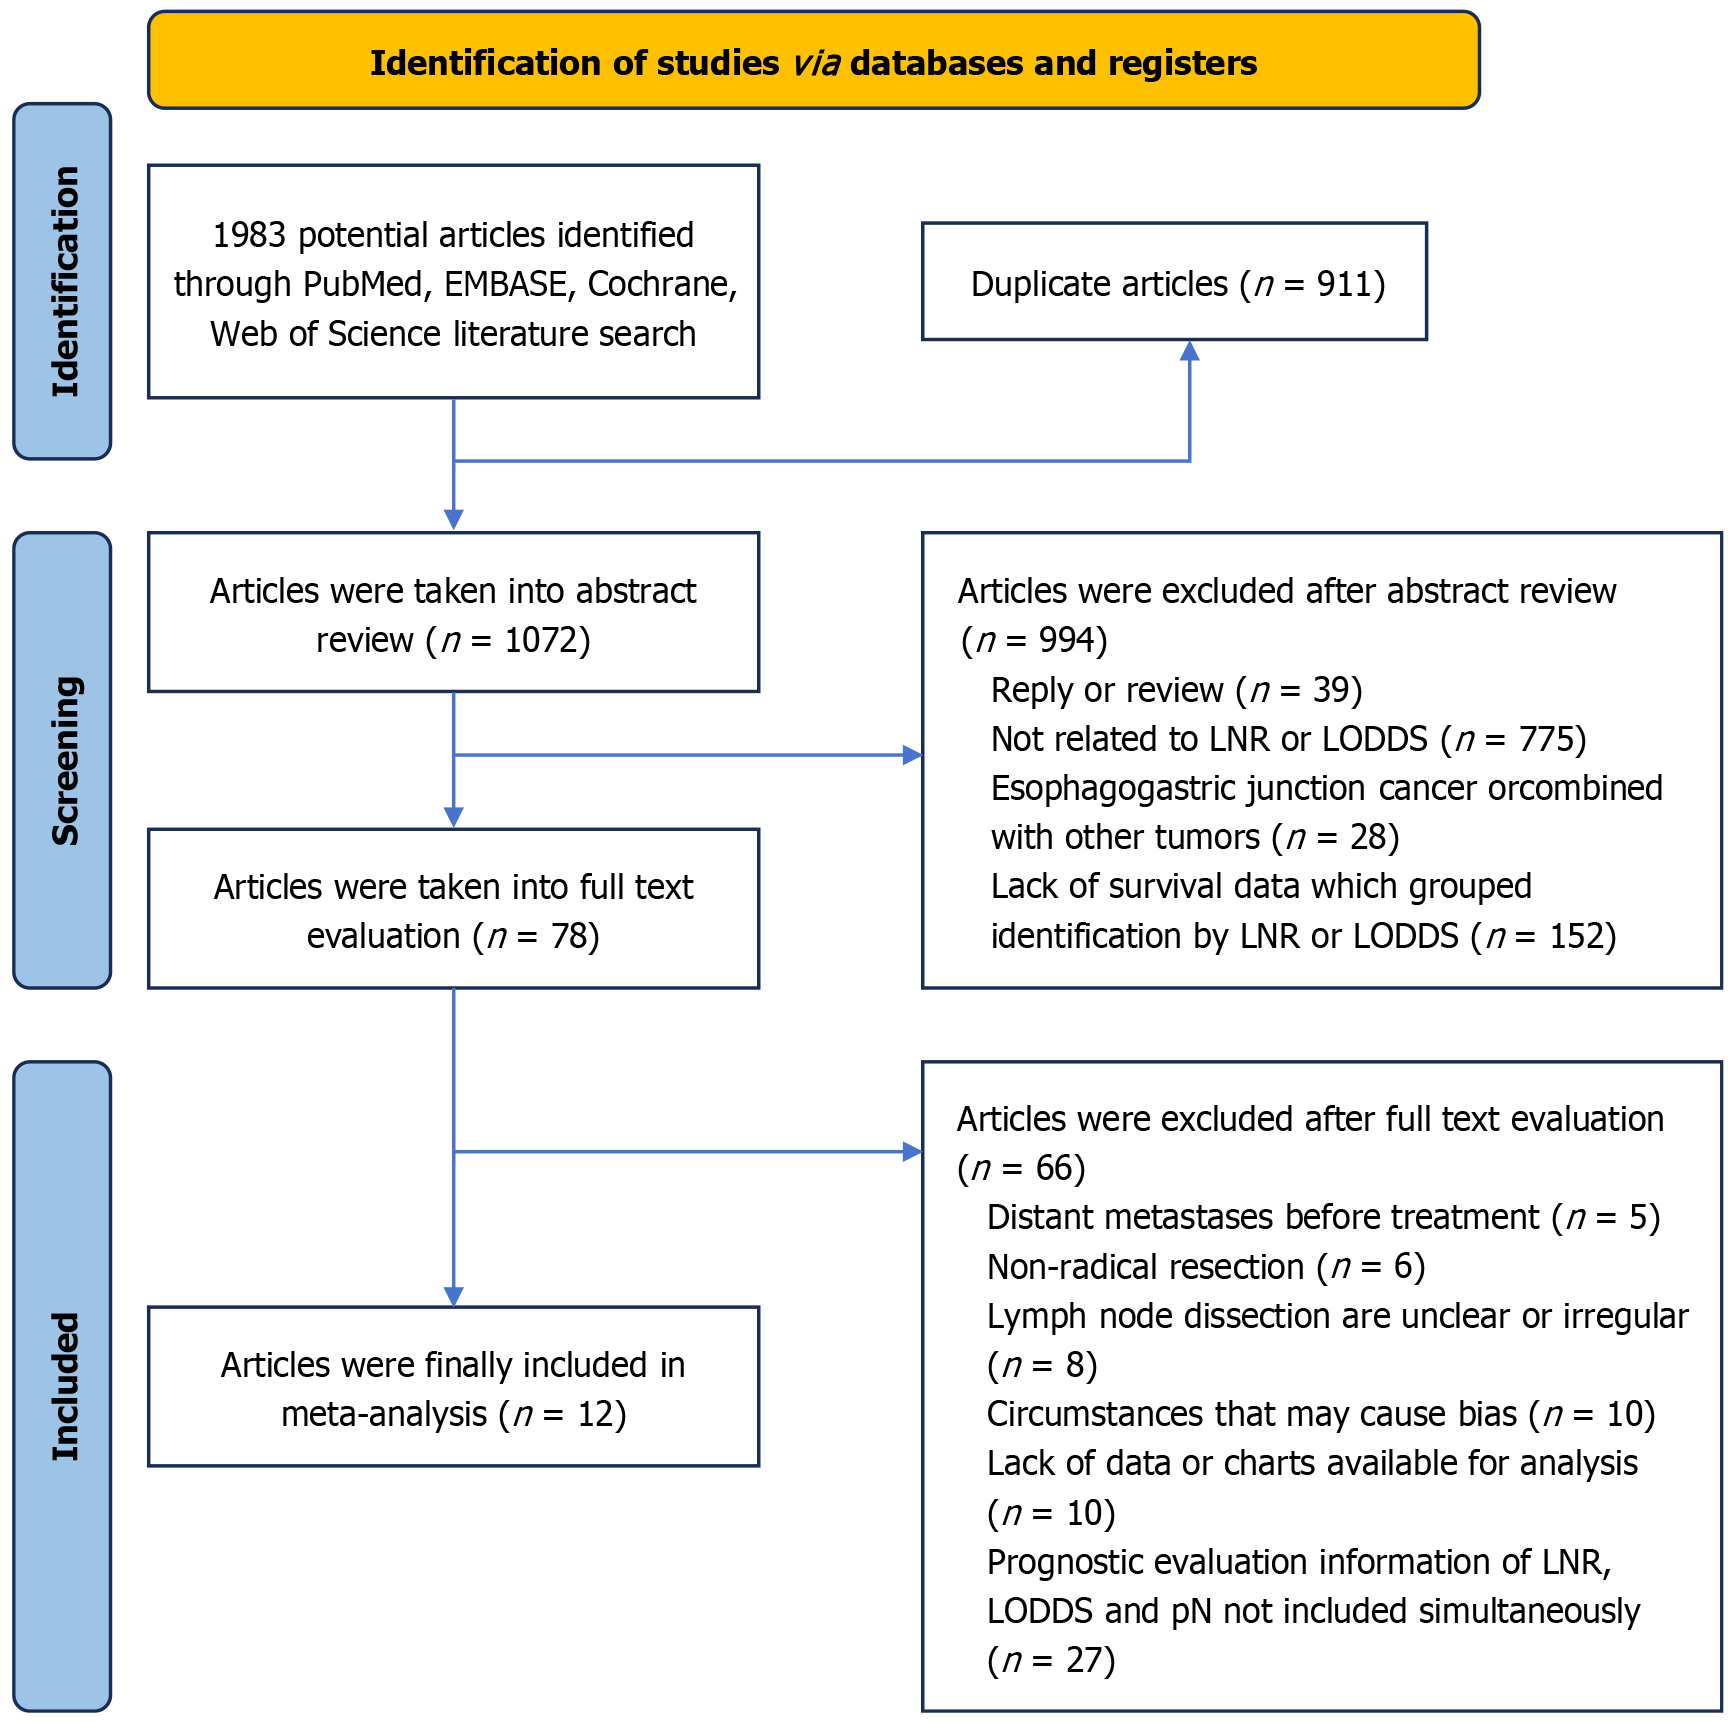
Figure 1 Flow diagram of article search and inclusion.
LNR: Lymph node ratio; LODDS: Log odds of positive lymph nodes; pN: Pathological lymph nodes.
Figure 2 Forest plots.
A: Positive lymph node ratio and overall survival; B: Log odds of positive lymph nodes and overall survival; C: Pathological lymph nodes and overall survival. CI: Confidence interval.
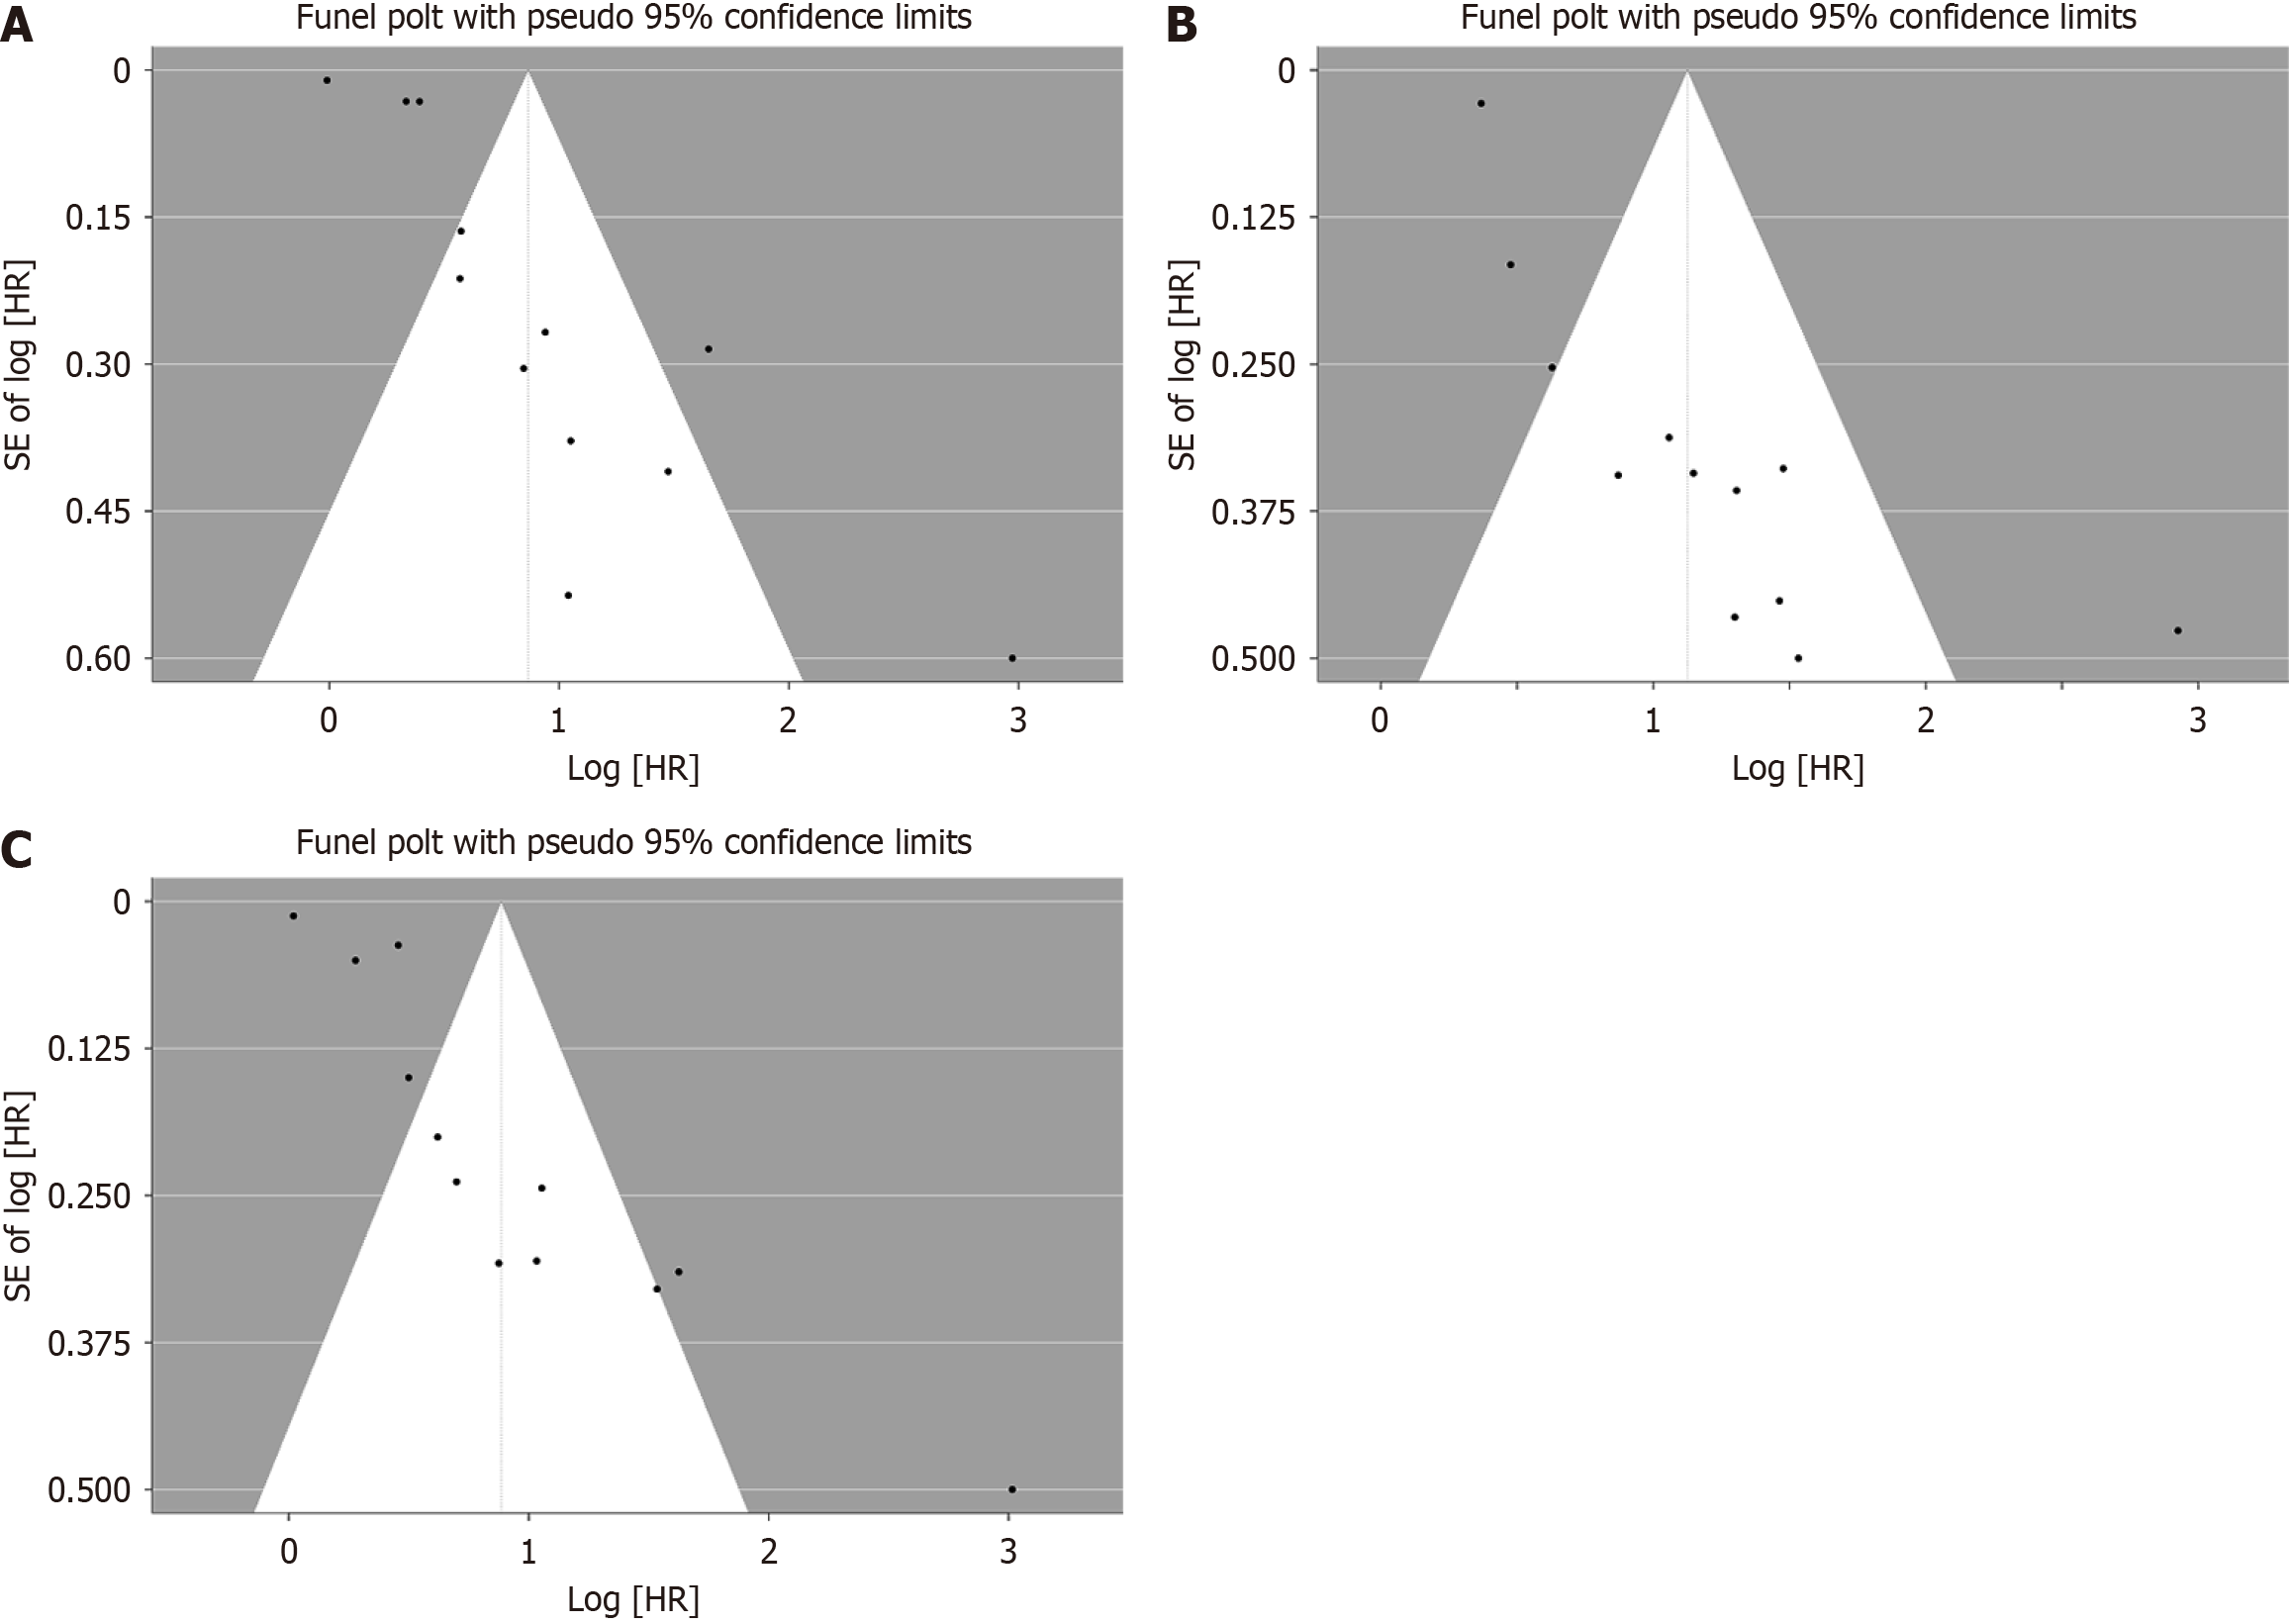
Figure 3 Begg’s plots.
A: Funnel plots showing association of positive lymph node ratio and overall survival; B: Funnel plots showing association of log odds of positive lymph nodes and overall survival; C: Funnel plots showing association of pathological lymph nodes and overall survival. HR: Hazard ratio.
Figure 4 Overall survival according to the different staging methods.
A: Positive lymph node ratio; B: Log odds of positive lymph nodes; C: Pathological lymph nodes; D: Relative survival difference rates among staging methods (lymph node ratio, log odds of positive lymph nodes, and pathological lymph nodes). Relative survival difference rates (LNR 0:1) = [(OS(LNR0) - OS(LNR1))/OS(LNR0)]. OS: Overall survival; LNR: Lymph node ratio; LODDS: Log odds of positive lymph nodes; pN: Pathological lymph nodes.
- Citation: Cheng M, Yu Y, Watanabe T, Yoshimoto Y, Kaji S, Yube Y, Kaneda M, Orita H, Mine S, Wu YY, Fukunaga T. Evaluation of three lymph node staging systems for prognostic prediction in gastric cancer: A systematic review and meta-analysis. World J Gastrointest Oncol 2025; 17(3): 98103
- URL: https://www.wjgnet.com/1948-5204/full/v17/i3/98103.htm
- DOI: https://dx.doi.org/10.4251/wjgo.v17.i3.98103


