Copyright
©The Author(s) 2025.
World J Gastrointest Oncol. Mar 15, 2025; 17(3): 102083
Published online Mar 15, 2025. doi: 10.4251/wjgo.v17.i3.102083
Published online Mar 15, 2025. doi: 10.4251/wjgo.v17.i3.102083
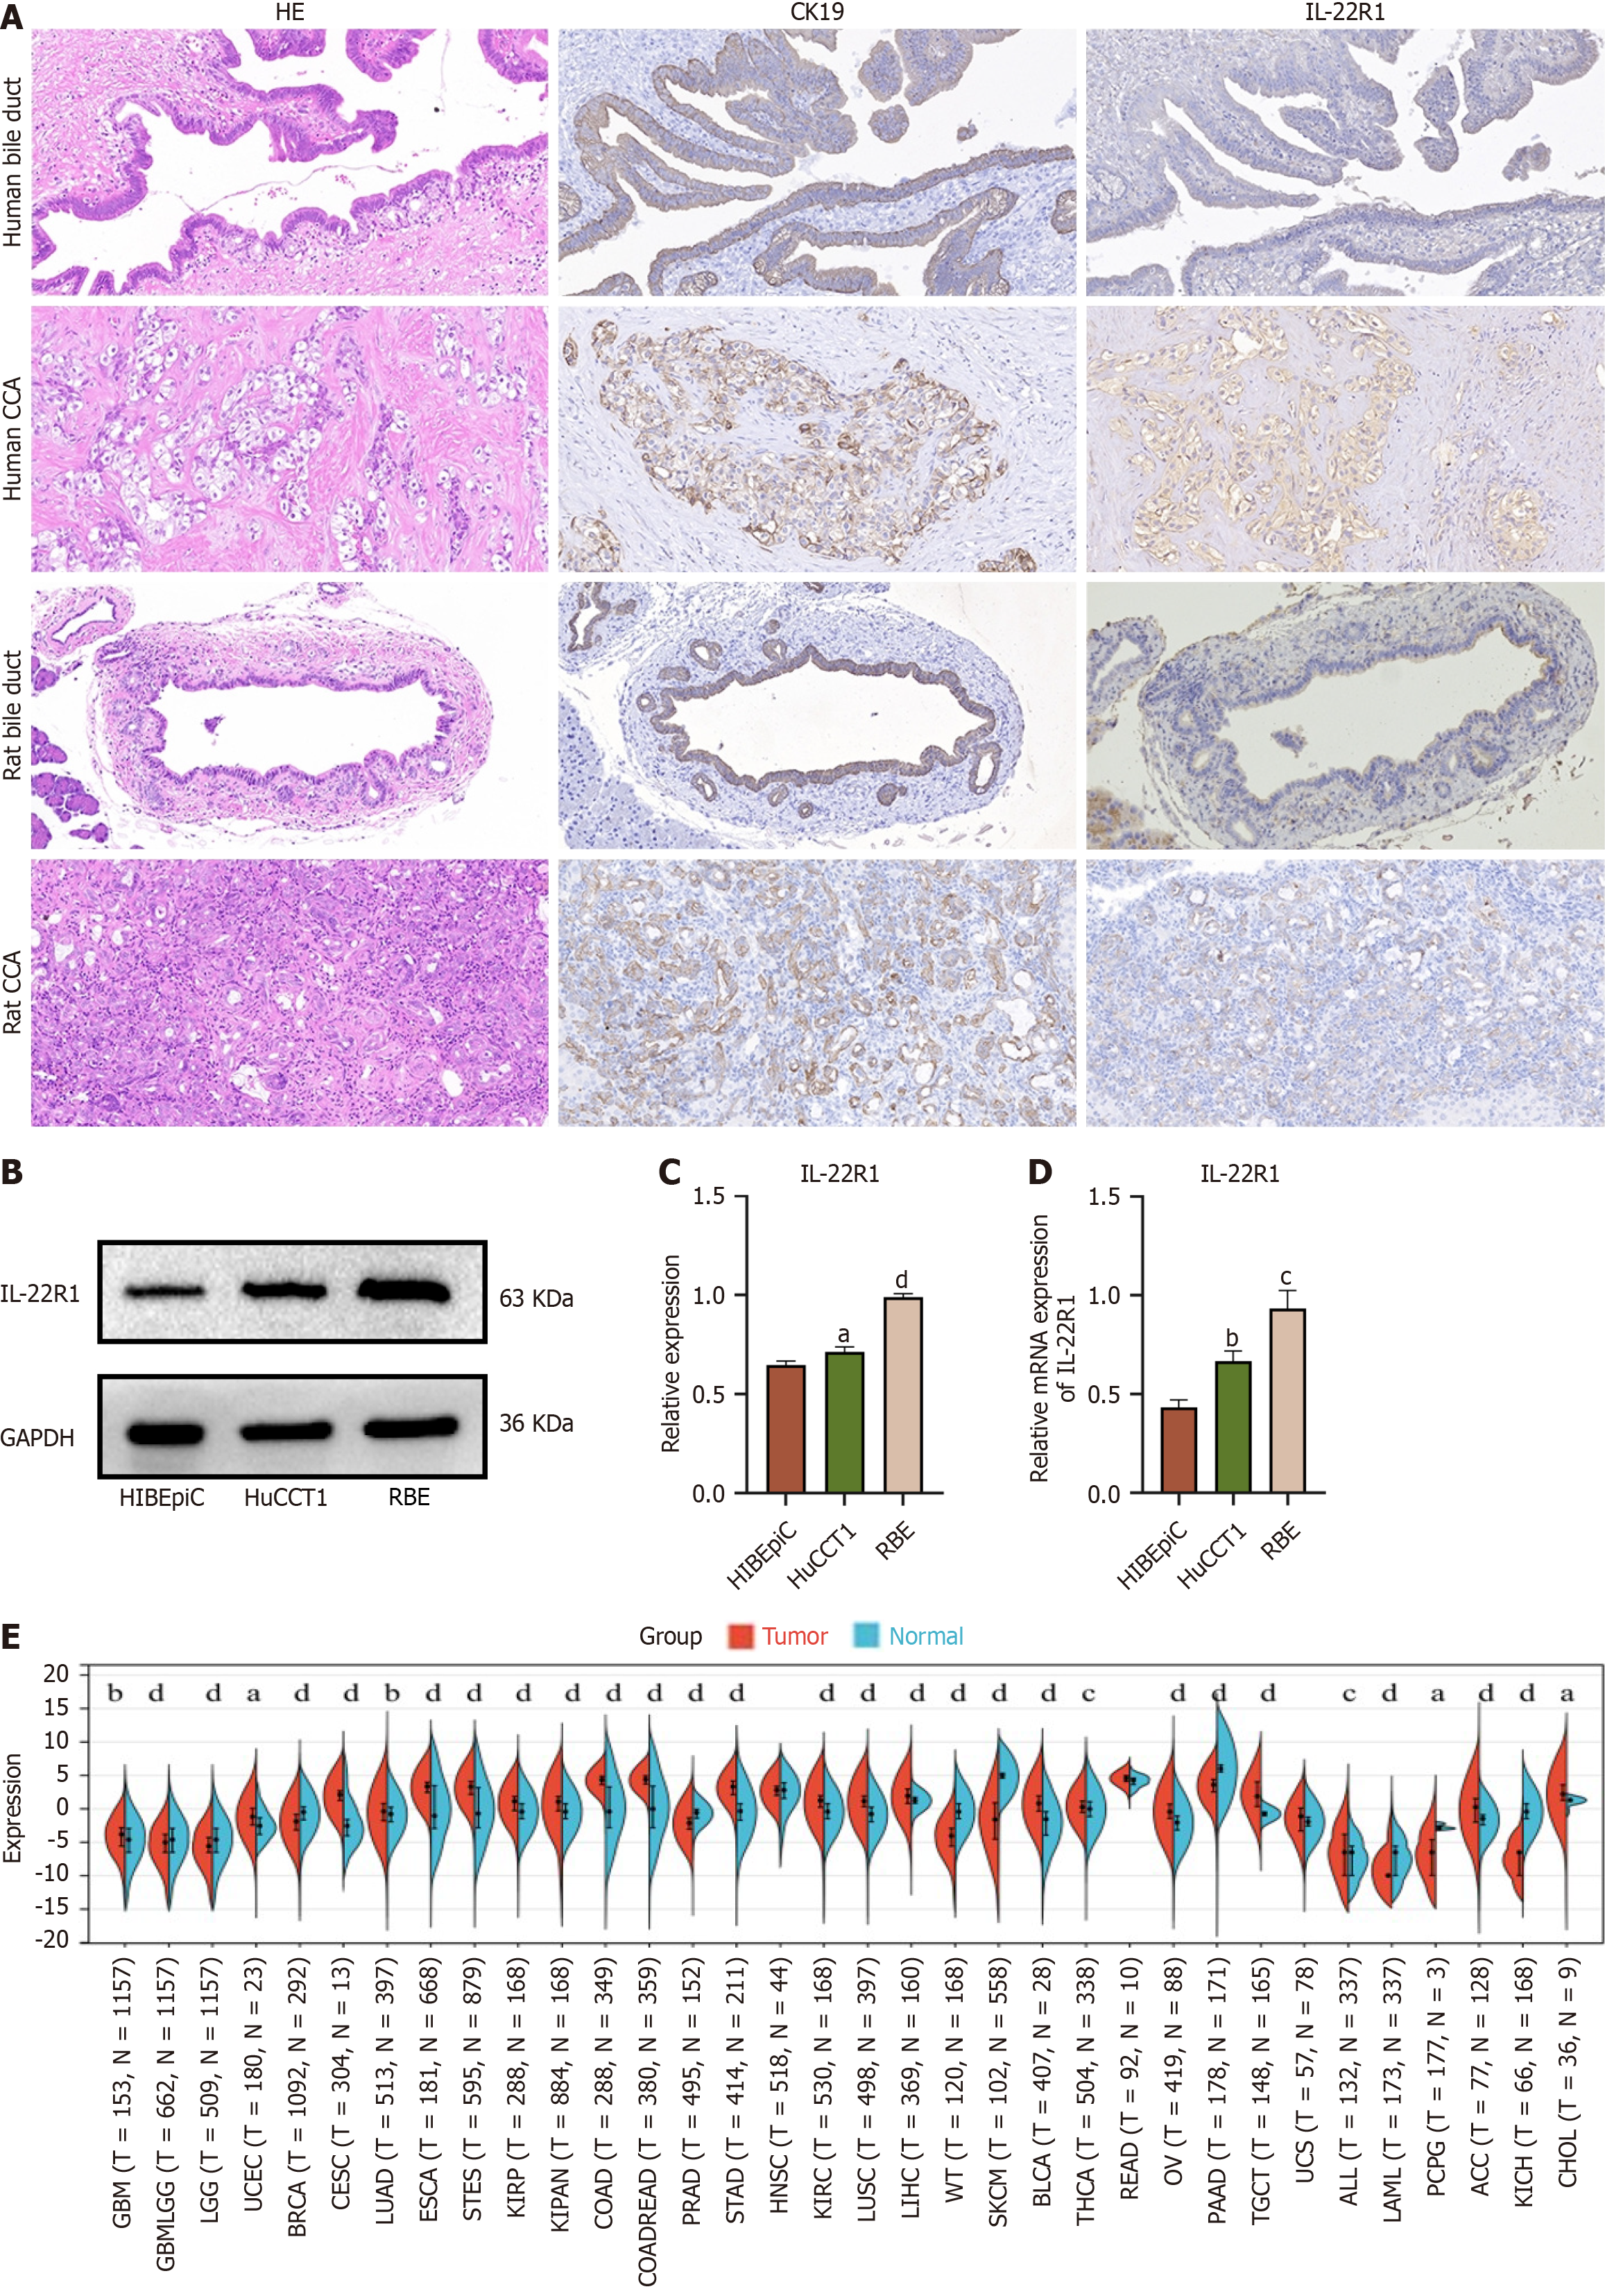
Figure 1 Aberrant expression of IL-22R1 in cholangiocarcinoma cell Lines, human and rat bile ducts, and cancer tissues.
A: Expression of IL-22R1 in human bile duct tissues and cholangiocarcinoma tissues (from left to right: HE staining, immunohistochemical results for CK19, immunohistochemical results for IL-22R1); Expression of IL-22R1 in rat bile duct tissues and cholangiocarcinoma tissues (TAA-induced; from left to right: HE staining, immunohistochemical results for CK19, immunohistochemical results for IL-22R1); B: Western blot analysis showing IL-22R1 expression in RBE, HuCCT1, and HIBEpiCs cells; C: Quantitative analysis of the relative expression of IL-22R1 in RBE, HuCCT1, and HIBEpiCs cells based on Western blot results. The expression in RBE and HuCCT1 is higher than that in HIBEpiCs cells; D: Quantitative analysis of the relative mRNA expression of IL-22R1 in RBE, HuCCT1, and HIBEpiCs cells. The expression in RBE and HuCCT1 is higher than that in HIBEpiCs cells; E: Expression of IL22R1 gene in various cancer samples extracted from the UCSC database. The expression in cholangiocarcinoma is higher than that in adjacent normal tissues. aP < 0.05, bP < 0.01, cP < 0.001, dP < 0.0001.
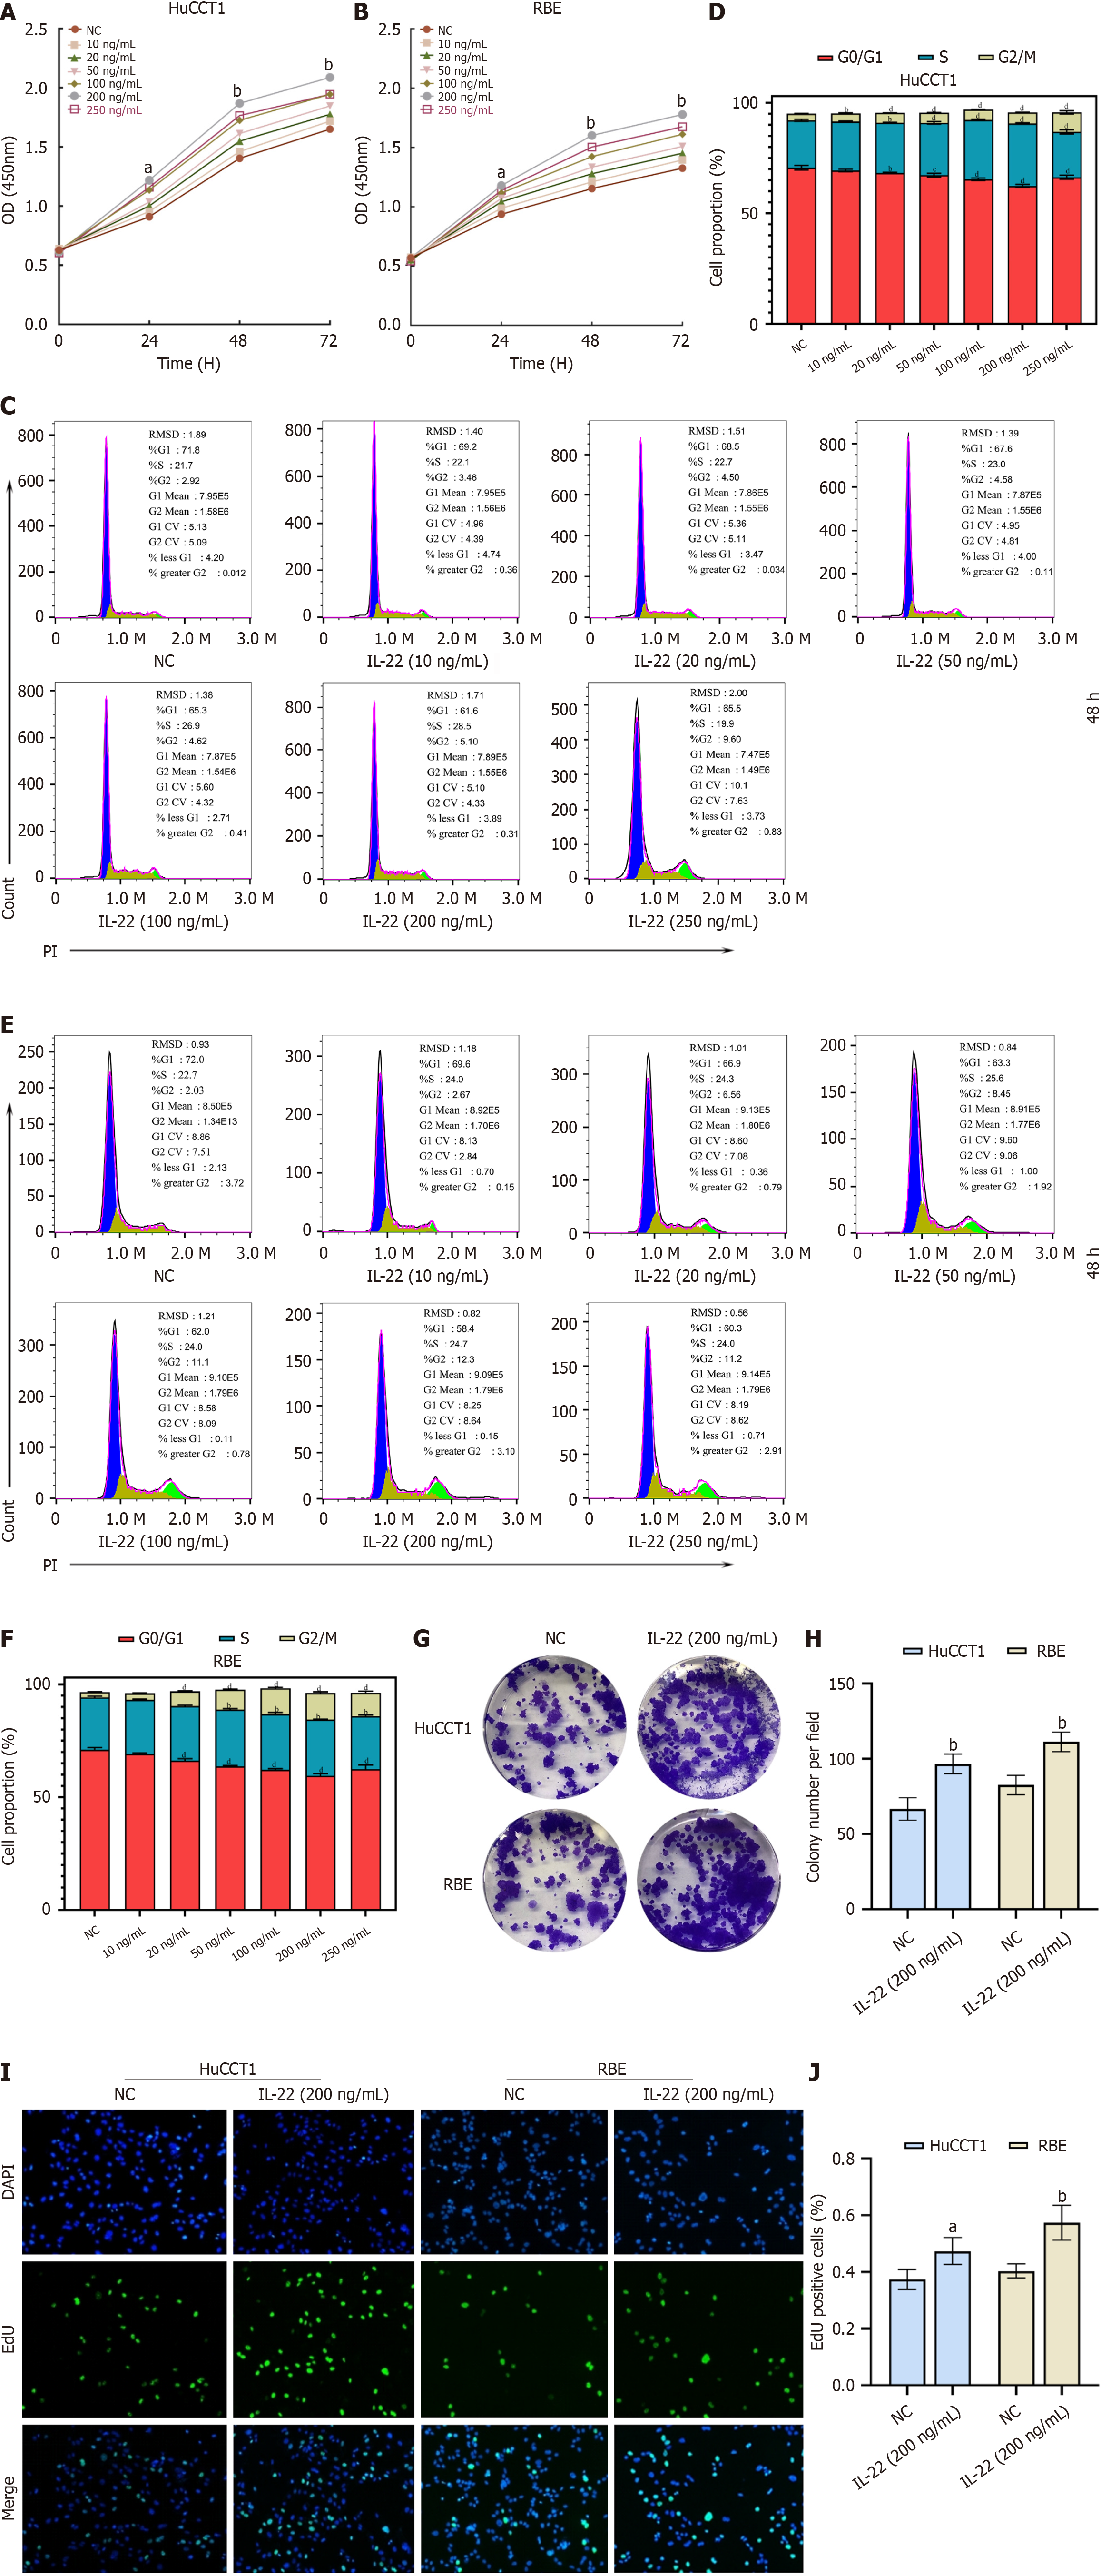
Figure 2 IL-22 promotes the proliferation of cholangiocarcinoma cells.
A: CCK8 proliferation curves of HuCCT1 cells stimulated with different concentrations of IL-22 at various time points; B: CCK8 proliferation curves of RBE cells stimulated with different concentrations of IL-22 at various time points; C: Flow cytometry cell cycle profiles of HuCCT1 cells after stimulation with different concentrations of IL-22 for 48 hours; D: Quantitative analysis results of the cell cycle assessment by flow cytometry; E: Flow cytometry cell cycle profiles of RBE cells after stimulation with different concentrations of IL-22 for 48 hours; F: Quantitative analysis results of the cell cycle assessment by flow cytometry; G and H: Colony formation and quantitative analysis results of HuCCT1 and RBE cells after stimulation with IL-22 at a concentration of 200 ng/mL; I and J: EdU incorporation and quantitative analysis results of HuCCT1 and RBE cells after stimulation with IL-22 at a concentration of 200 ng/mL. aP < 0.05, bP < 0.01. NC: Negative control.
Figure 3 IL-22 can resist apoptosis induced by nutrient deprivation and promote the migration and invasion of cholangiocarcinoma cells.
A: IL-22 (200 ng/mL) was applied to HuCCT1 and RBE cells for 48 hours, along with cells that were not treated with IL-22, followed by an overnight starvation. Flow cytometry was then used to detect the level of apoptosis and to perform quantitative analysis of the results; B: IL-22 (200ng/mL) was applied to HuCCT1 and RBE cells for 48 hours, along with cells that were not treated with IL-22, followed by an overnight starvation. Immunofluorescence TUNEL assay was employed to assess the level of apoptosis and to conduct quantitative analysis of the results; C: Transwell experiments were conducted to assess the changes in migration and invasion capabilities of HuCCT1 and RBE cells following IL-22(200 ng/mL) treatment, along with quantitative analysis of the results; D: Wound healing assays were performed to evaluate the migration ability of HuCCT1 and RBE cells treated with IL-22 (200 ng/mL), along with quantitative analysis of the results. aP < 0.05, bP < 0.01. NC: Negative control.
Figure 4 Results of transcriptomic sequencing and public database analysis.
A and B: GO enrichment analysis results of RNA-seq analysis; C and D: KEGG enrichment analysis results of RNA-seq analysis; E: Comparison of protein expression levels and quantitative analysis of p-ERK1/2, p-STAT3, BAX, and Bcl2 in HuCCT1 and RBE cells treated with IL-22 vs negative control group. aP < 0.05, bP < 0.01, cP < 0.001. NC: Negative control.
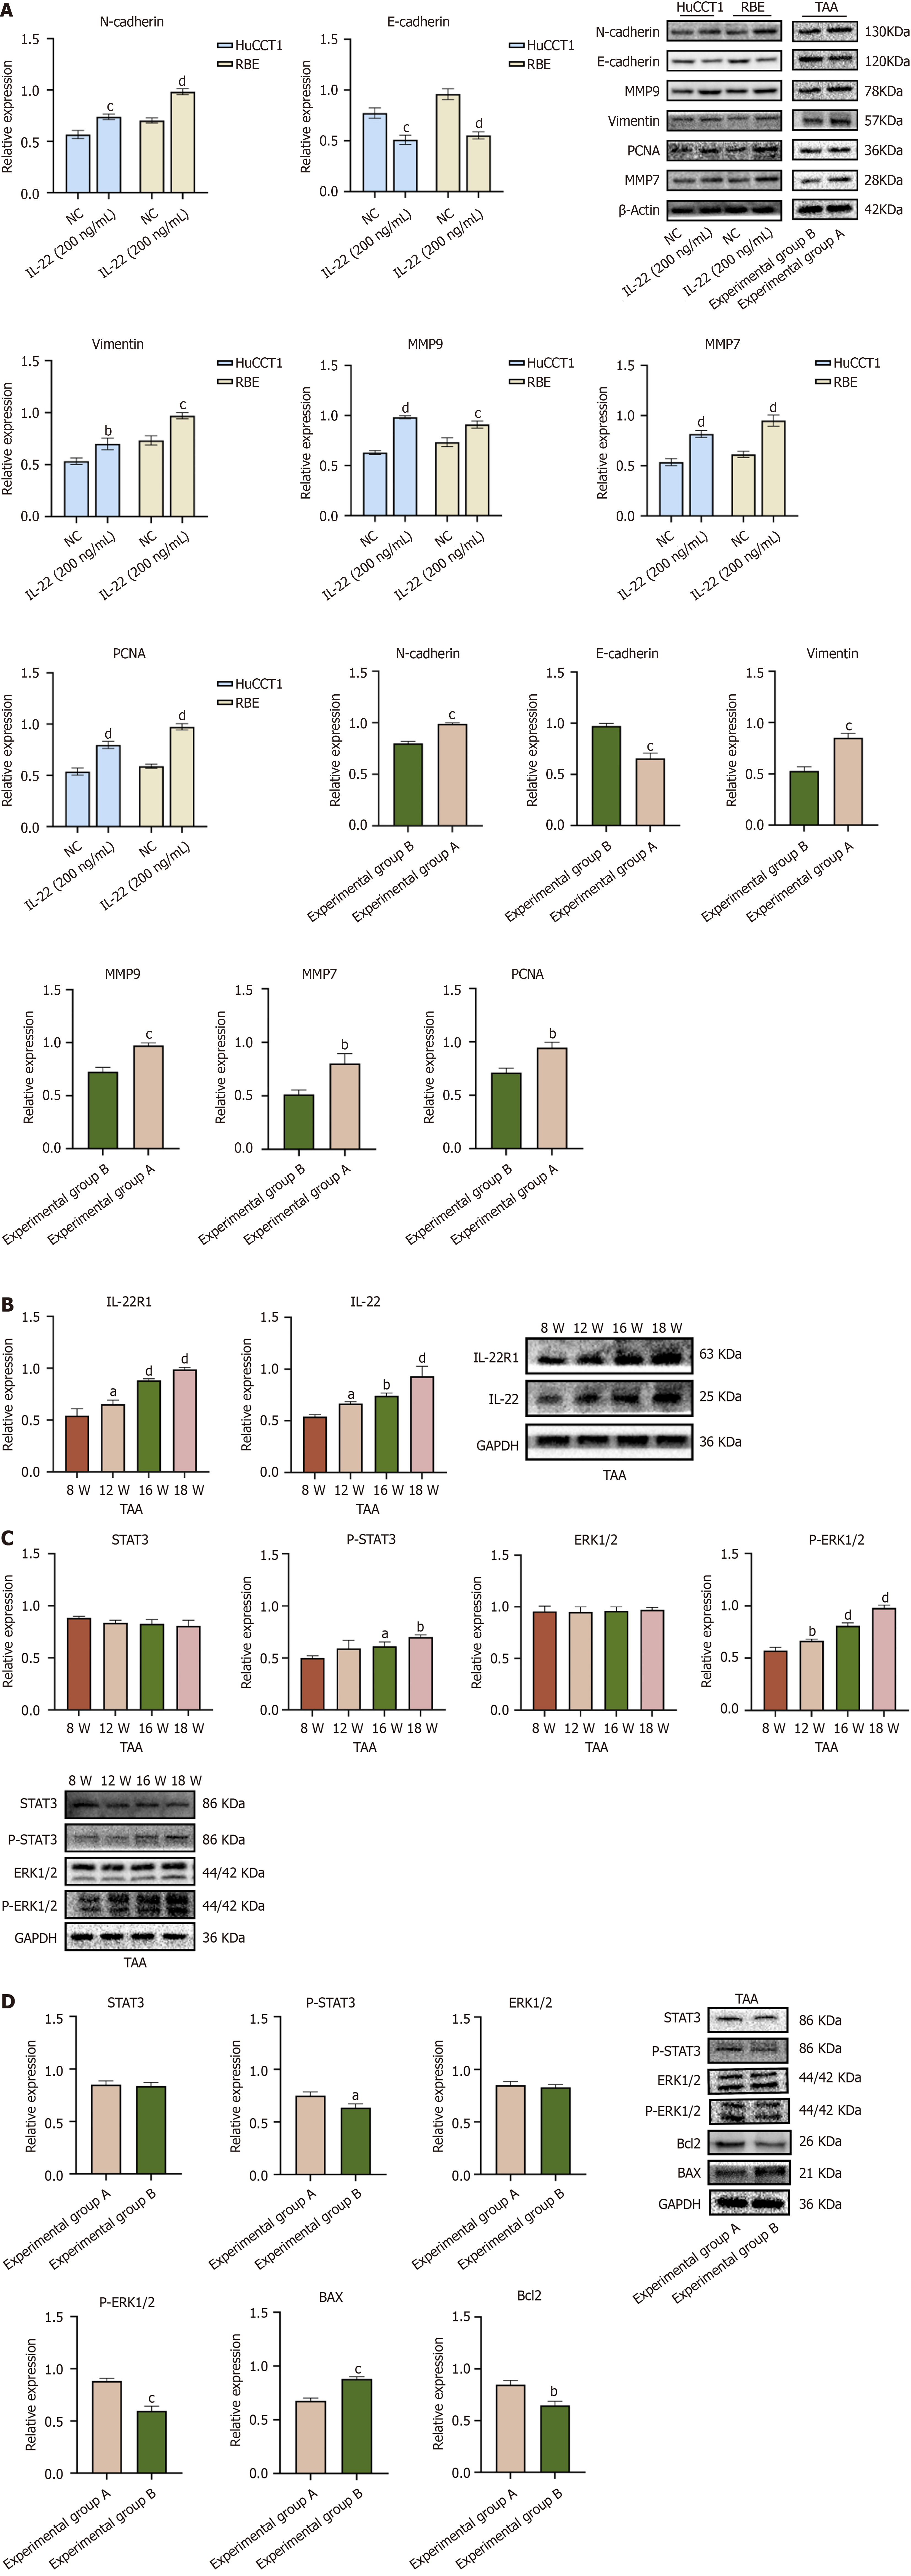
Figure 5 Protein expression levels in cholangiocarcinoma cells and tissues.
A: Western blot expression levels and quantitative analysis of related oncogenic proteins in HuCCT1 and RBE cells treated with IL-22 compared to the untreated group. Protein expression levels of related oncogenic proteins in thioacetamide (TAA) experimental groups A and B, along with the quantitative analysis results between the two groups; B: Western blot expression levels of IL-22 and IL-22R1 in liver tissues of rats at different time points following oral administration of TAA, and the Western blot quantitative analysis results comparing protein expression levels at each time point with those at the 8th week of TAA administration; C: Western blot expression levels of p-ERK1/2 and p-STAT3 in liver tissue proteins of rats administered TAA for different weeks, and the Western blot quantitative analysis results comparing protein expression levels at different weeks with those at the 8th week of TAA administration; D: Expression levels of p-ERK1/2, p-STAT3, BAX, and Bcl2 proteins in liver tissue proteins of rats in TAA experimental groups A and B, as well as the statistical results of the quantitative analysis of these proteins between the two groups. aP < 0.05, bP < 0.01, cP < 0.001, dP < 0.0001. NC: Negative control; TAA: Thioacetamide.
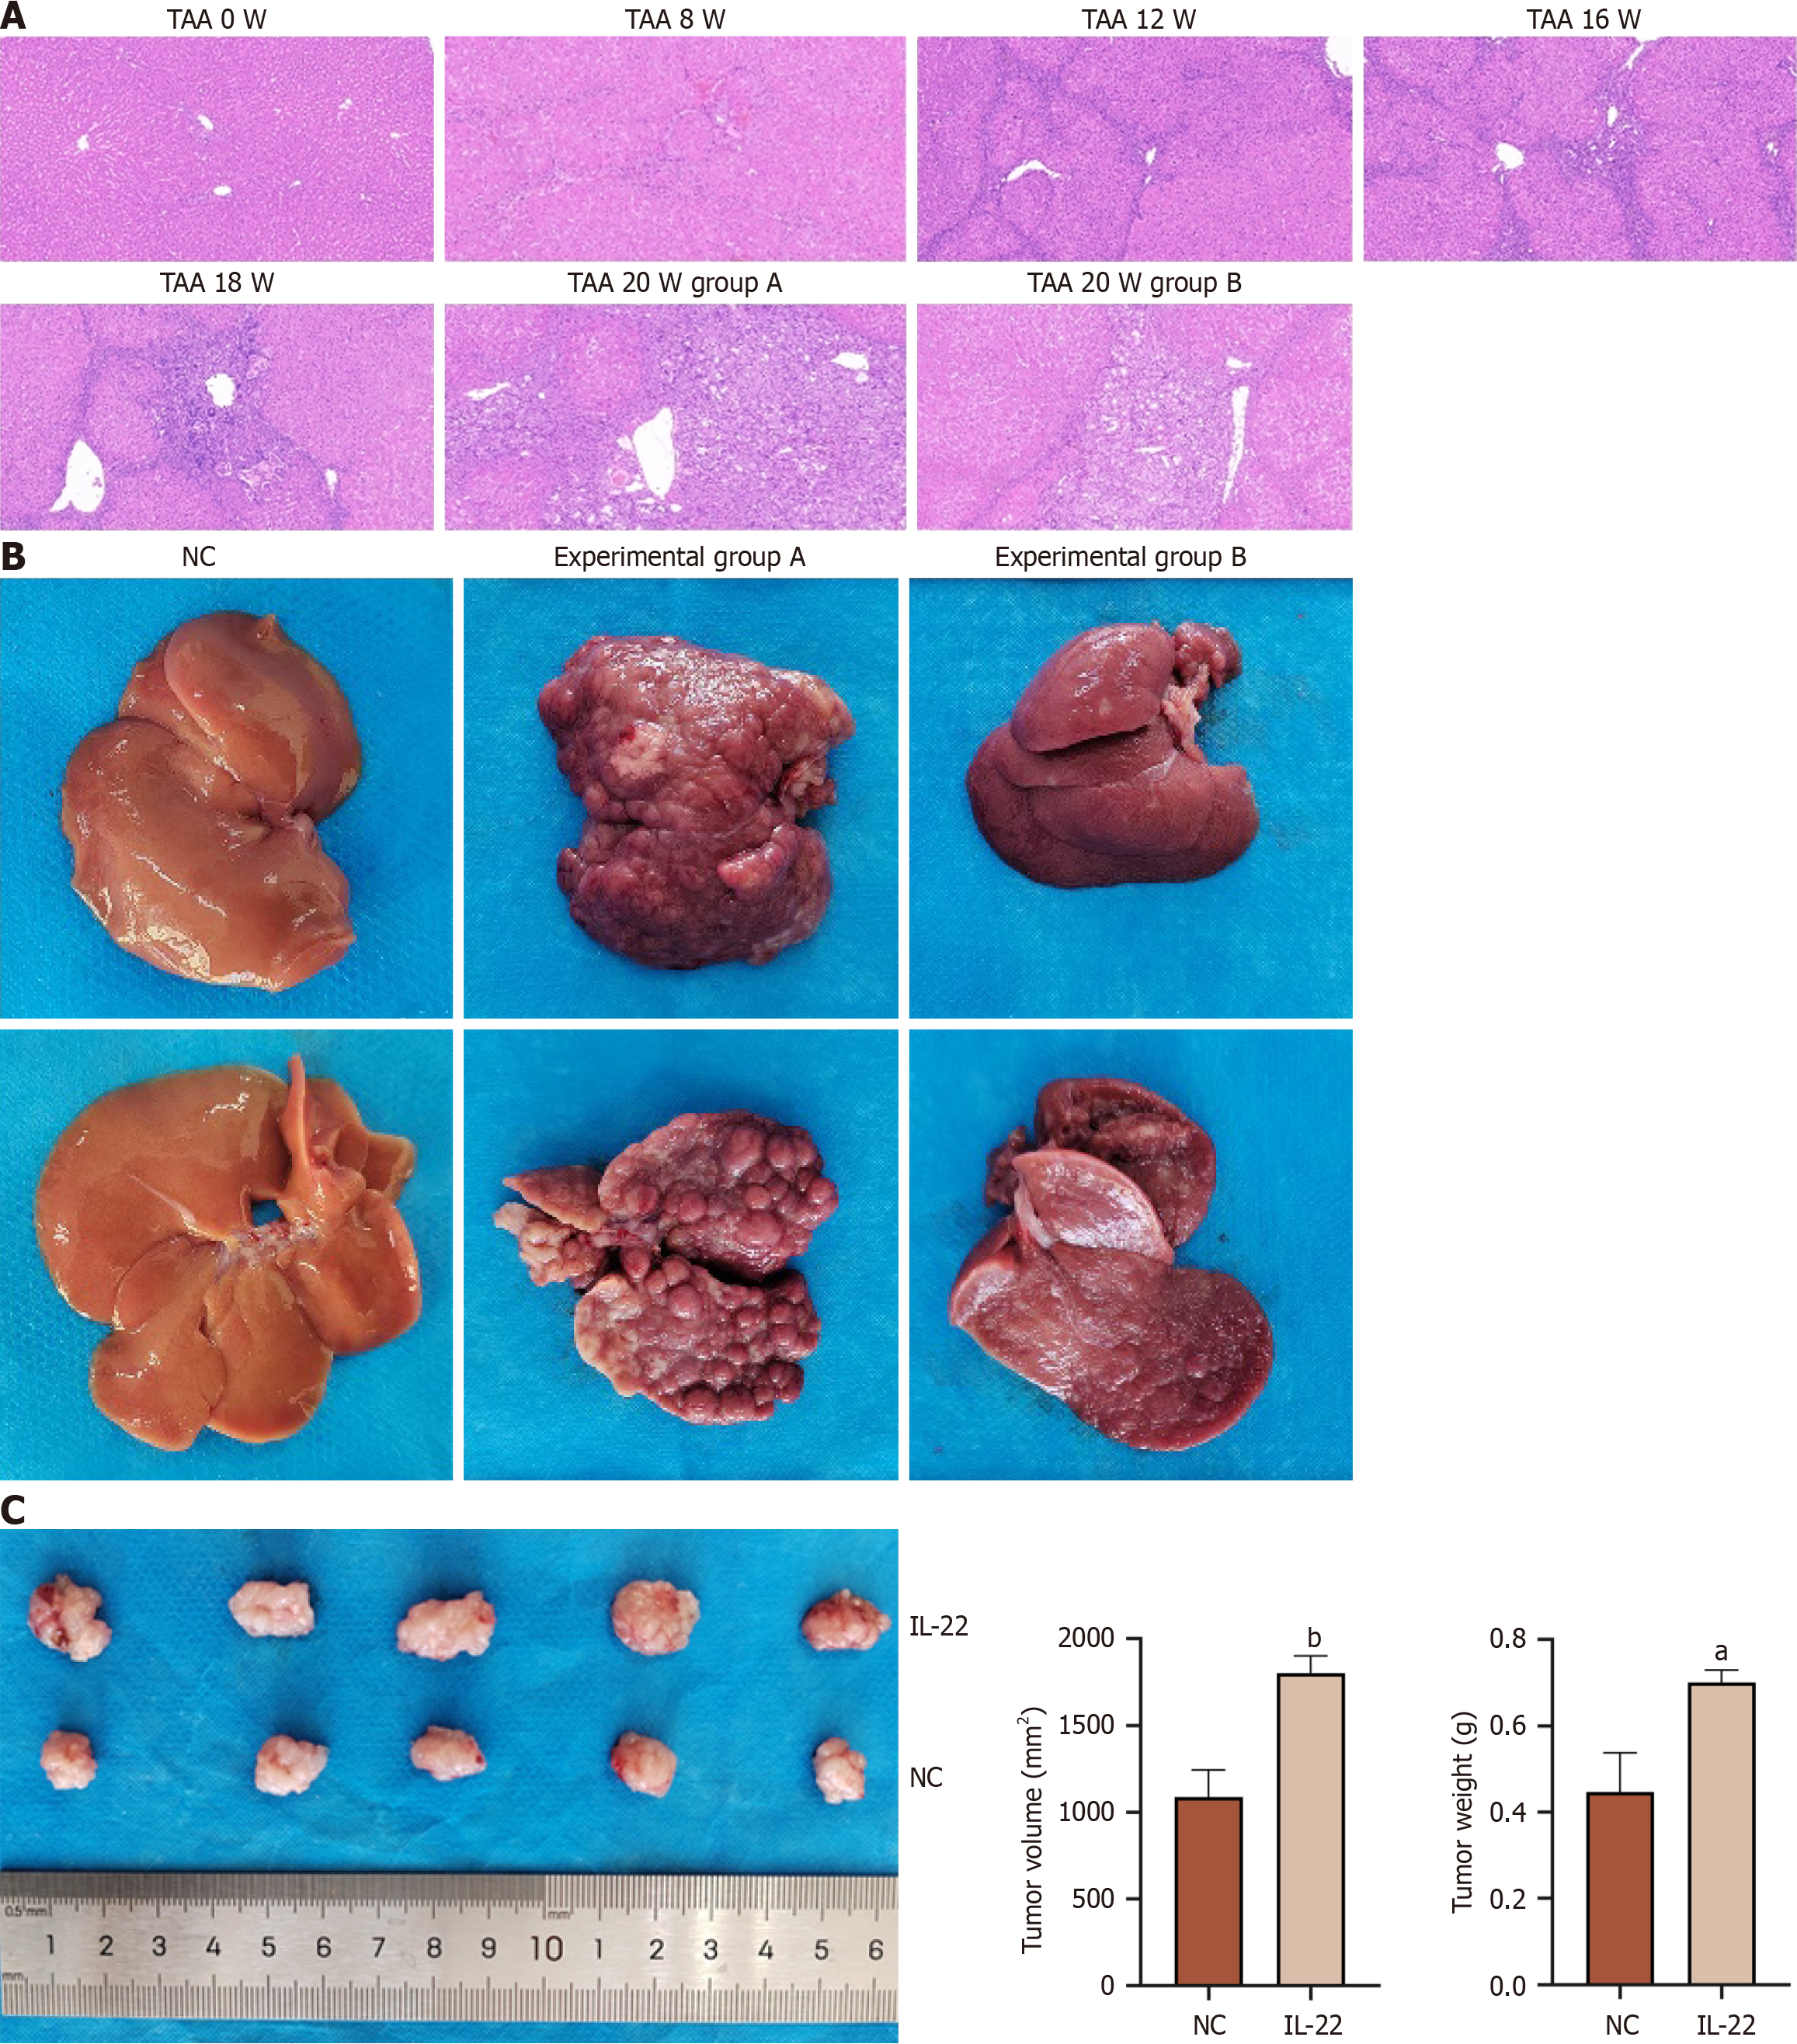
Figure 6 IL-22 promotes the progression of cholangiocarcinoma in in vivo experiments.
A: HE staining of liver tissue in rats administered thioacetamide for different weeks; B: Gross specimen images of liver tissues from negative control group, experimental group A, and experimental group B; C: Representative images of subcutaneous tumor samples in nude mice xenografts, with statistical analysis of tumor weight and tumor volume among samples. aP < 0.01, bP < 0.001. NC: Negative control; TAA: Thioacetamide.
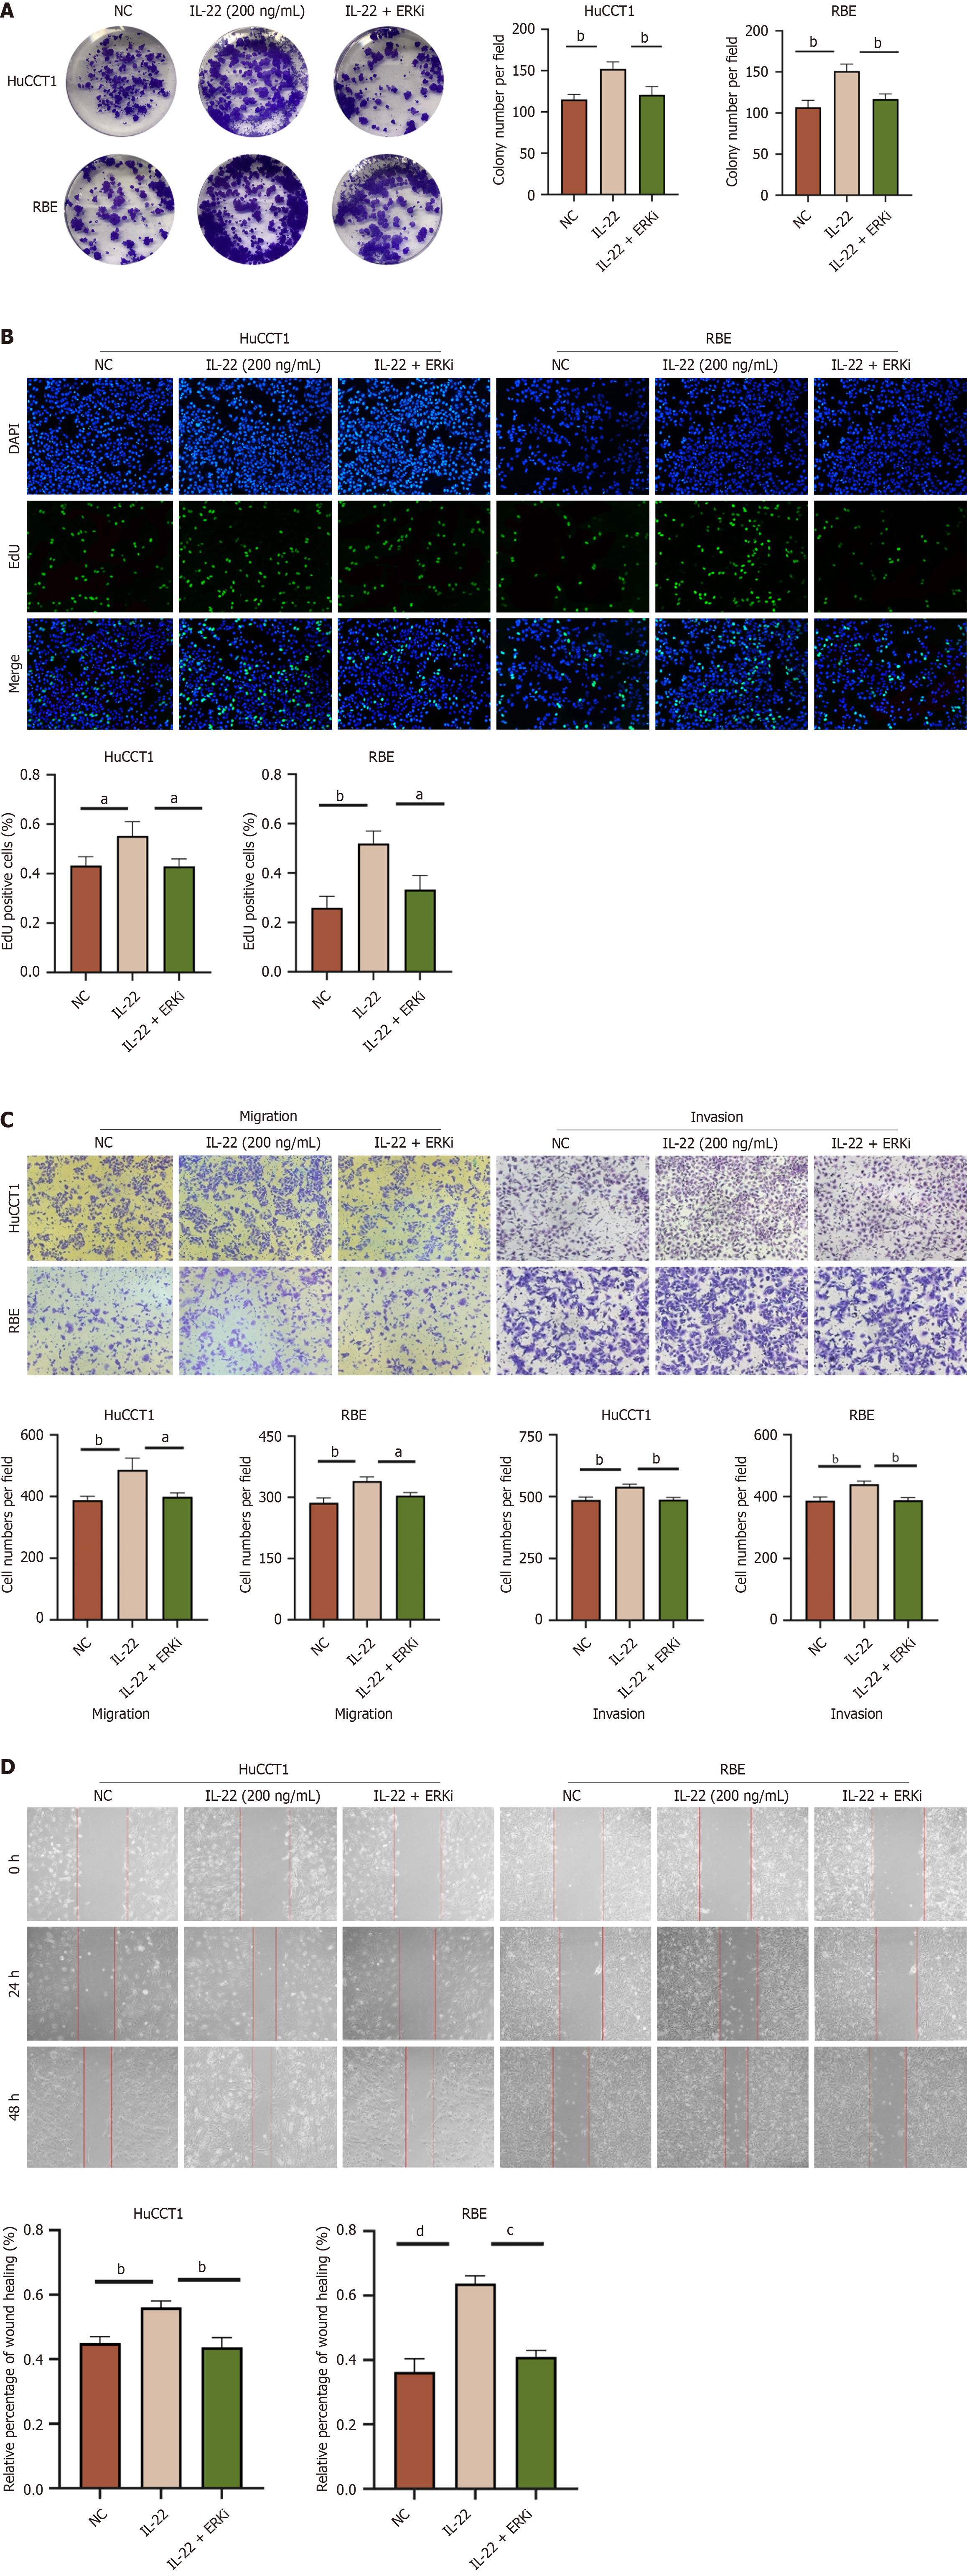
Figure 7 The ERK inhibitor can block the effects of IL-22 on the proliferation, migration, and invasion of cholangiocarcinoma cells.
A: The images of colony formation of HuCCT1 and RBE cells after different treatments and the results of quantitative analysis comparing each group; B: EdU staining images of HuCCT1 and RBE cells from different treatment groups, along with quantitative analysis results comparing each group; C: Migration and invasion images of HuCCT1 and RBE cells from different treatment groups, along with the results of quantitative analysis comparing each group; D: Wound healing images of HuCCT1 and RBE cells from different treatment groups, along with the results of quantitative analysis comparing each group. aP < 0.05, bP < 0.01, cP < 0.001, dP < 0.0001. NC: Negative control.
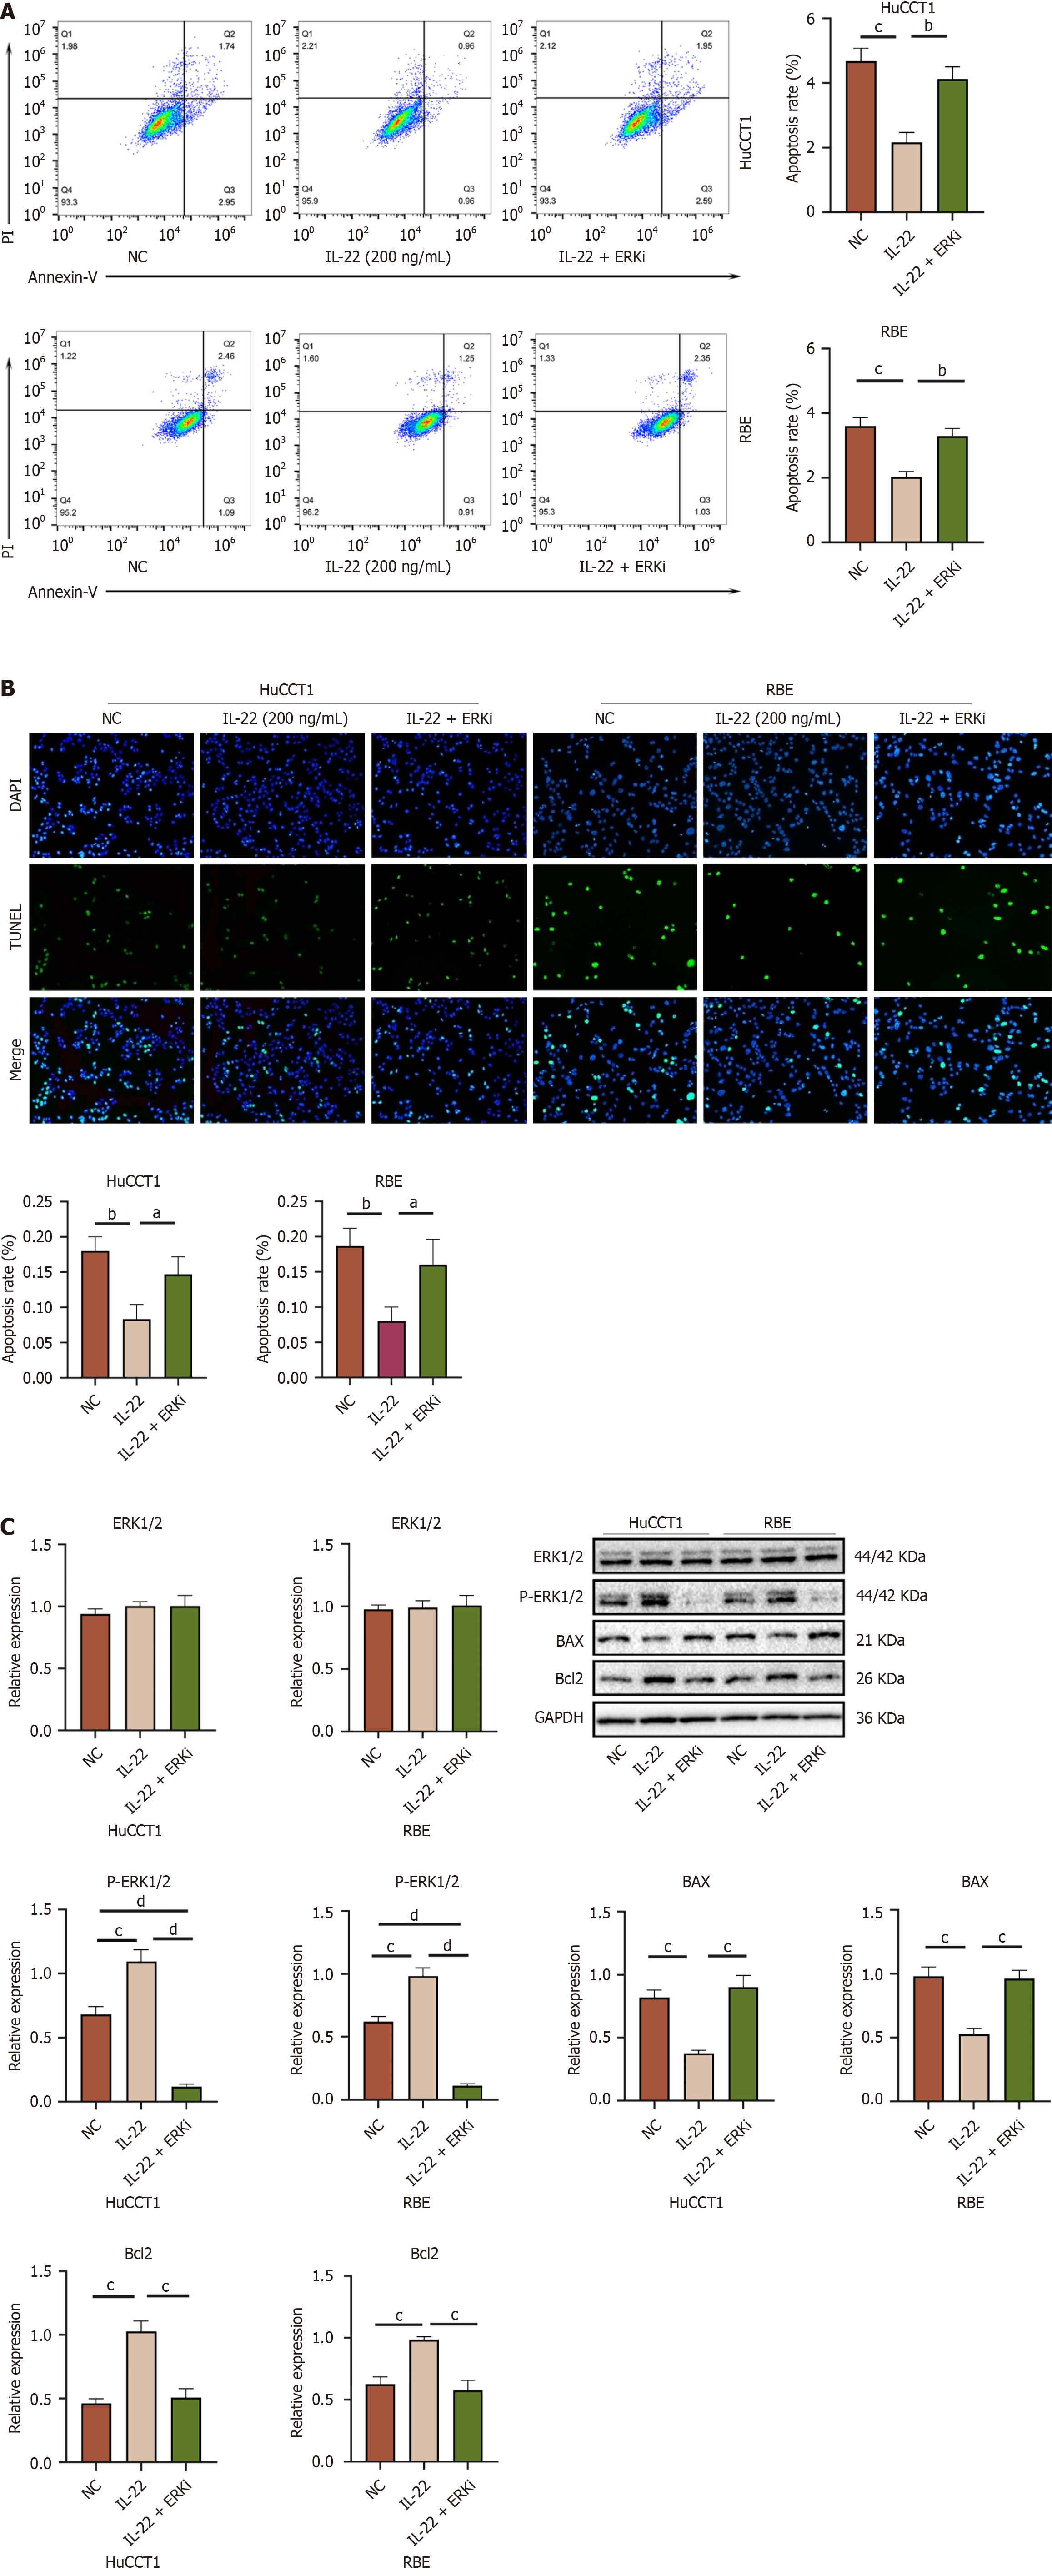
Figure 8 The ERK inhibitor can block the effects of IL-22 on the anti-apoptotic capacity of cholangiocarcinoma cells.
A: Flow cytometry apoptosis images of HuCCT1 and RBE cells from different treatment groups, along with the results of quantitative analysis comparing each group; B: TUNEL assay images of HuCCT1 and RBE cells from different treatment groups, along with the results of quantitative analysis comparing each group; C: Western blot images of P-ERK1/2, BAX, and Bcl2 in HuCCT1 and RBE cells from different treatment groups, along with the analysis results of Western blot quantification comparing the groups. aP < 0.05, bP < 0.01, cP < 0.001, dP < 0.0001. NC: Negative control.
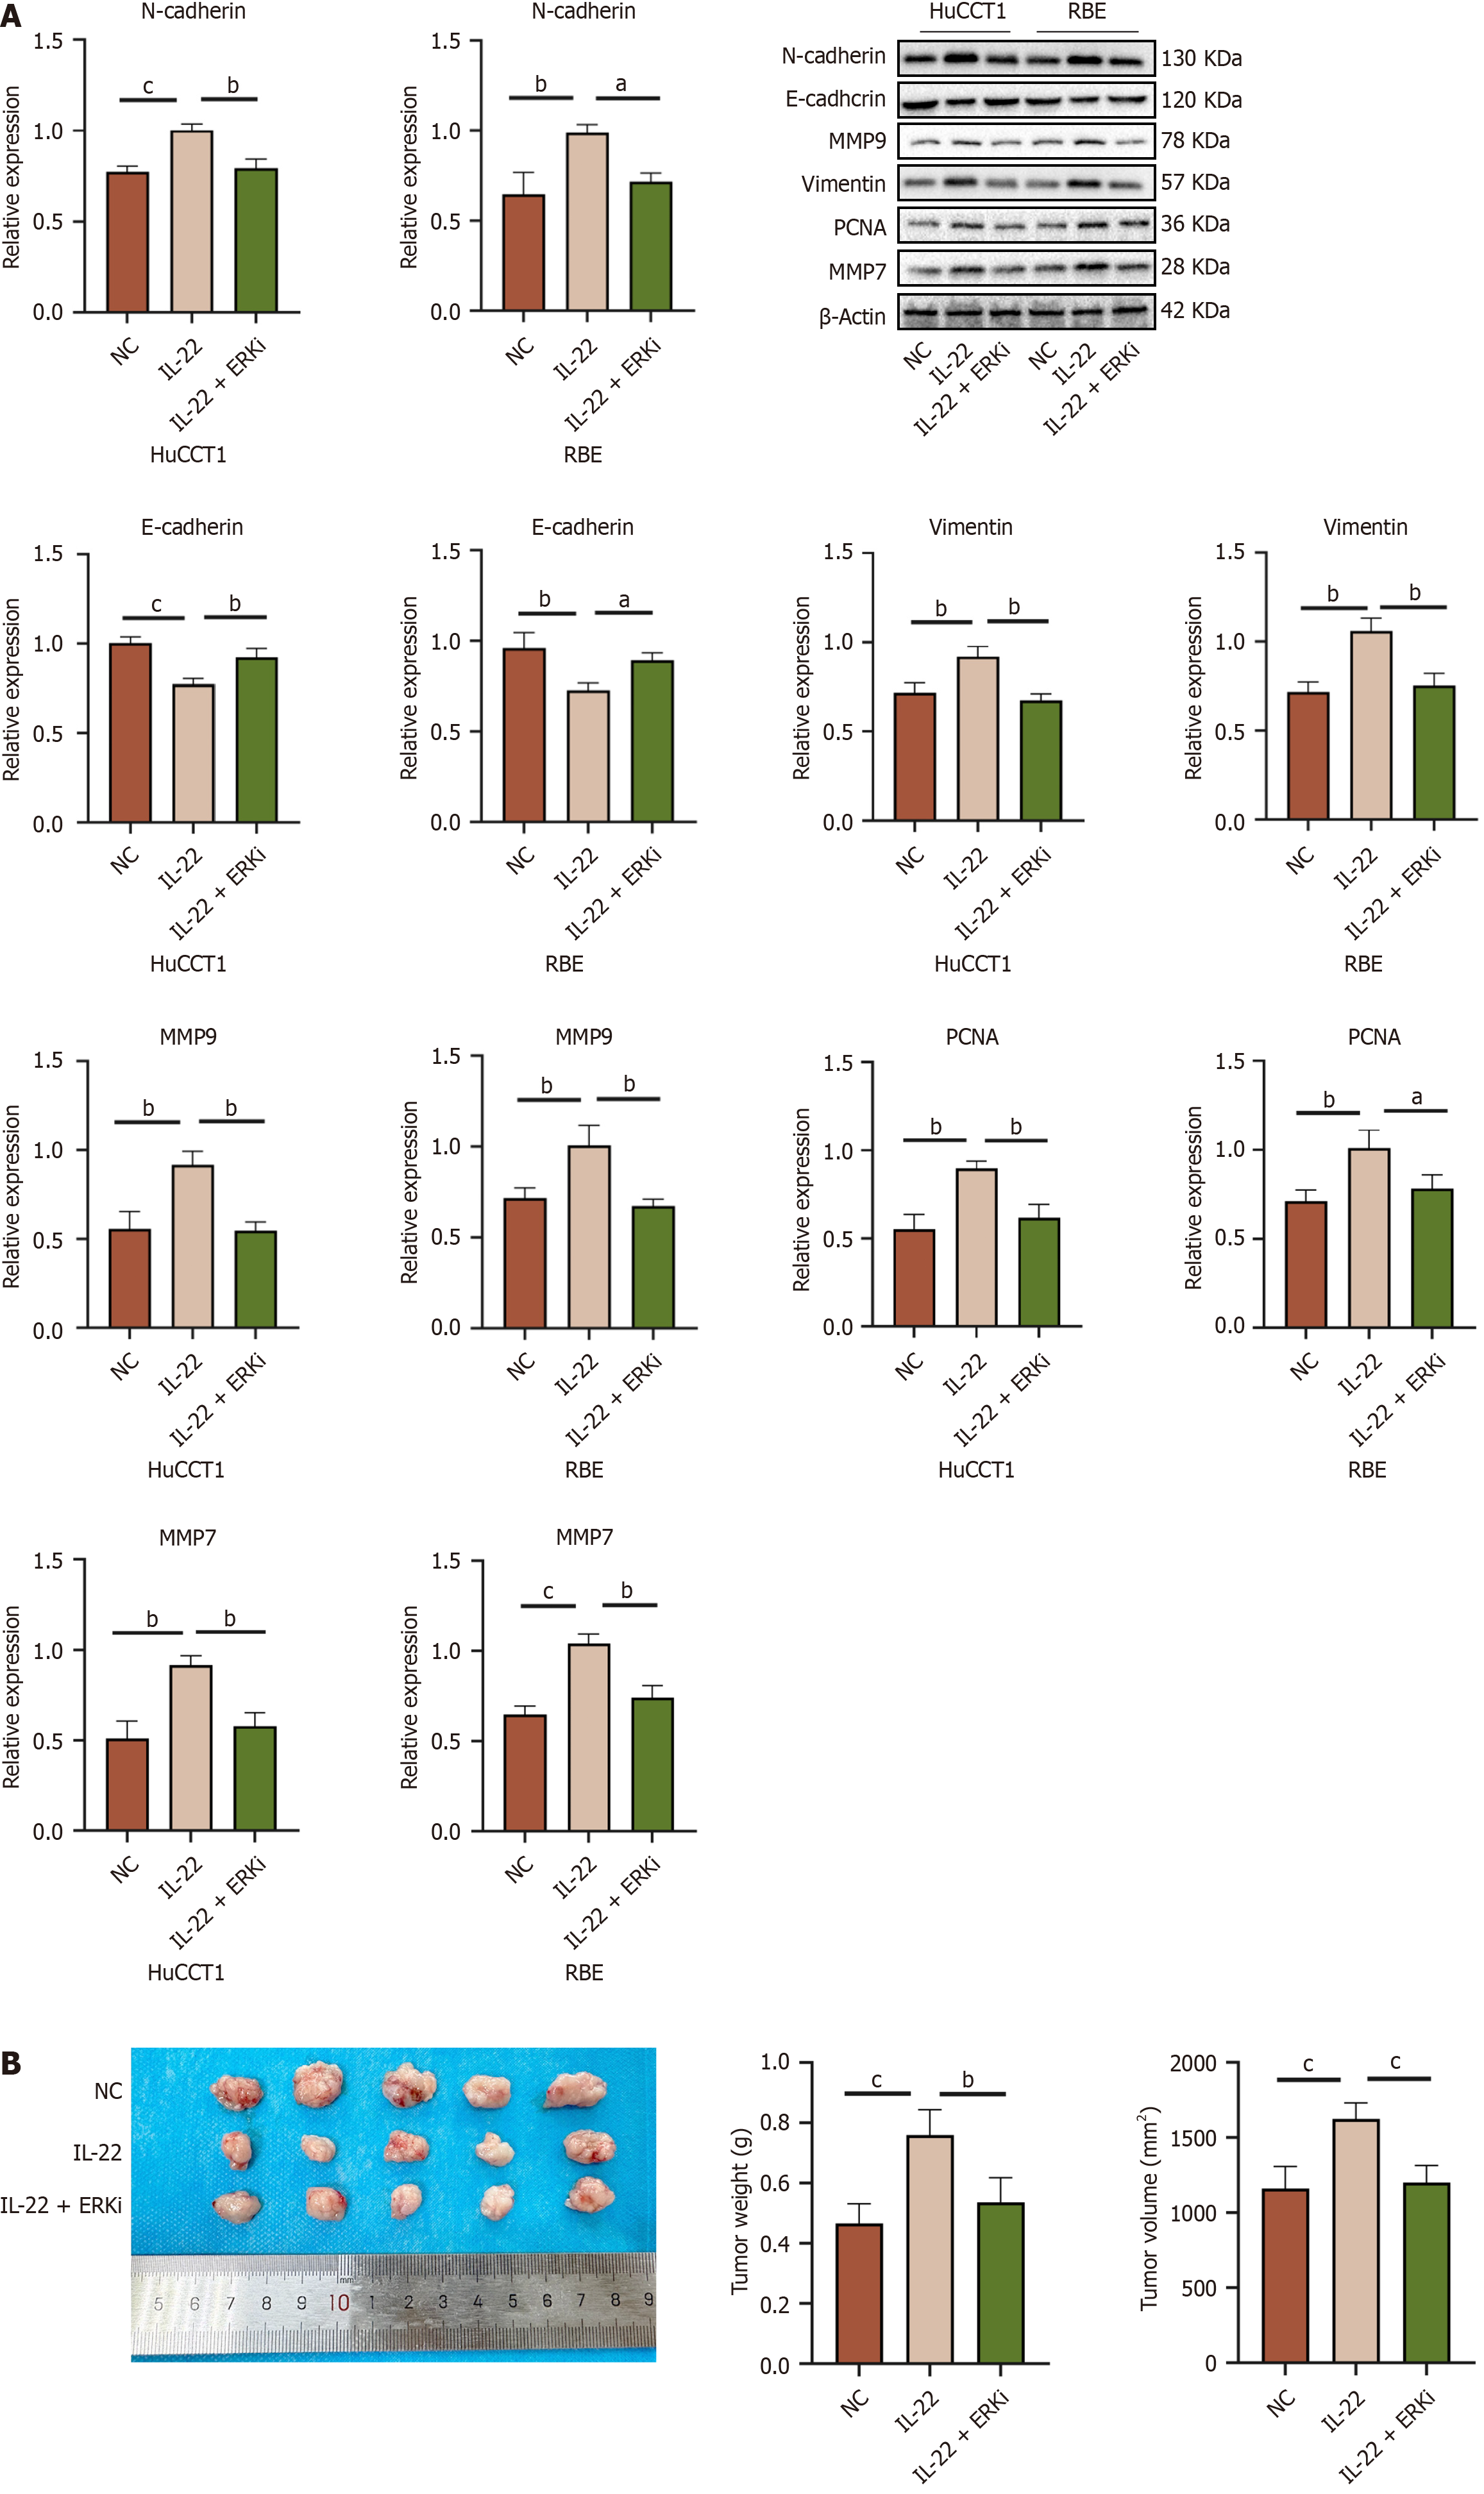
Figure 9 Protein expression levels and in vivo tumor growth of cholangiocarcinoma cells following ERK inhibitor treatment.
A: Western blot expression levels of related oncogenic proteins in HuCCT1 and RBE cells from different treatment groups, along with the results of quantitative analysis of Western blot among the groups; B: Representative images of subcutaneous xenograft tumor tissue samples from nude mice in different treatment groups, along with quantitative analysis results of tumor weight and volume. aP < 0.05, bP < 0.01, cP < 0.001. NC: Negative control.
- Citation: Zhou J, Chen JR, Li JM, Han SQ, Deng XY, Li ZM, Tong W, Wang C, Bai Y, Zhang YM. IL-22/IL-22R1 pathway enhances cholangiocarcinoma progression via ERK1/2 activation. World J Gastrointest Oncol 2025; 17(3): 102083
- URL: https://www.wjgnet.com/1948-5204/full/v17/i3/102083.htm
- DOI: https://dx.doi.org/10.4251/wjgo.v17.i3.102083


