Copyright
©The Author(s) 2025.
World J Gastrointest Oncol. Feb 15, 2025; 17(2): 96230
Published online Feb 15, 2025. doi: 10.4251/wjgo.v17.i2.96230
Published online Feb 15, 2025. doi: 10.4251/wjgo.v17.i2.96230
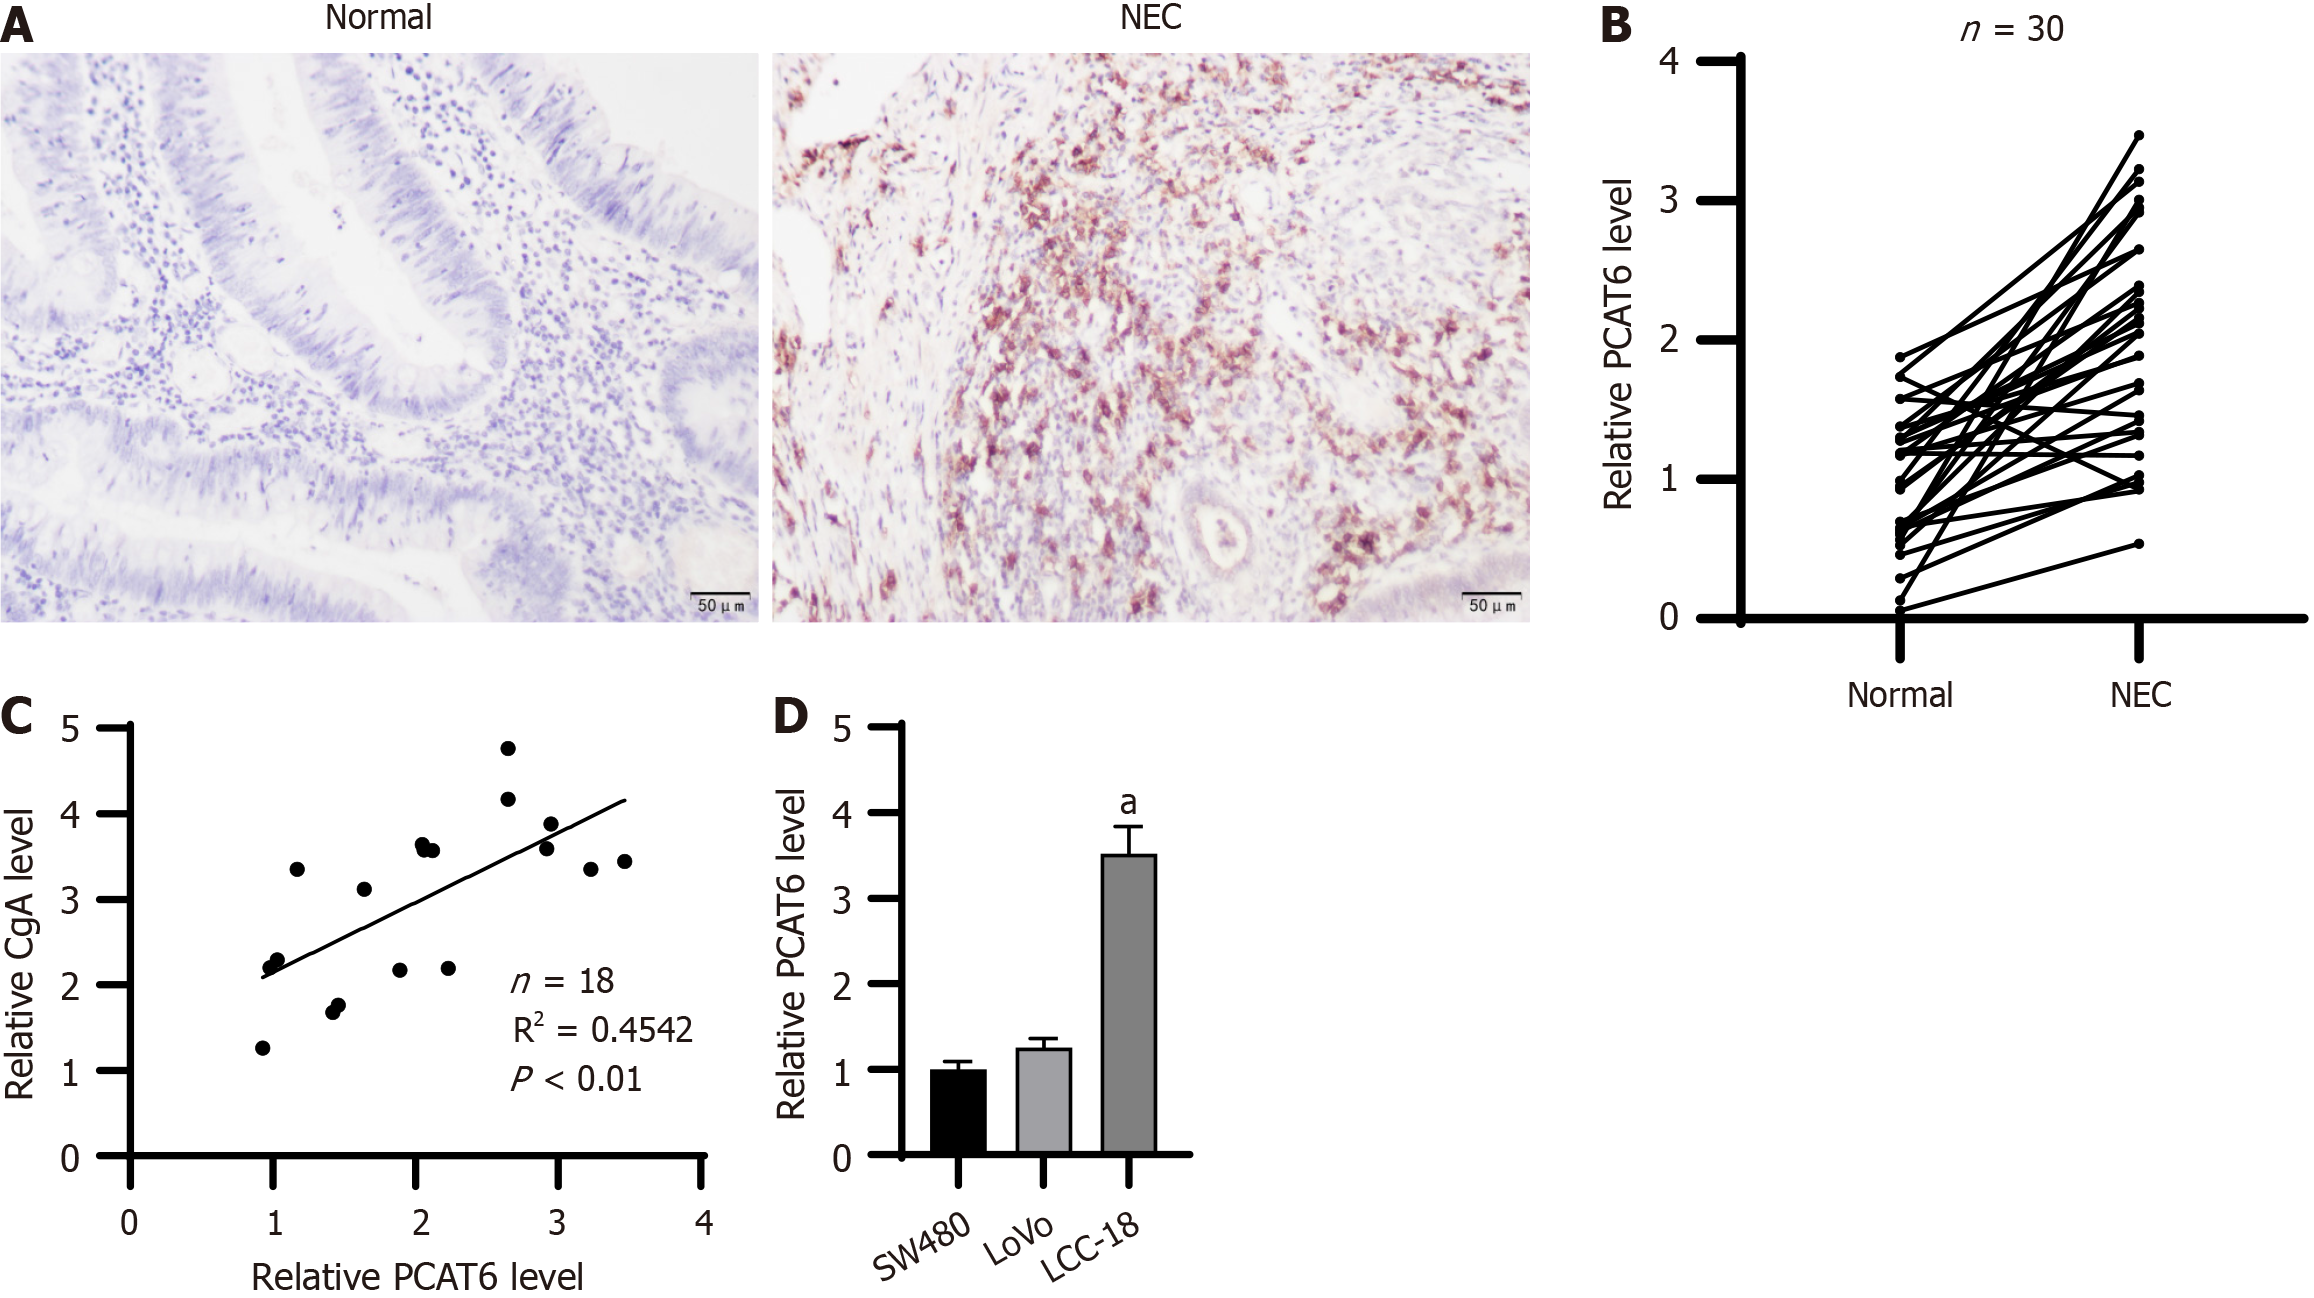
Figure 1 Prostate cancer associated transcript 6 is highly expressed in neuroendocrine carcinomas tissues and cells.
A: Immunohisto
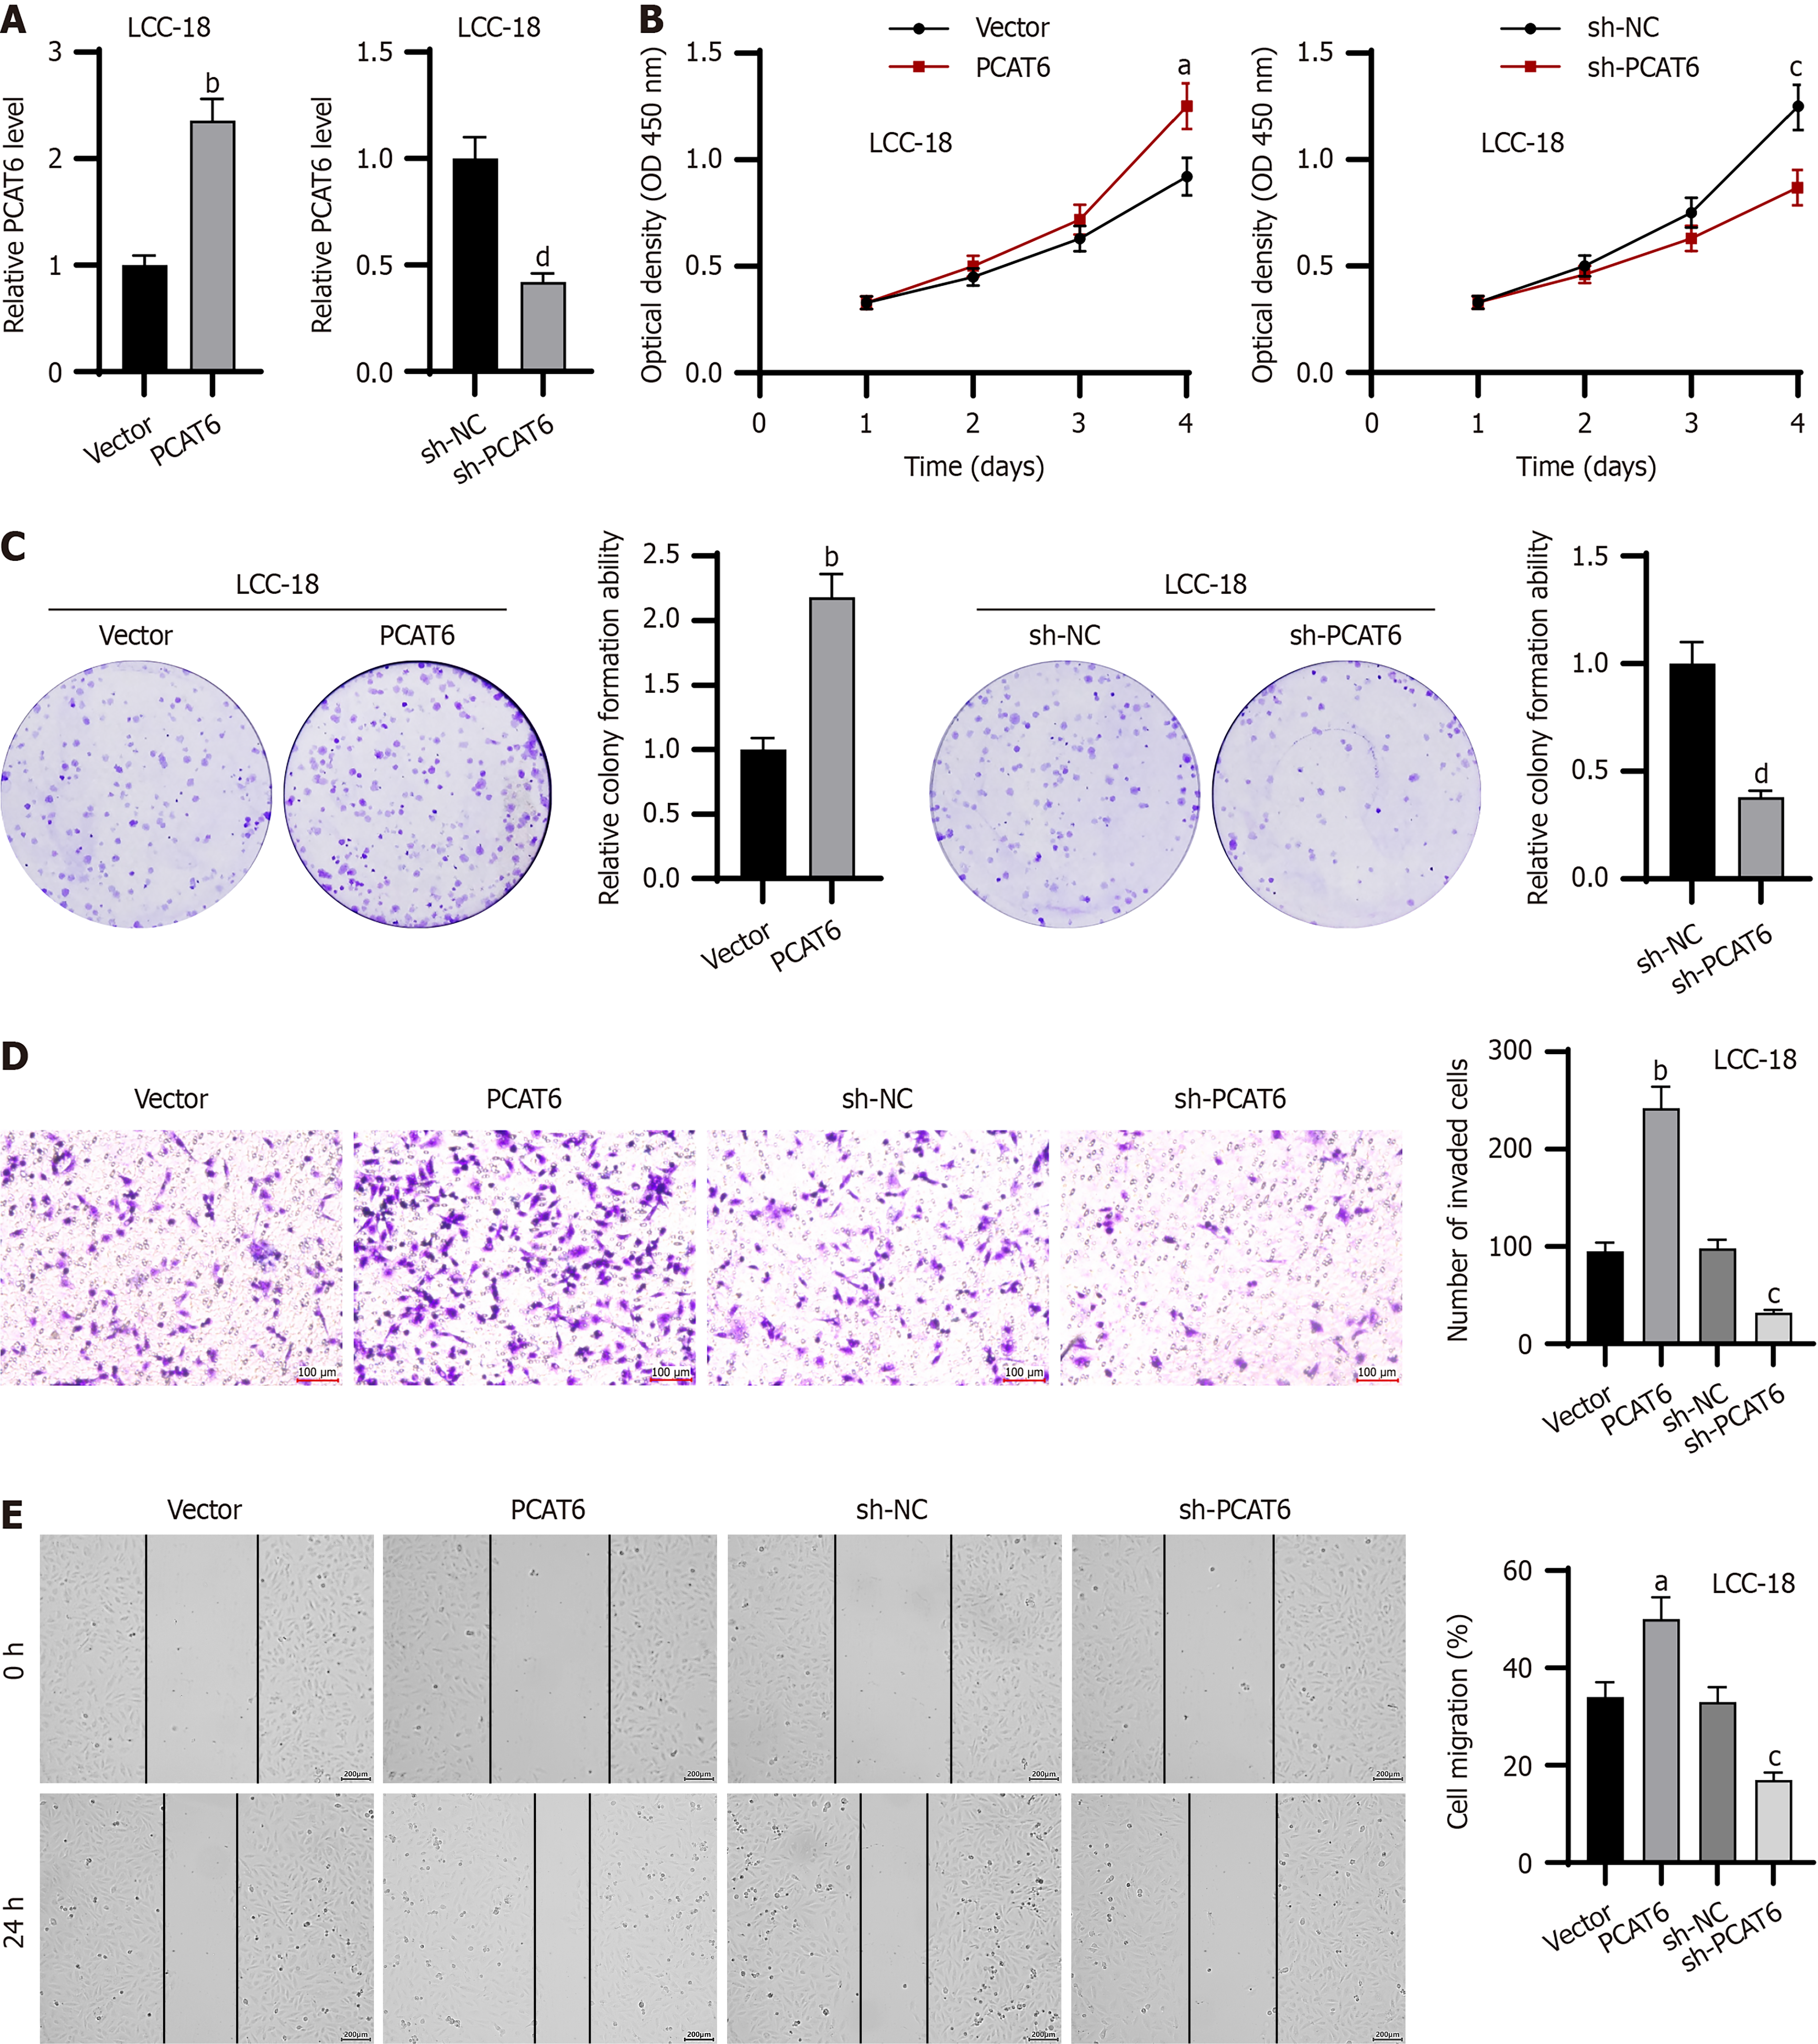
Figure 2 Prostate cancer associated transcript 6 promotes the proliferation, migration, and invasion of neuroendocrine carcinomas cells.
A: The transfection efficiency was verified by real-time quantitative polymerase chain reaction; B: CCK-8 assays of cell viability; C: Colony formation ability of LCC-18 cells transfected with prostate cancer associated transcript 6 (PCAT6) overexpression vector or PCAT6 shRNA; D: Transwell assays of cell invasion; E: Wound healing assays of cell migration. aP < 0.01, bP < 0.001 vs vector group; cP < 0.01, dP < 0.001 vs sh-NC group. PCAT6: Prostate cancer associated transcript 6.
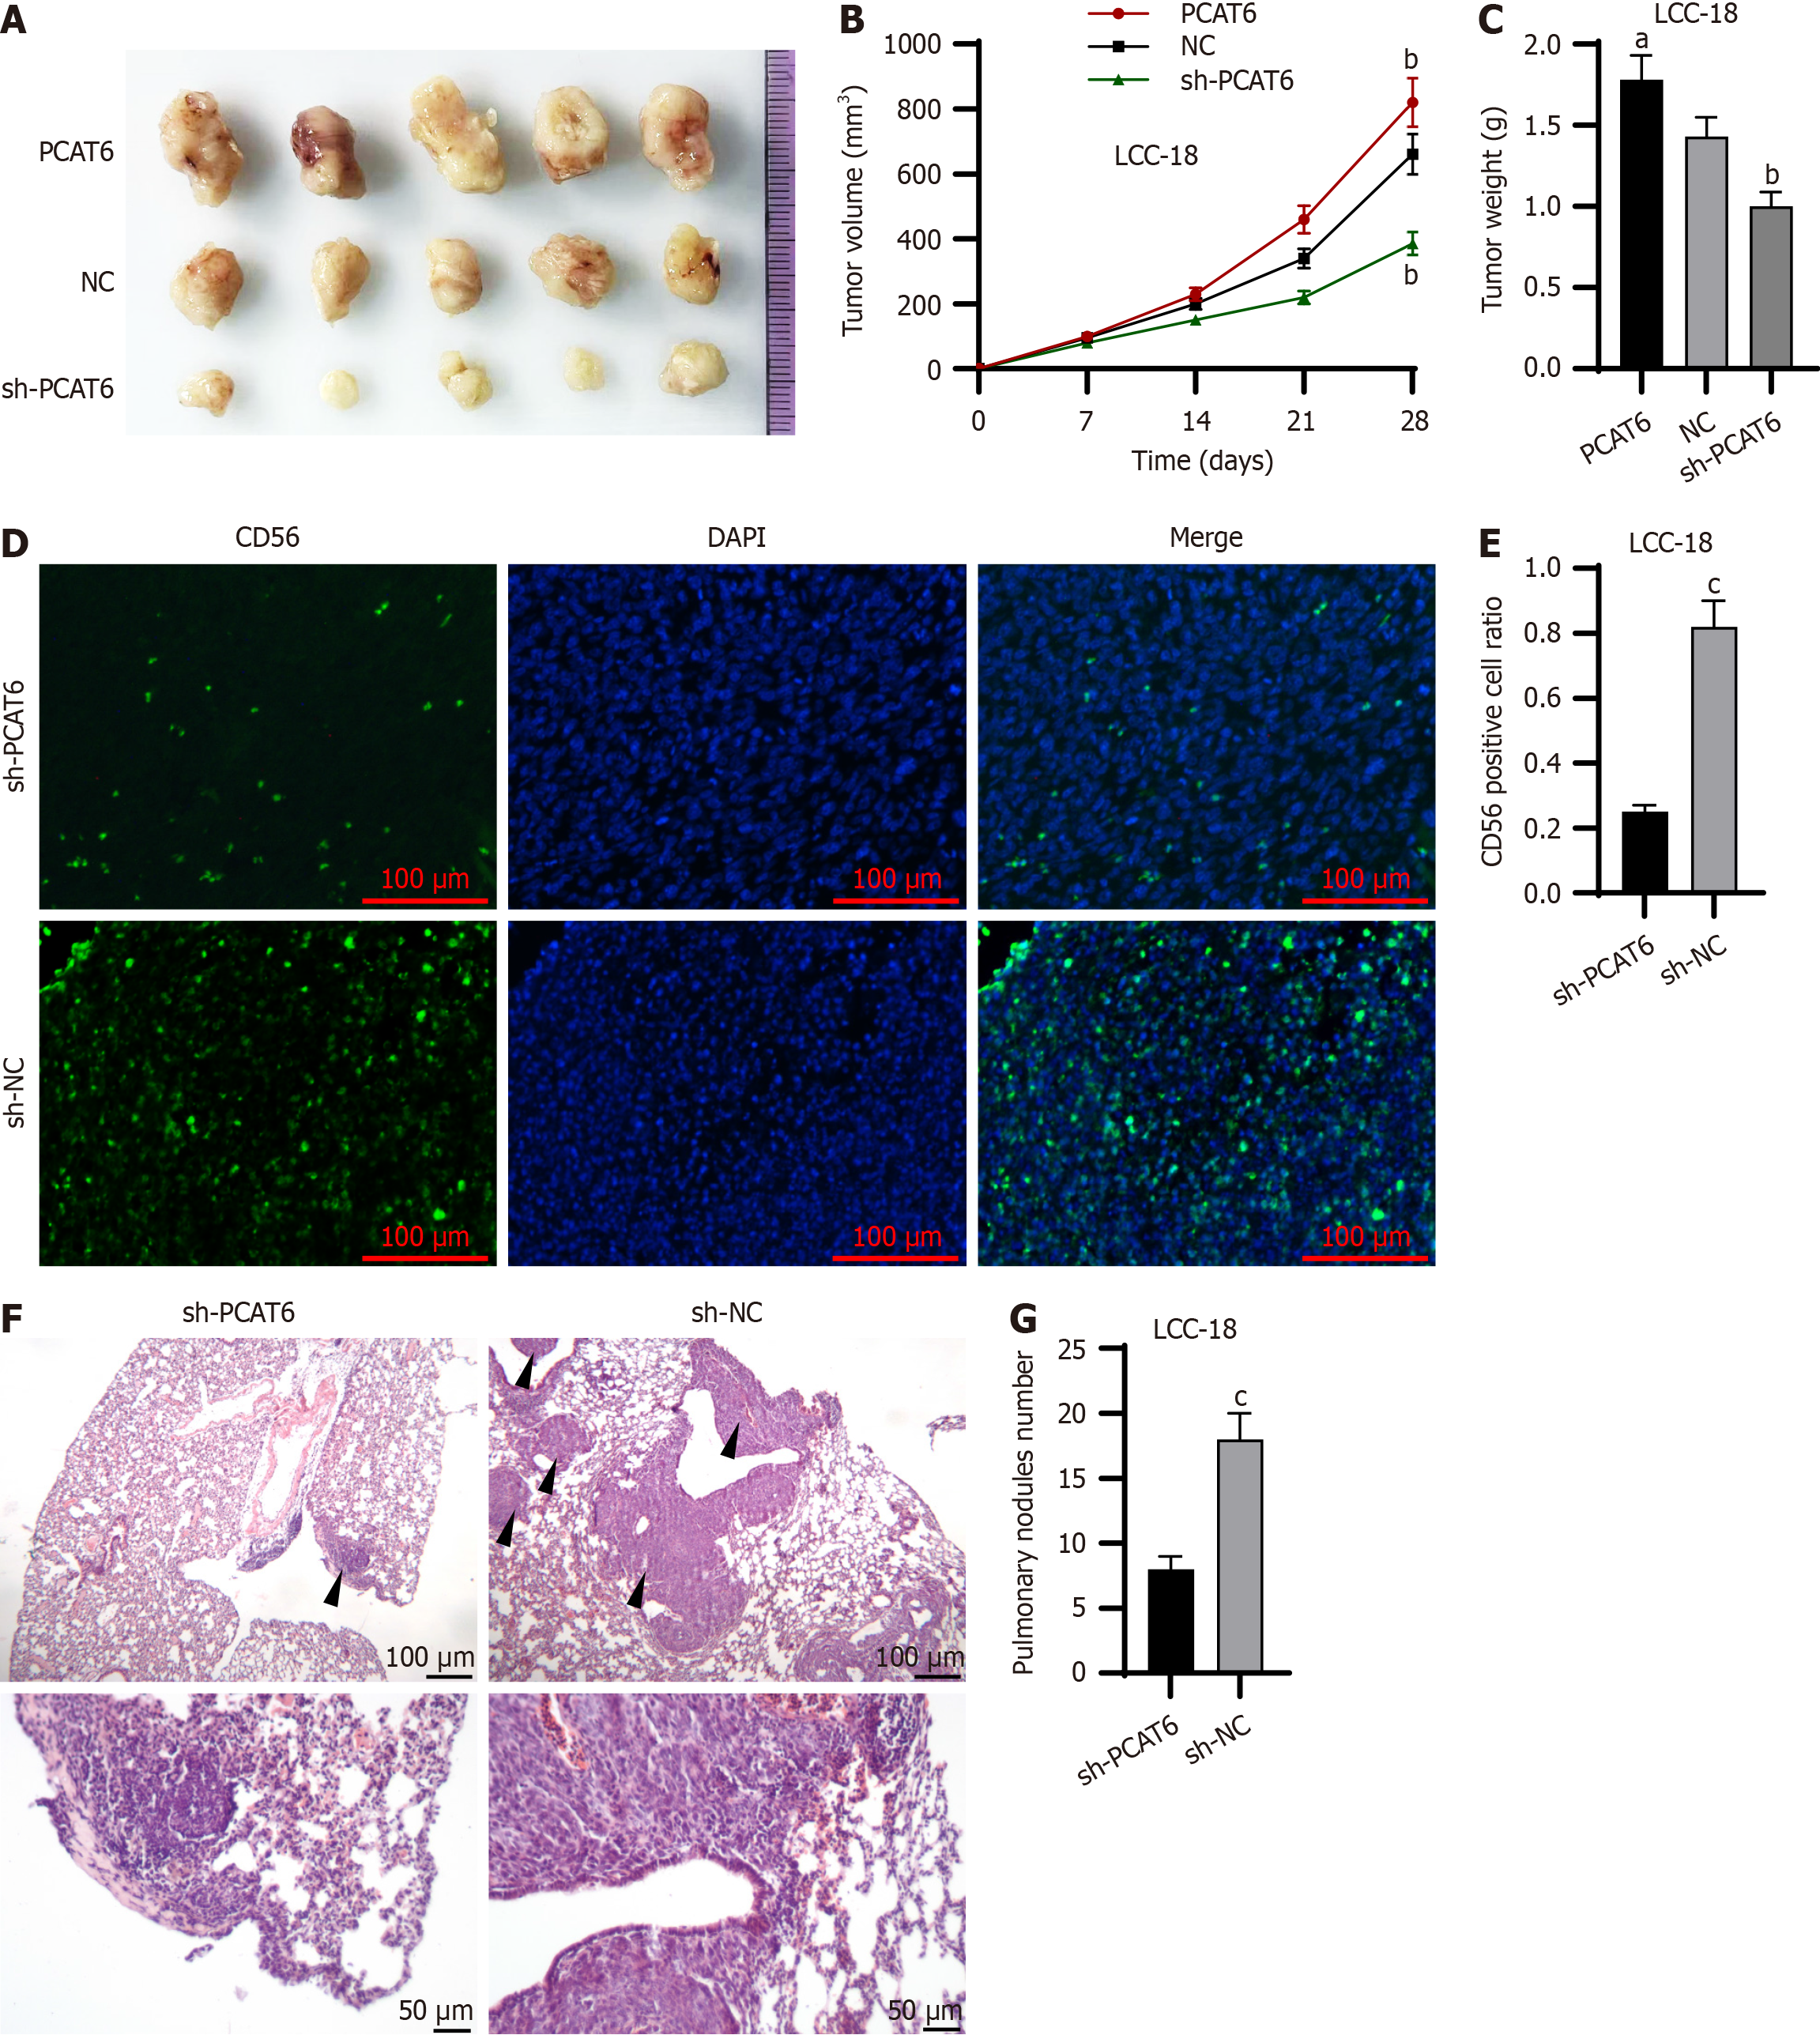
Figure 3 Prostate cancer associated transcript 6 facilitates tumor growth and metastasis in vivo.
A: Photographs of the excised tumors after 28 days of treatment; B: Tumor volume; C: Tumor weight; D and E: Immunofluorescence staining of CD56; F and G: Hematoxylin-eosin staining of lung metastasis. aP < 0.05, bP < 0.01, cP < 0.001. PCAT6: Prostate cancer associated transcript 6.
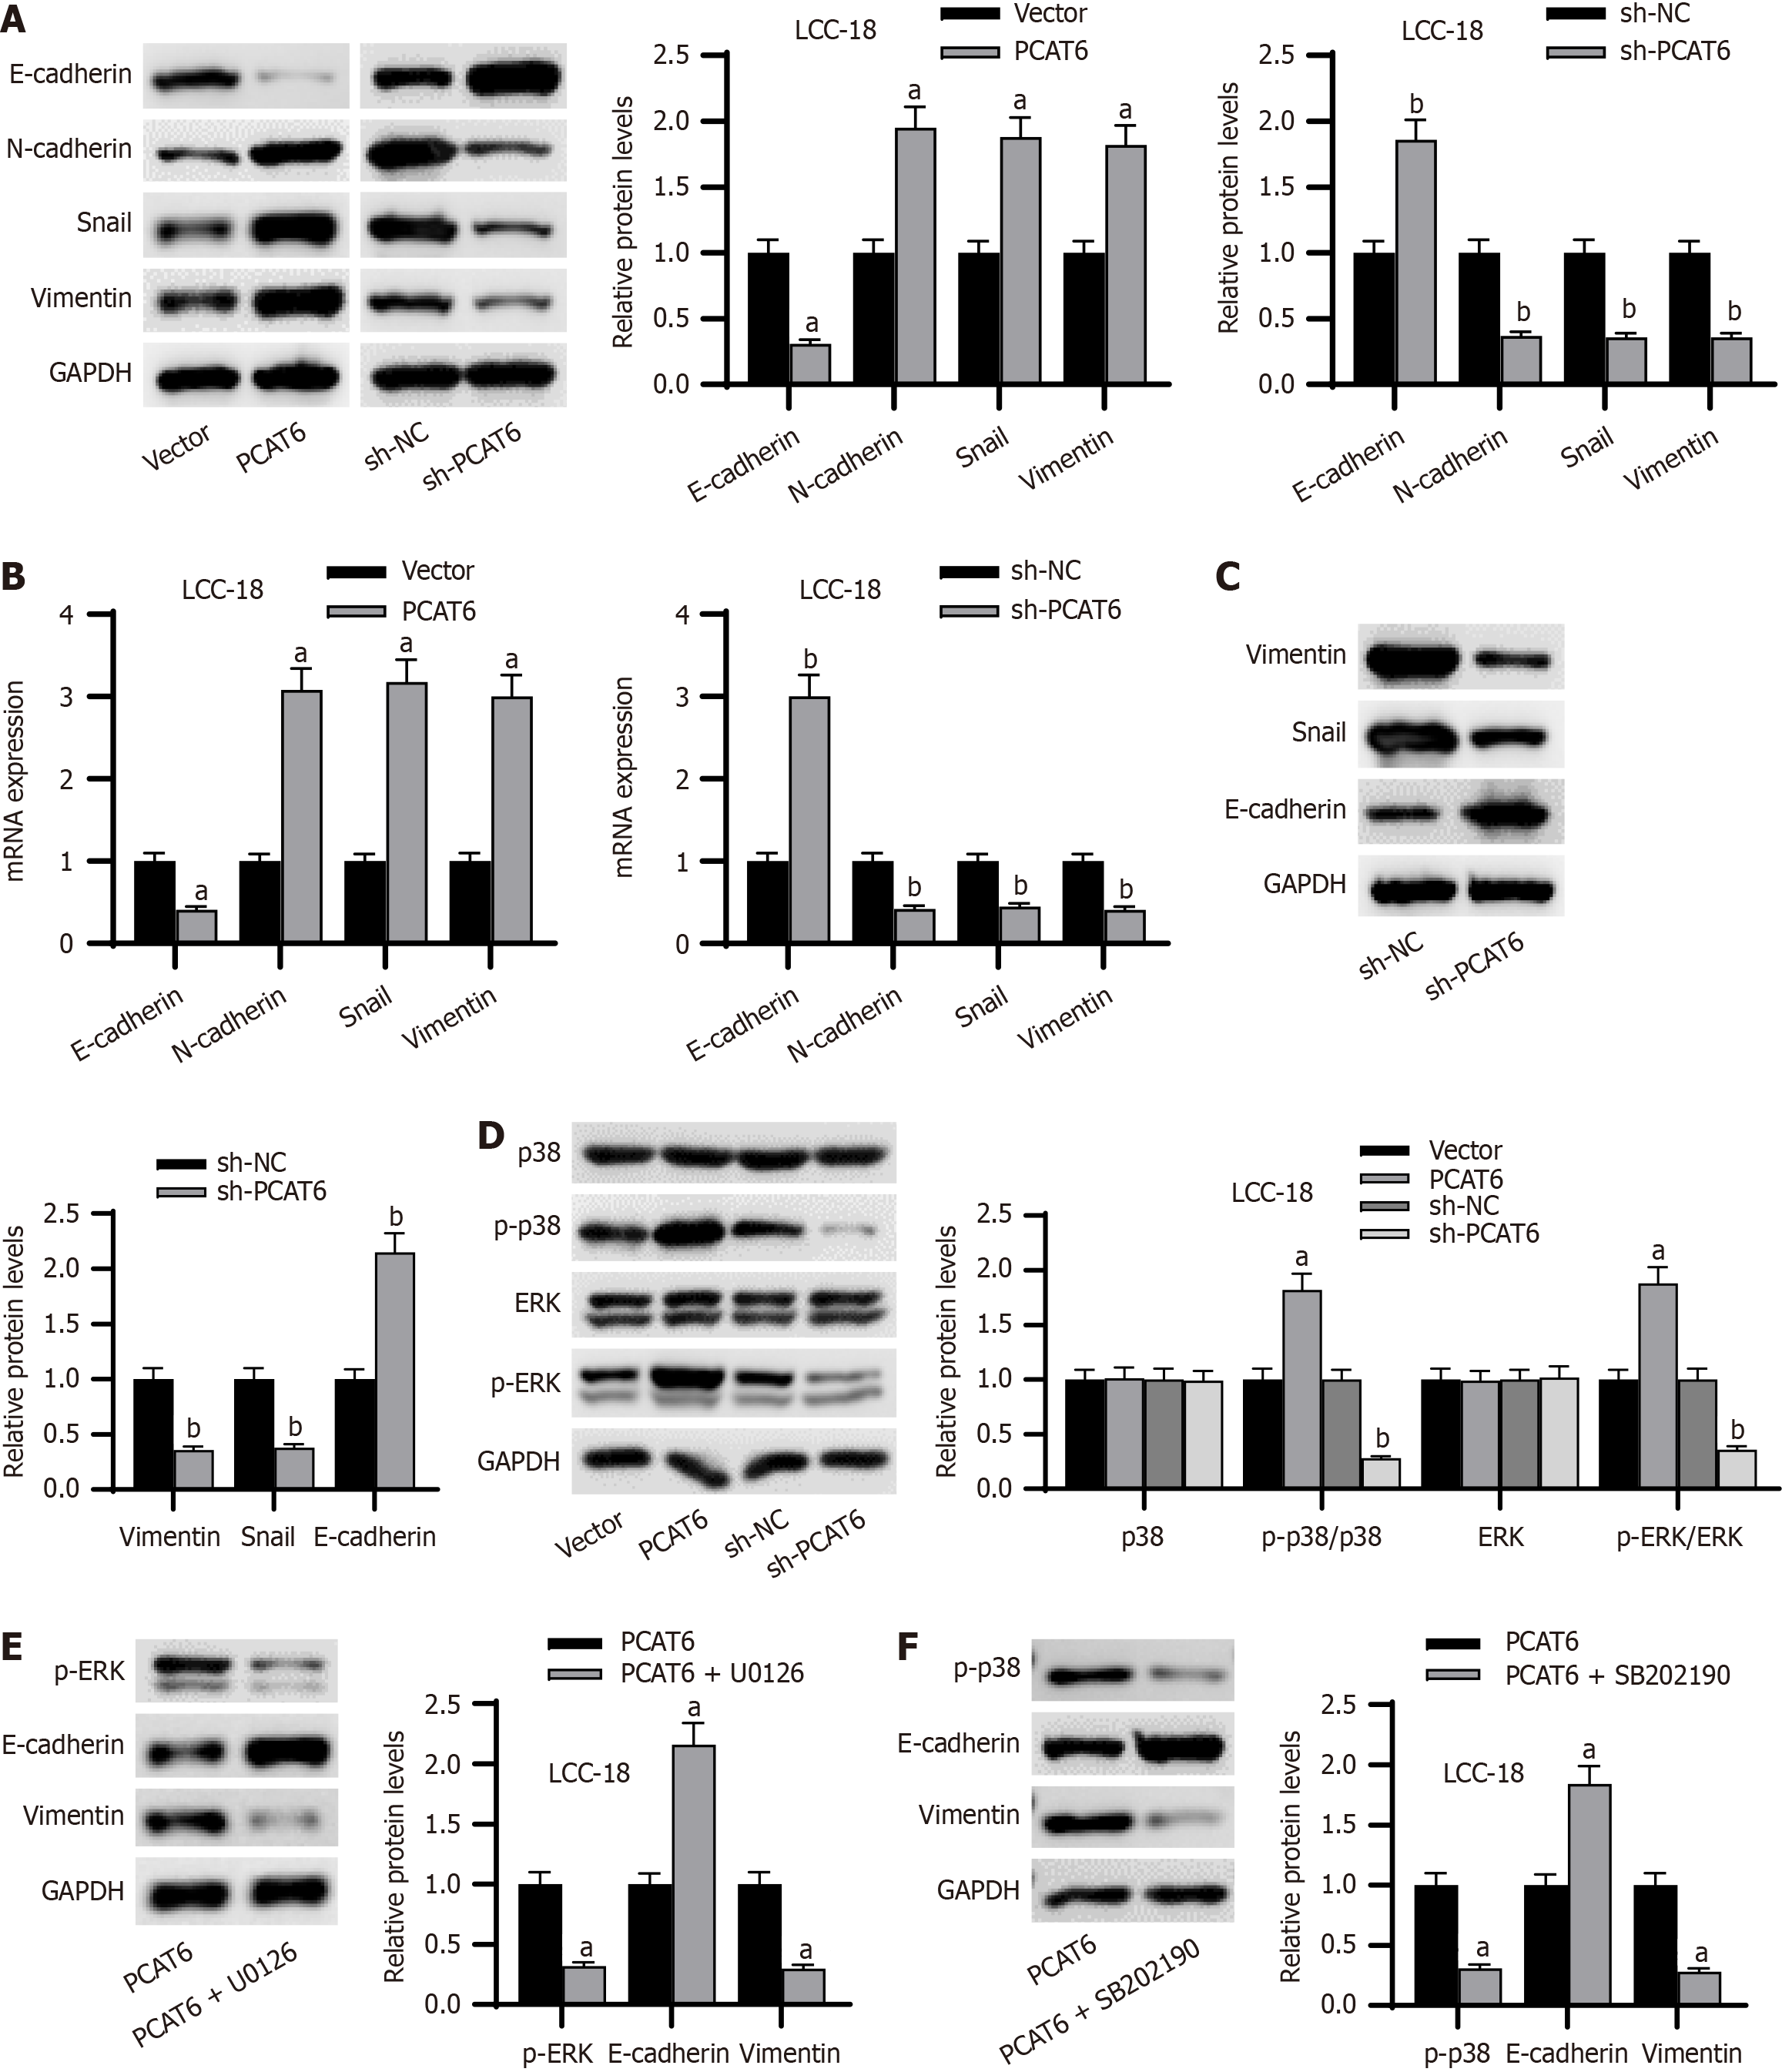
Figure 4 Prostate cancer associated transcript 6 enhances the epithelial-mesenchymal transition in neuroendocrine carcinomas.
A and B: The protein and mRNA levels of E-cadherin, N-cadherin, Snail and GAPDH in LCC-18 cells were measured by western blotting and real-time quantitative polymerase chain reaction; C: The protein levels of vimentin, Snail and E-cadherin in neuroendocrine carcinomas tumor samples; D: The protein levels of p38, p-p38, ERK, and p-ERK in LCC-18 cells were evaluated by western blotting; E: The protein levels of p-ERK, E-cadherin, and vimentin in LCC-18 cells treated with or without U0126 (an ERK inhibitor) were measured by western blotting; F: The protein levels of p-p38, E-cadherin, and vimentin in LCC-18 cells treated with or without SB202190 (a p38 inhibitor) were detected by western blotting. aP < 0.001 vs vector group or PCAT6 group; bP < 0.001 vs sh-NC group. PCAT6: Prostate cancer associated transcript 6.
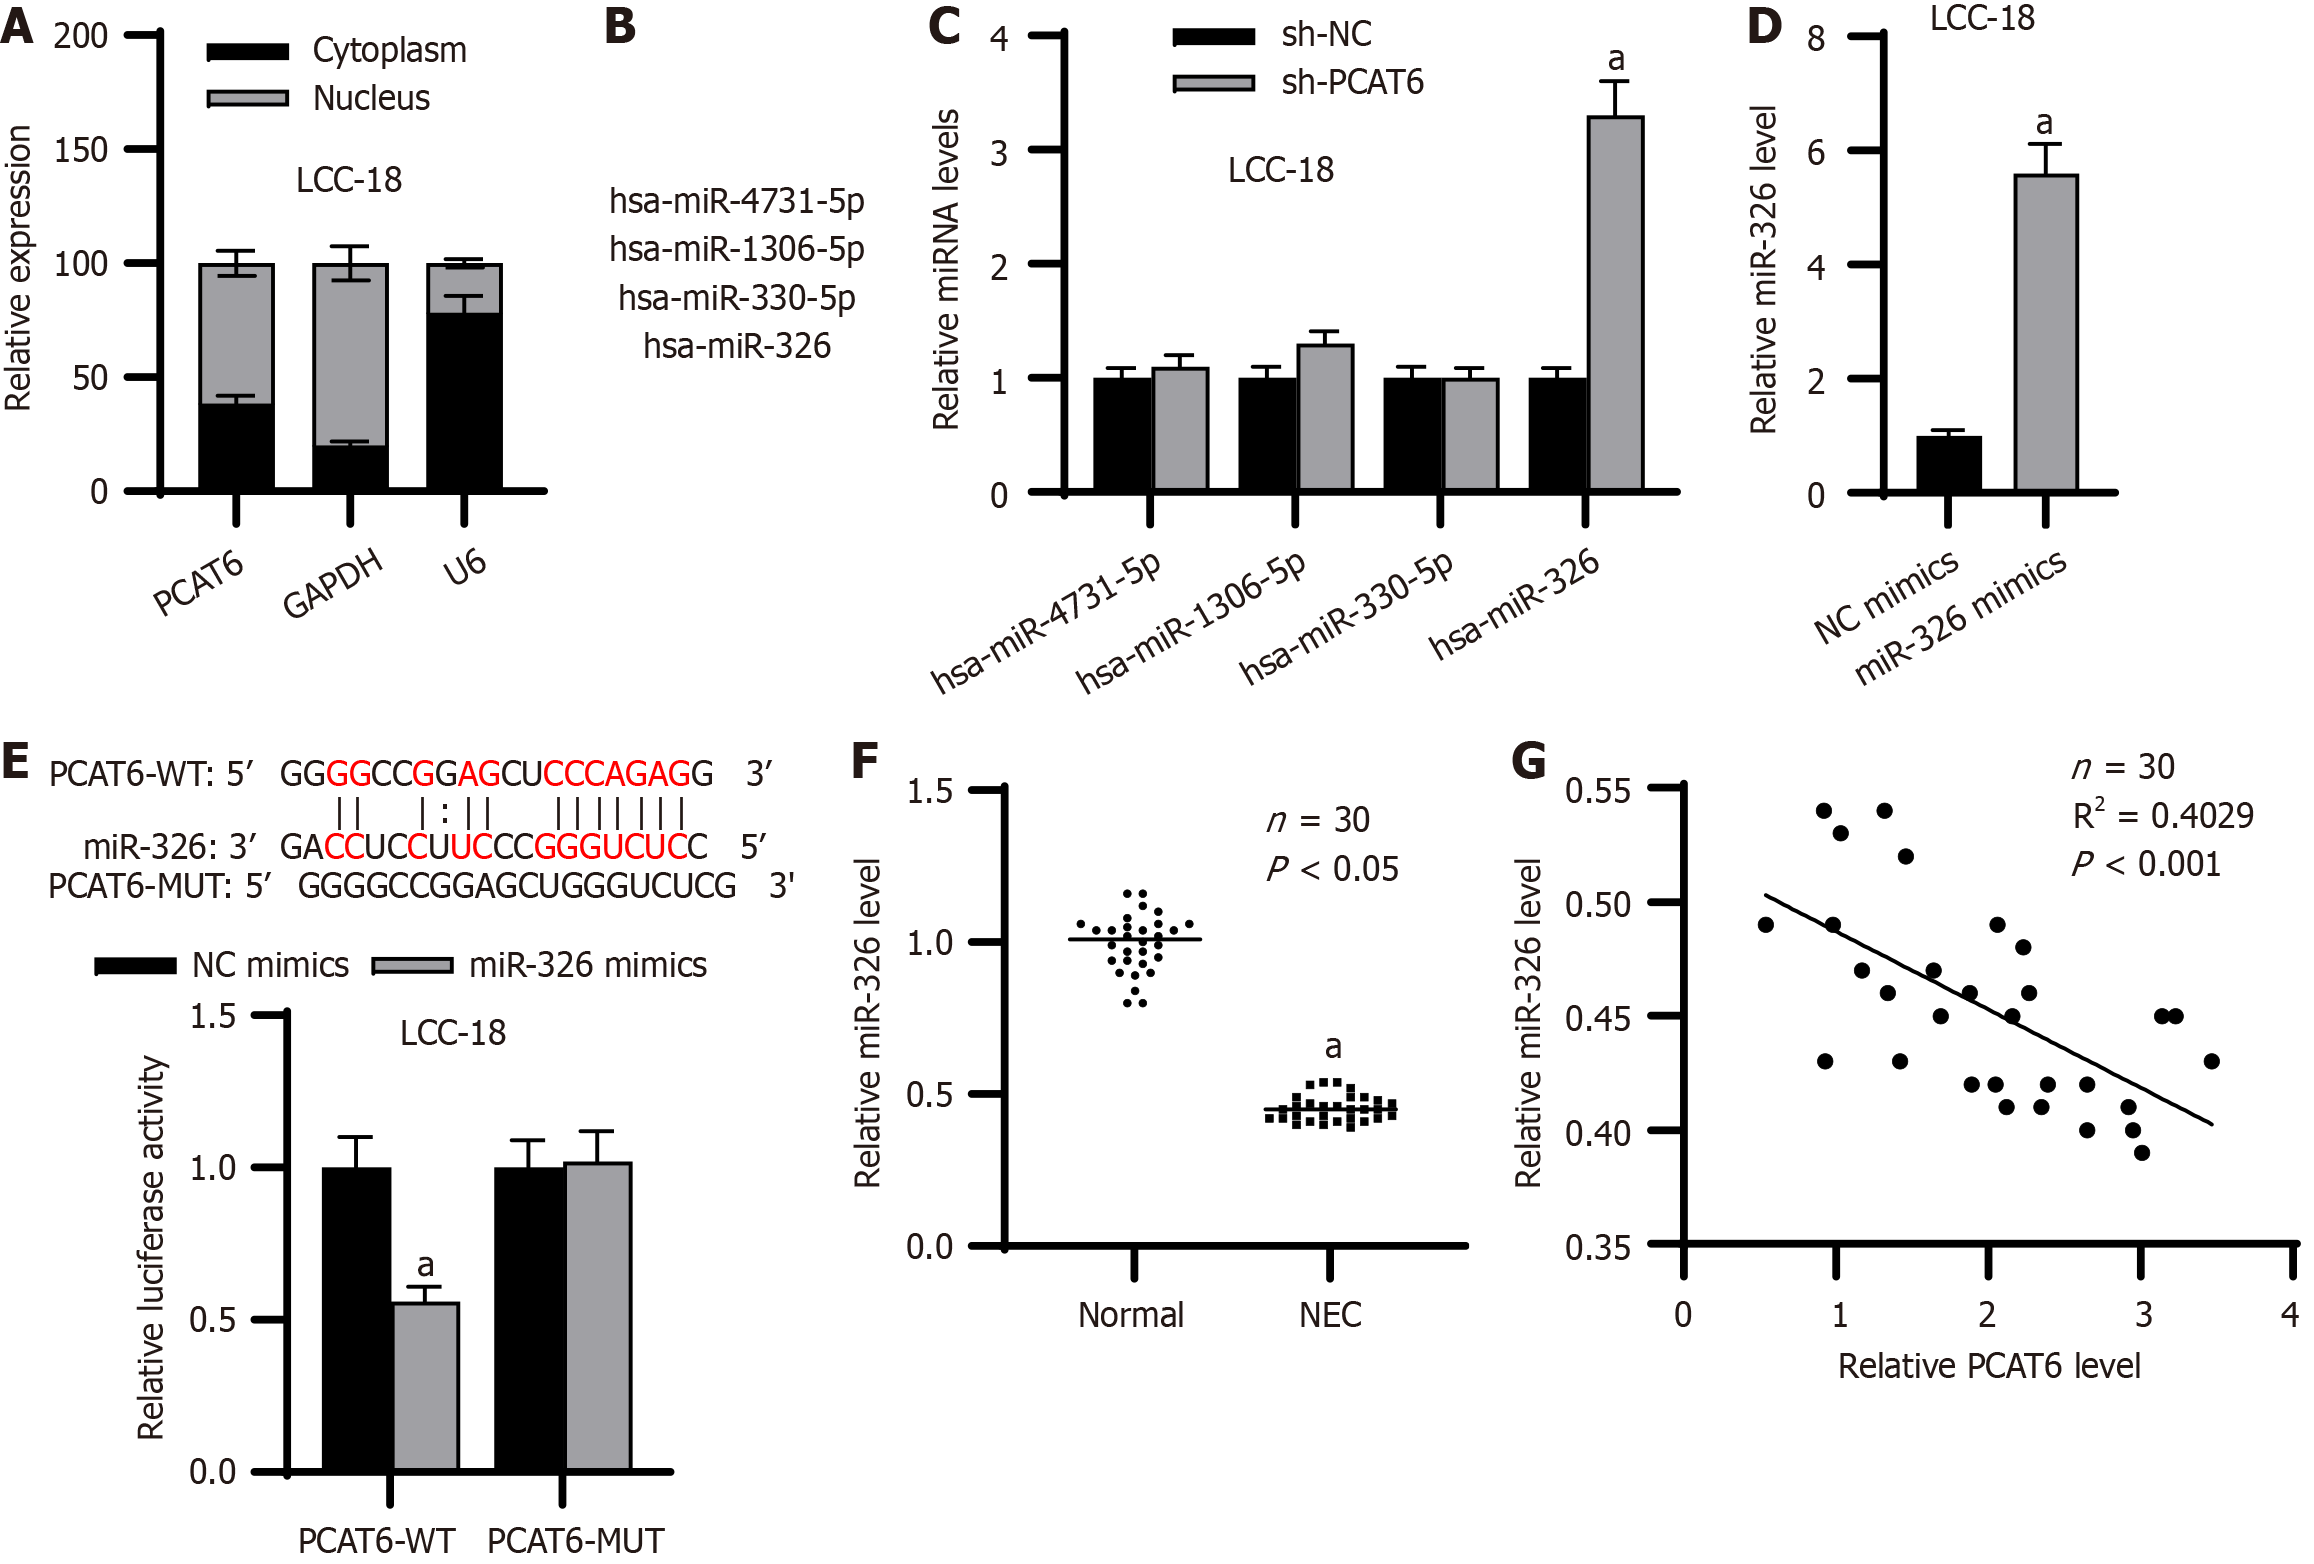
Figure 5 MiR-326 is a target of prostate cancer associated transcript 6.
A: Subcellular distribution of prostate cancer associated transcript 6 (PCAT6) in LCC-18 cells; B: The candidate downstream miRNAs of PCAT6 were predicted by the TargetScan database; C: The miRNA levels of these candidate miRNAs in LCC-18 cells transfected with sh-NC or sh-PCAT6 were measured by real-time quantitative polymerase chain reaction (RT-qPCR); D: The overexpression efficiency of miR-326 mimics in LCC-18 cells was detected by RT-qPCR; E: The interaction between miR-326 and PCAT6 was determined by luciferase reporter assays; F: The level of miR-326 in tumor and adjacent nontumor samples collected from patients with NEC was assessed by RT-qPCR; G: The correlation between PCAT6 expression and miR-326 expression was determined by Pearson’s analysis. aP < 0.001. PCAT6: Prostate cancer associated transcript 6.
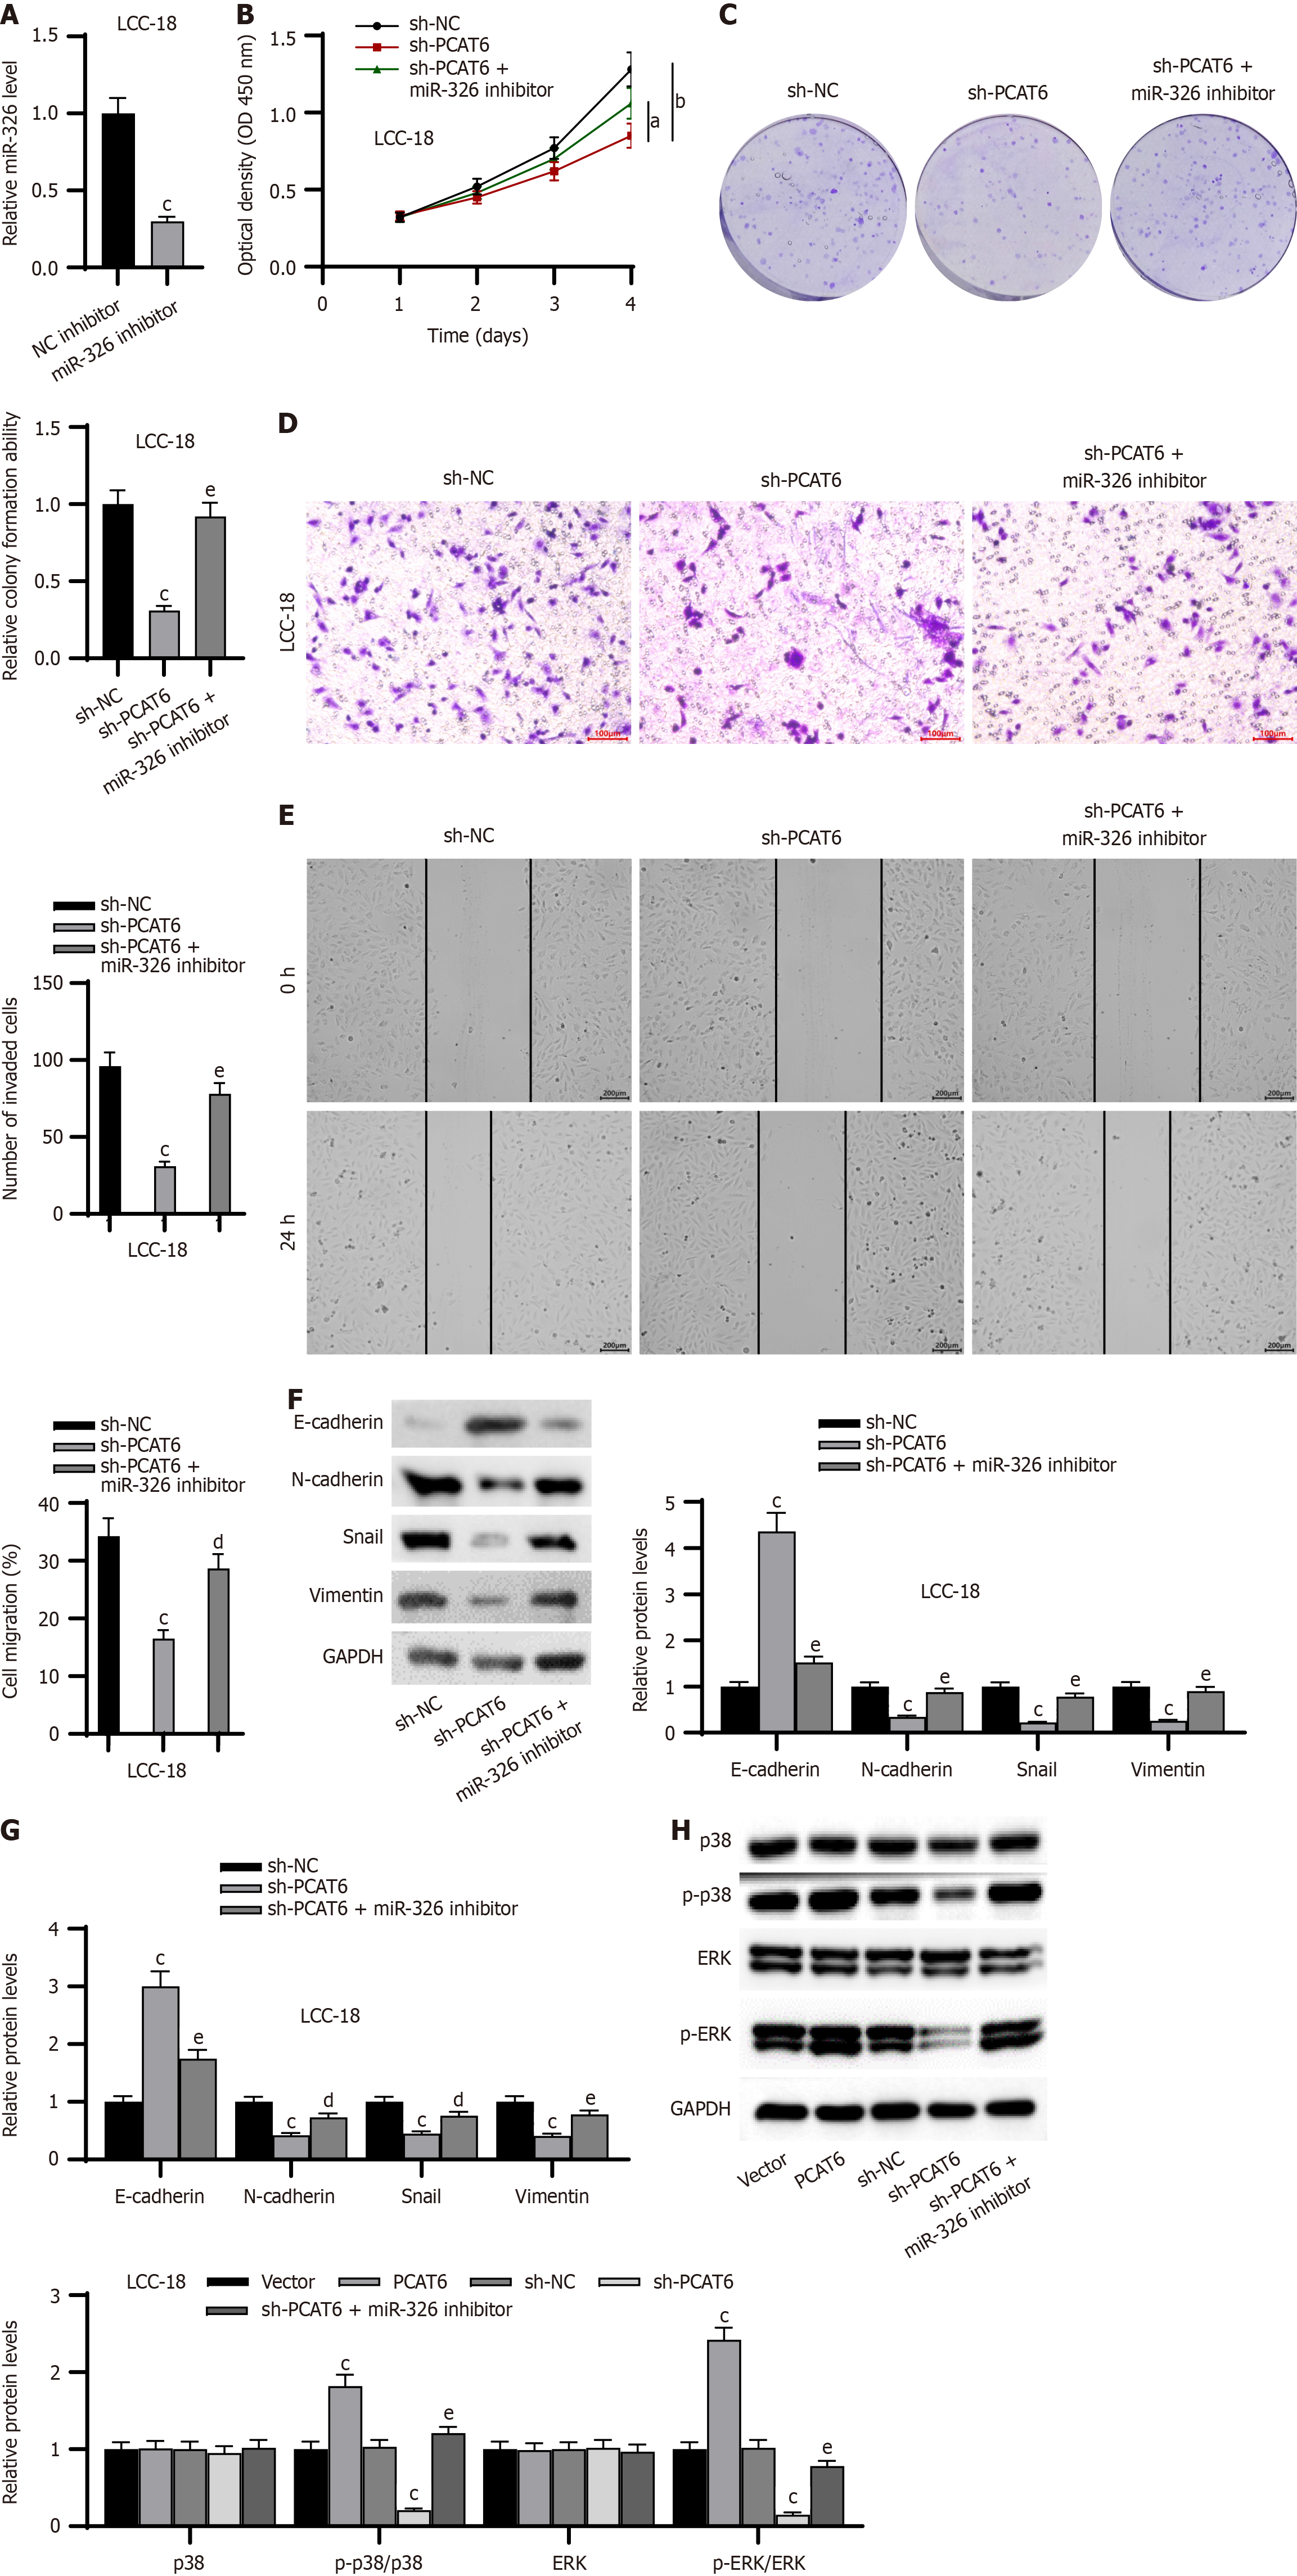
Figure 6 Prostate cancer associated transcript 6 promotes the proliferation, migration, invasion, and epithelial-mesenchymal transition of colonic neuroendocrine carcinomas cells by targeting miR-326.
A: The knockdown efficiency of miR-326 inhibitor in LCC-18 cells was confirmed by RT-qPCR; B: CCK-8 assays of cell viability; C: Colony formation assays of cell proliferation; C: Transwell assays of cell invasion; E: Wound healing assays of cell migration; F: The protein levels of E-cadherin, N-cadherin, Snail, and vimentin were measured by western blotting; G: The mRNA levels of E-cadherin, N-cadherin, Snail, and vimentin were assessed by RT-qPCR; H: The protein levels of p38, p-p38, ERK, and p-ERK were measured by western blotting. aP < 0.05, bP < 0.01, cP < 0.001 vs NC inhibitor, sh-NC, or vector group; dP < 0.01, eP < 0.001 vs sh-PCAT6 group. PCAT6: Prostate cancer associated transcript 6.
- Citation: Wang F, Mu HF, Wang C, Tang Y, Si MY, Peng J. LncRNA PCAT6 promotes progression and metastasis of colonic neuroendocrine carcinoma via MAPK pathway. World J Gastrointest Oncol 2025; 17(2): 96230
- URL: https://www.wjgnet.com/1948-5204/full/v17/i2/96230.htm
- DOI: https://dx.doi.org/10.4251/wjgo.v17.i2.96230


