Copyright
©The Author(s) 2024.
World J Gastrointest Oncol. Jul 15, 2024; 16(7): 3357-3363
Published online Jul 15, 2024. doi: 10.4251/wjgo.v16.i7.3357
Published online Jul 15, 2024. doi: 10.4251/wjgo.v16.i7.3357
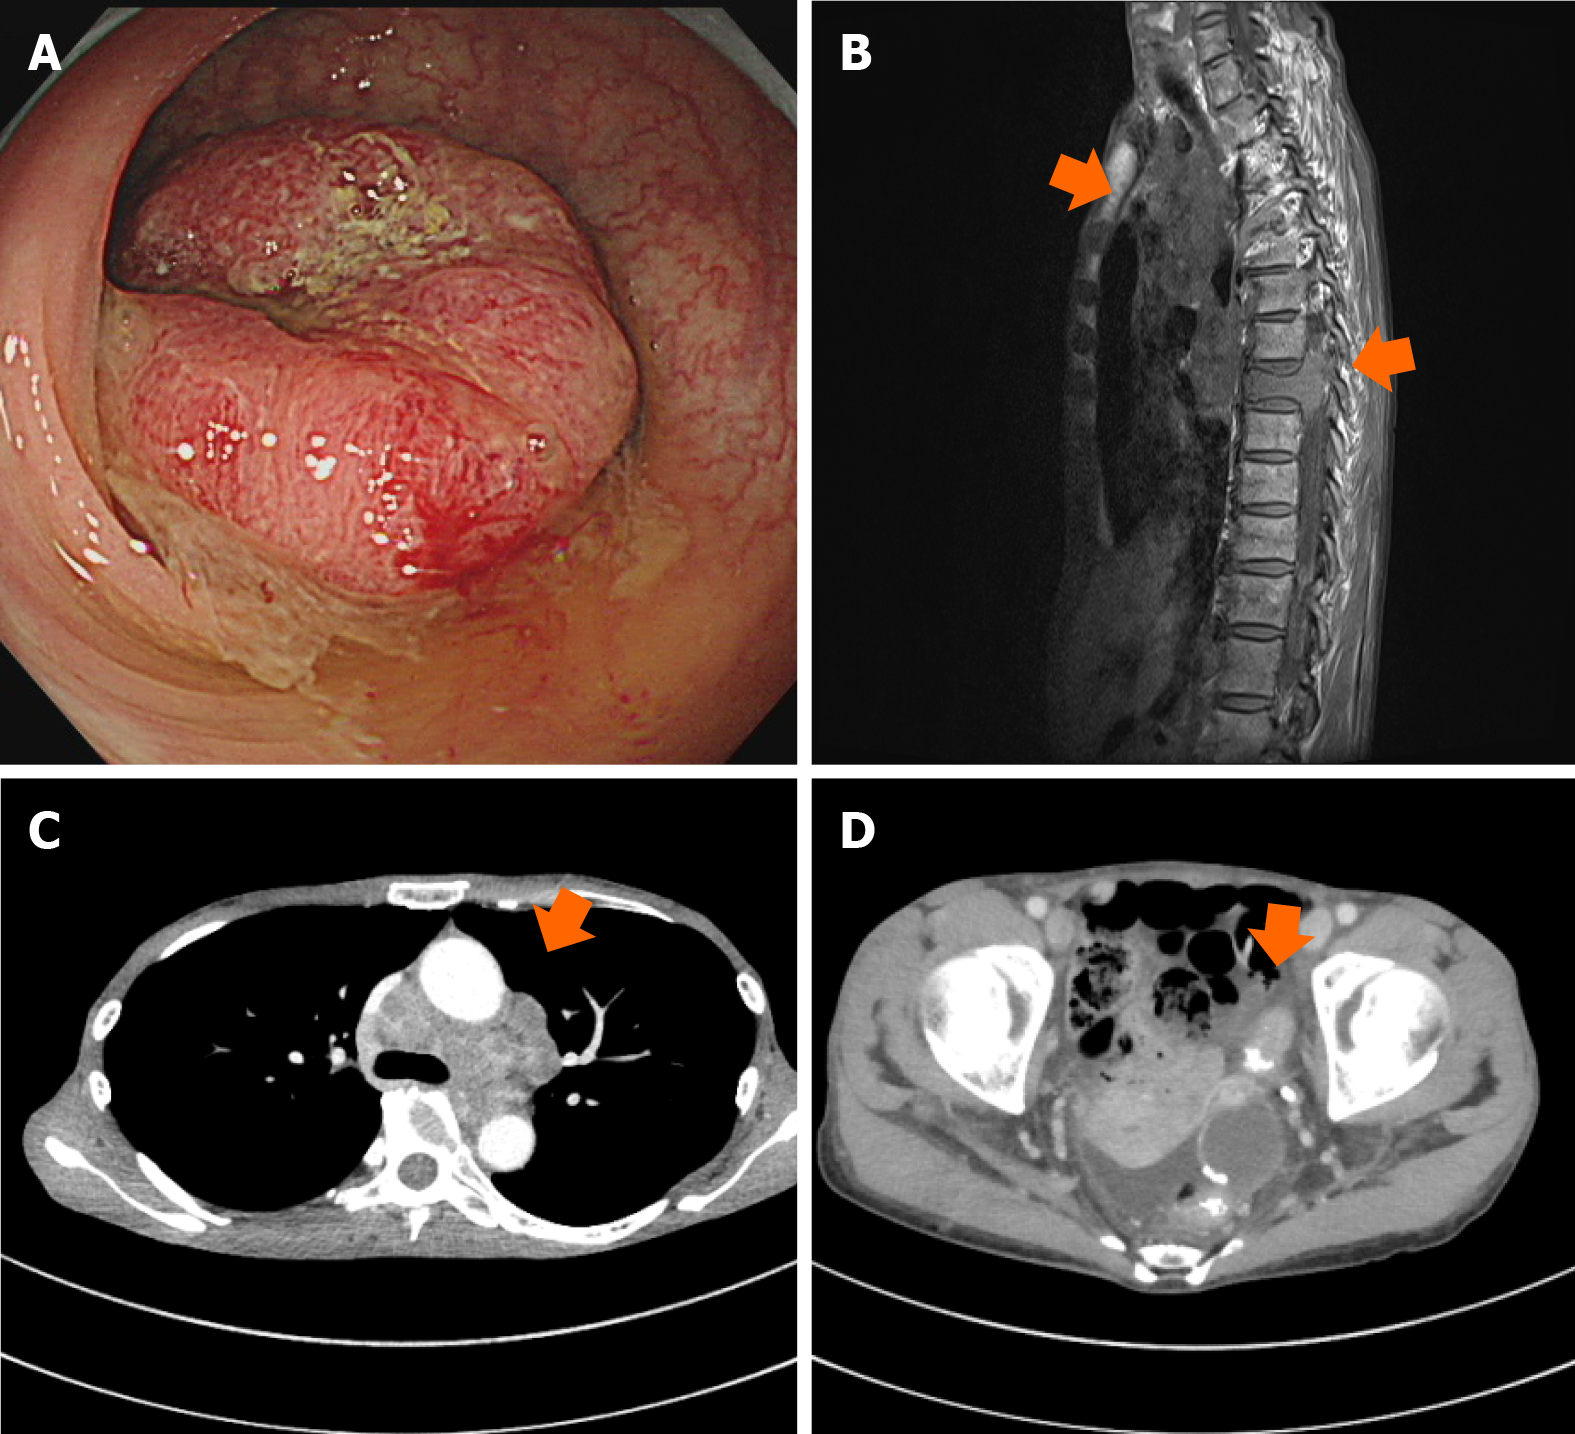
Figure 1 Imaging findings before treatment.
A: Colonoscopy image of sigmoid colon; B: Magnetic resonance image of mediastinal lymph nodes and spinal bone; C and D: Computed tomographic image of mediastinal lymph nodes and sigmoid colon.
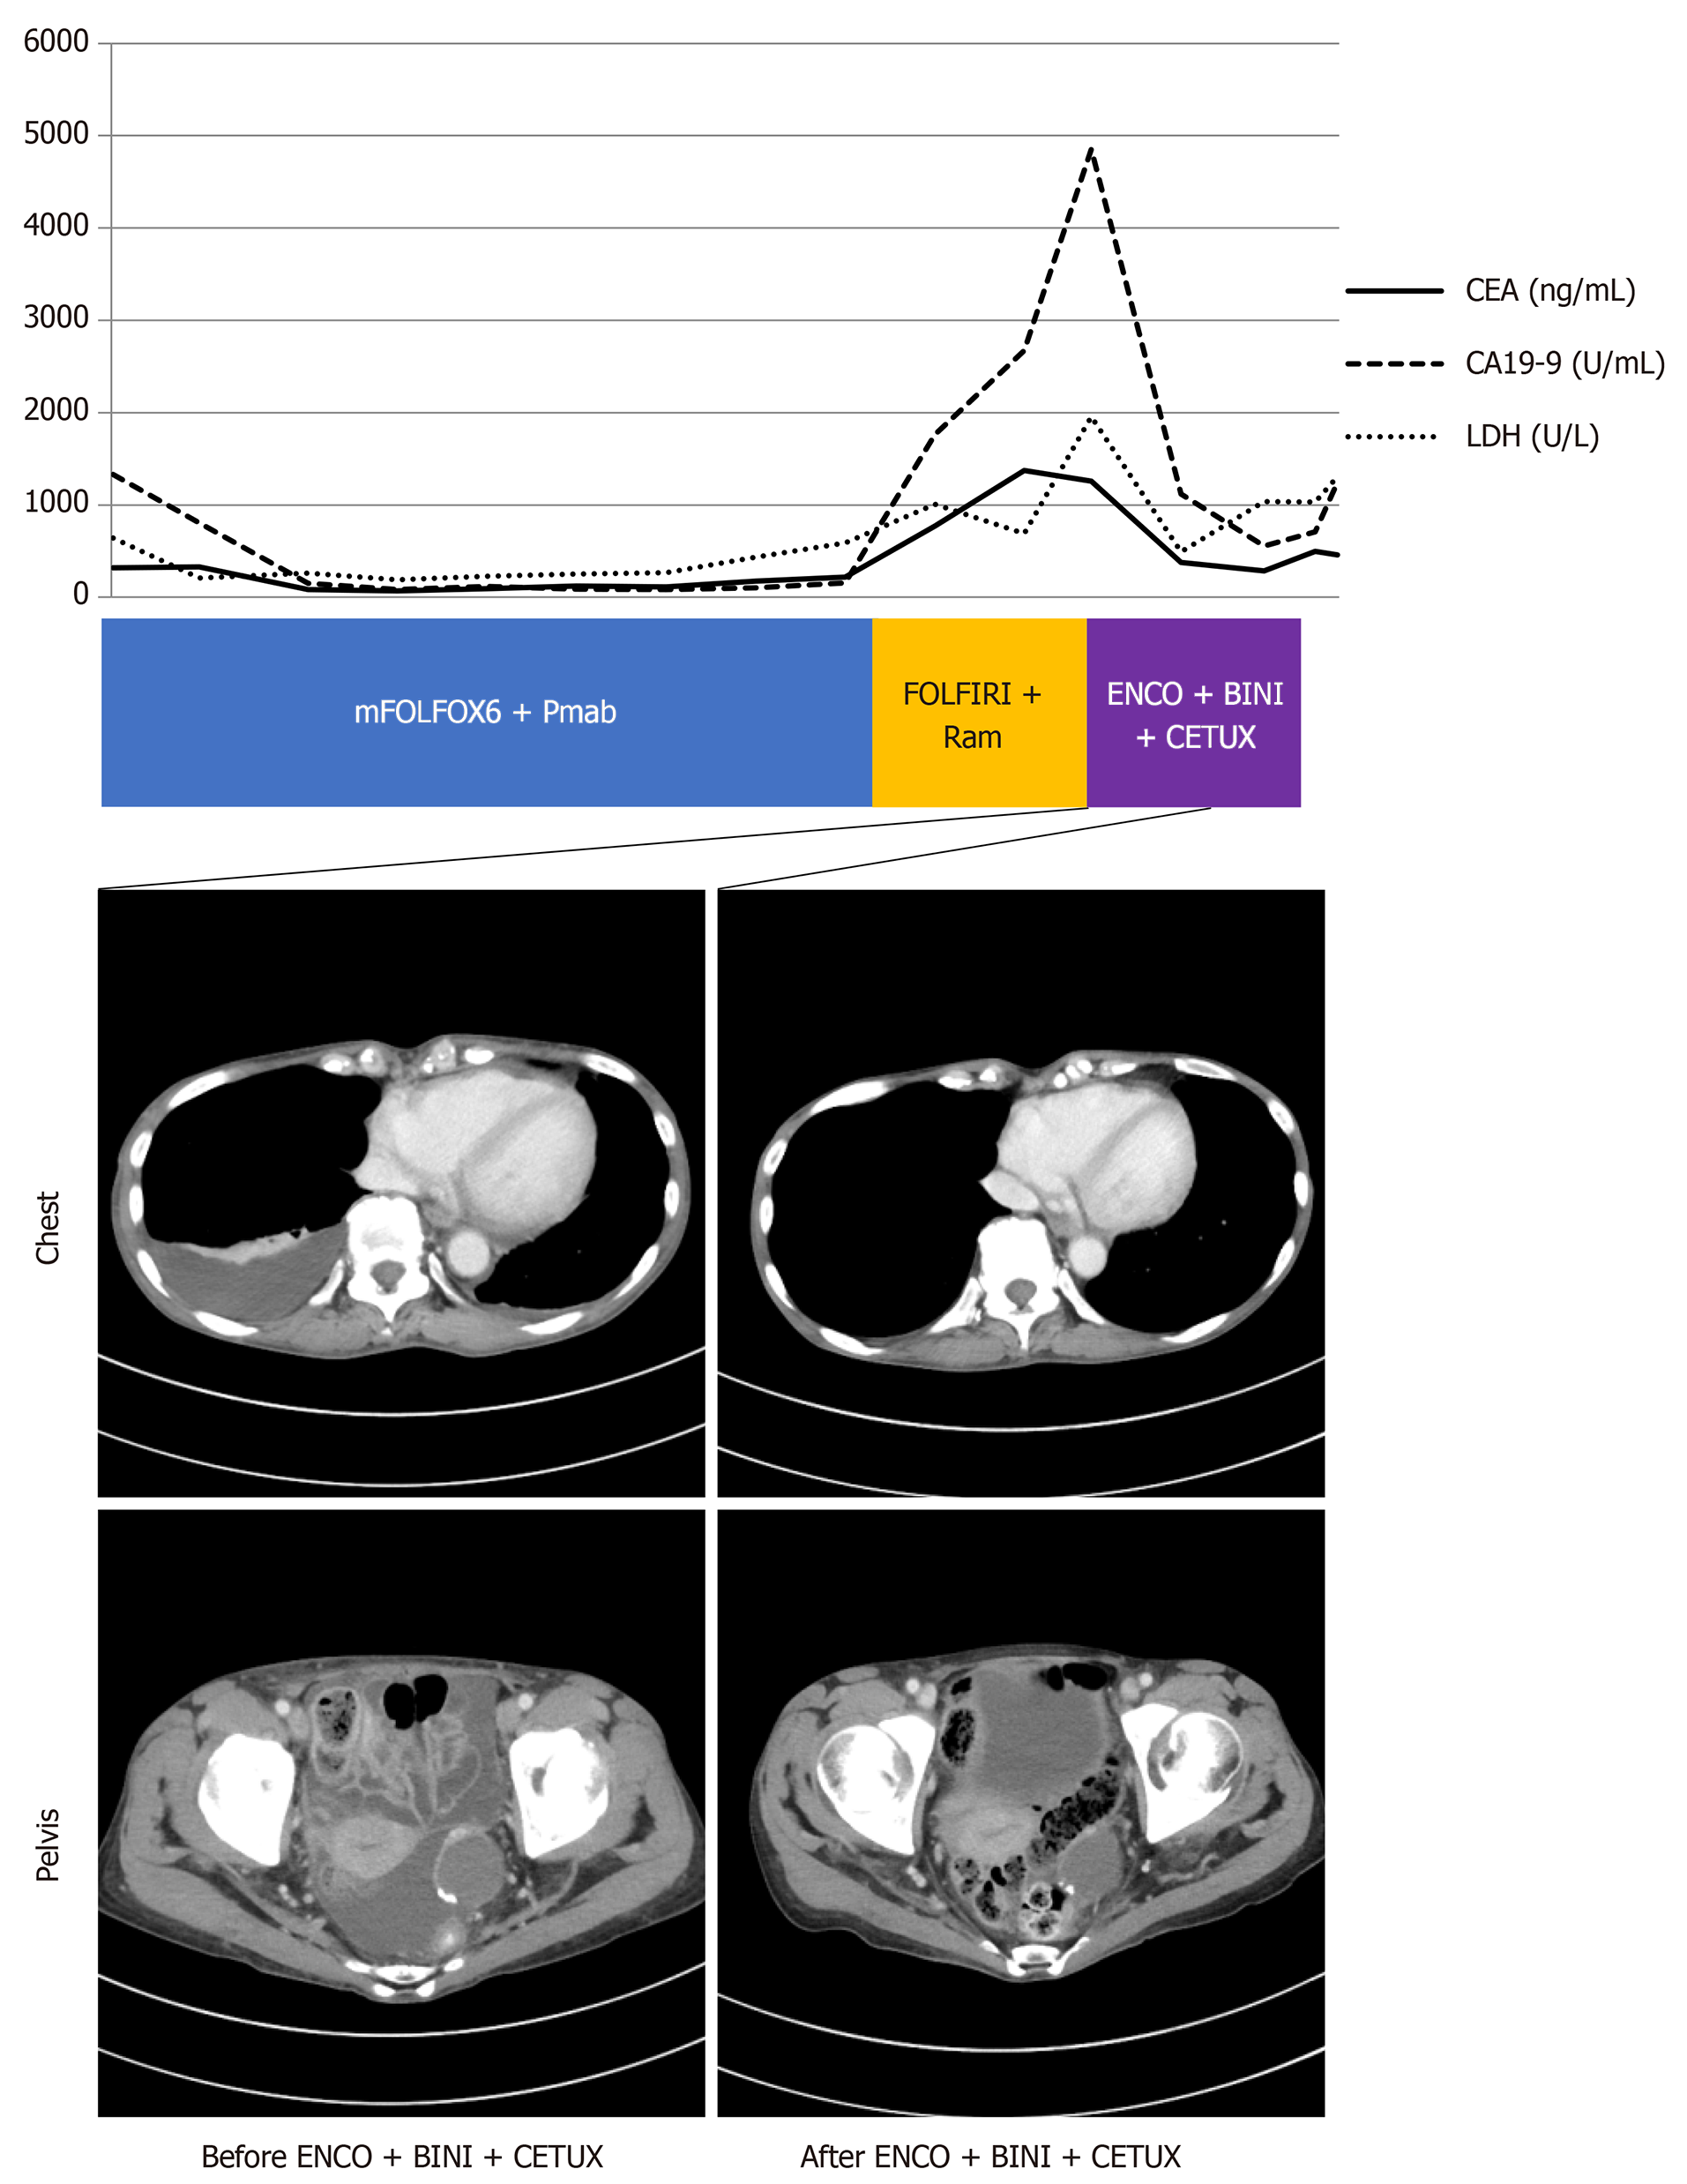
Figure 2 Response to combination therapy with encorafenib, binimetinib, and cetuximab.
Computed tomography images before and after treatment with encorafenib, binimetinib, and cetuximab. The graph shows fluctuation of serum levels of carcinoembryonic antigen (CEA; normal range: 0-5 ng/mL), carbohydrate antigen 19-9 (CA 19-9; normal range: 0-37 U/mL) and lactate dehydrogenase (LDH; normal range: 124-222 U/L).
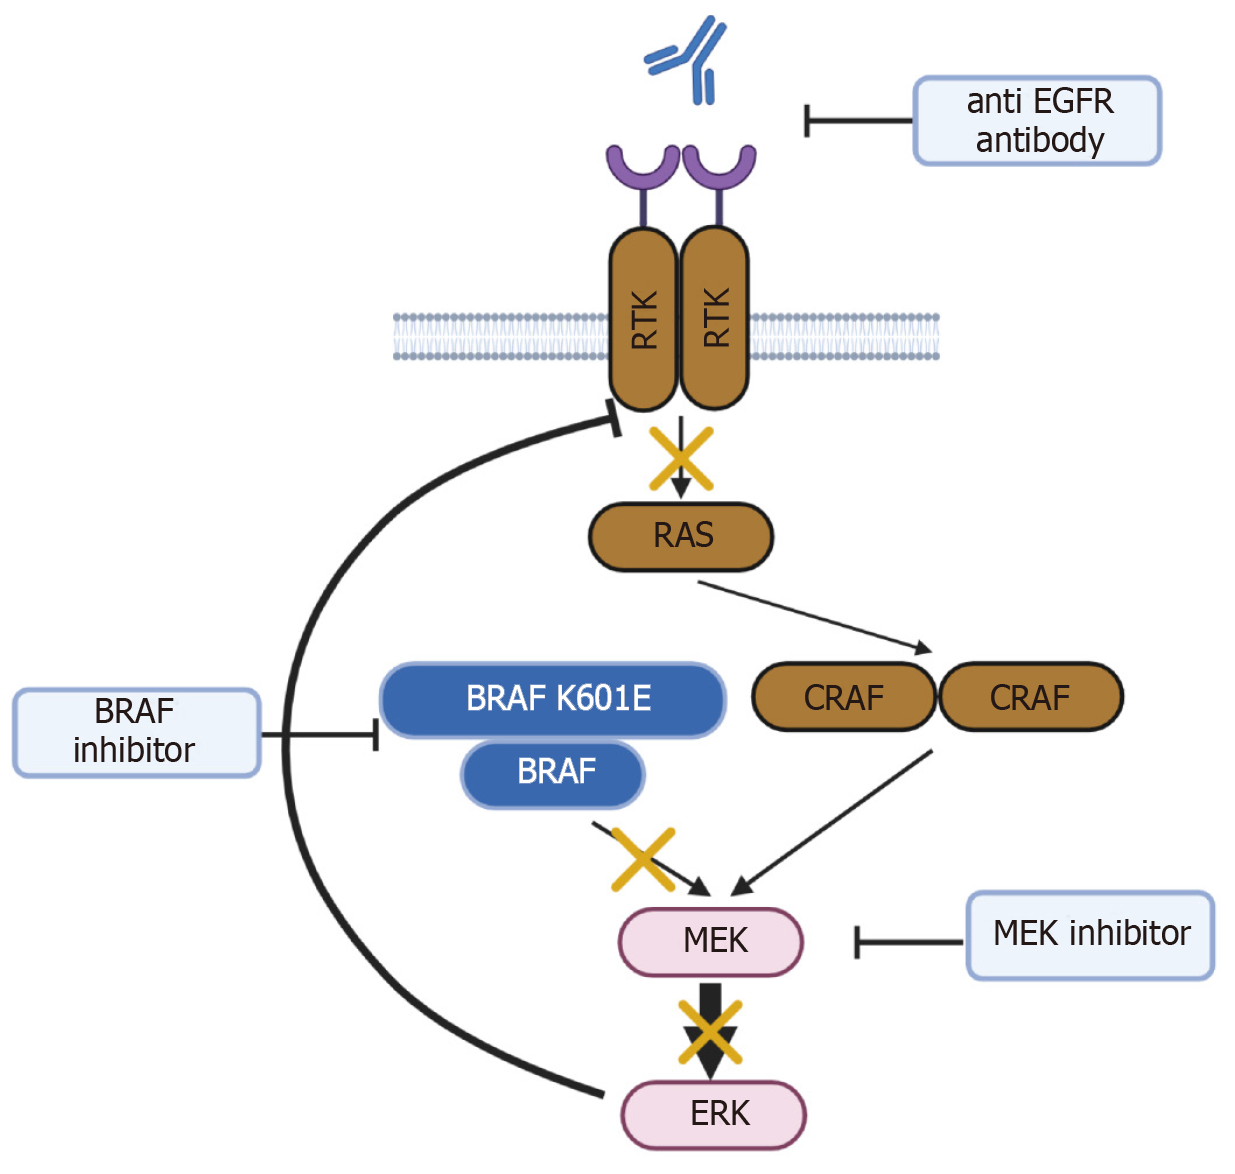
Figure 3 Schema of class II BRAF mutation and action of encorafenib, binimetinib, and cetuximab.
This schema was created with BioRender.com.
- Citation: Sasaki M, Shimura T, Nishie H, Kuroyanagi K, Kanno T, Fukusada S, Sugimura N, Mizuno Y, Nukui T, Uno K, Kojima Y, Nishigaki R, Tanaka M, Ozeki K, Kubota E, Kataoka H. BRAF K601E-mutated metastatic colorectal cancer in response to combination therapy with encorafenib, binimetinib, and cetuximab: A case report. World J Gastrointest Oncol 2024; 16(7): 3357-3363
- URL: https://www.wjgnet.com/1948-5204/full/v16/i7/3357.htm
- DOI: https://dx.doi.org/10.4251/wjgo.v16.i7.3357


