Copyright
©The Author(s) 2024.
World J Gastrointest Oncol. Jul 15, 2024; 16(7): 3350-3356
Published online Jul 15, 2024. doi: 10.4251/wjgo.v16.i7.3350
Published online Jul 15, 2024. doi: 10.4251/wjgo.v16.i7.3350
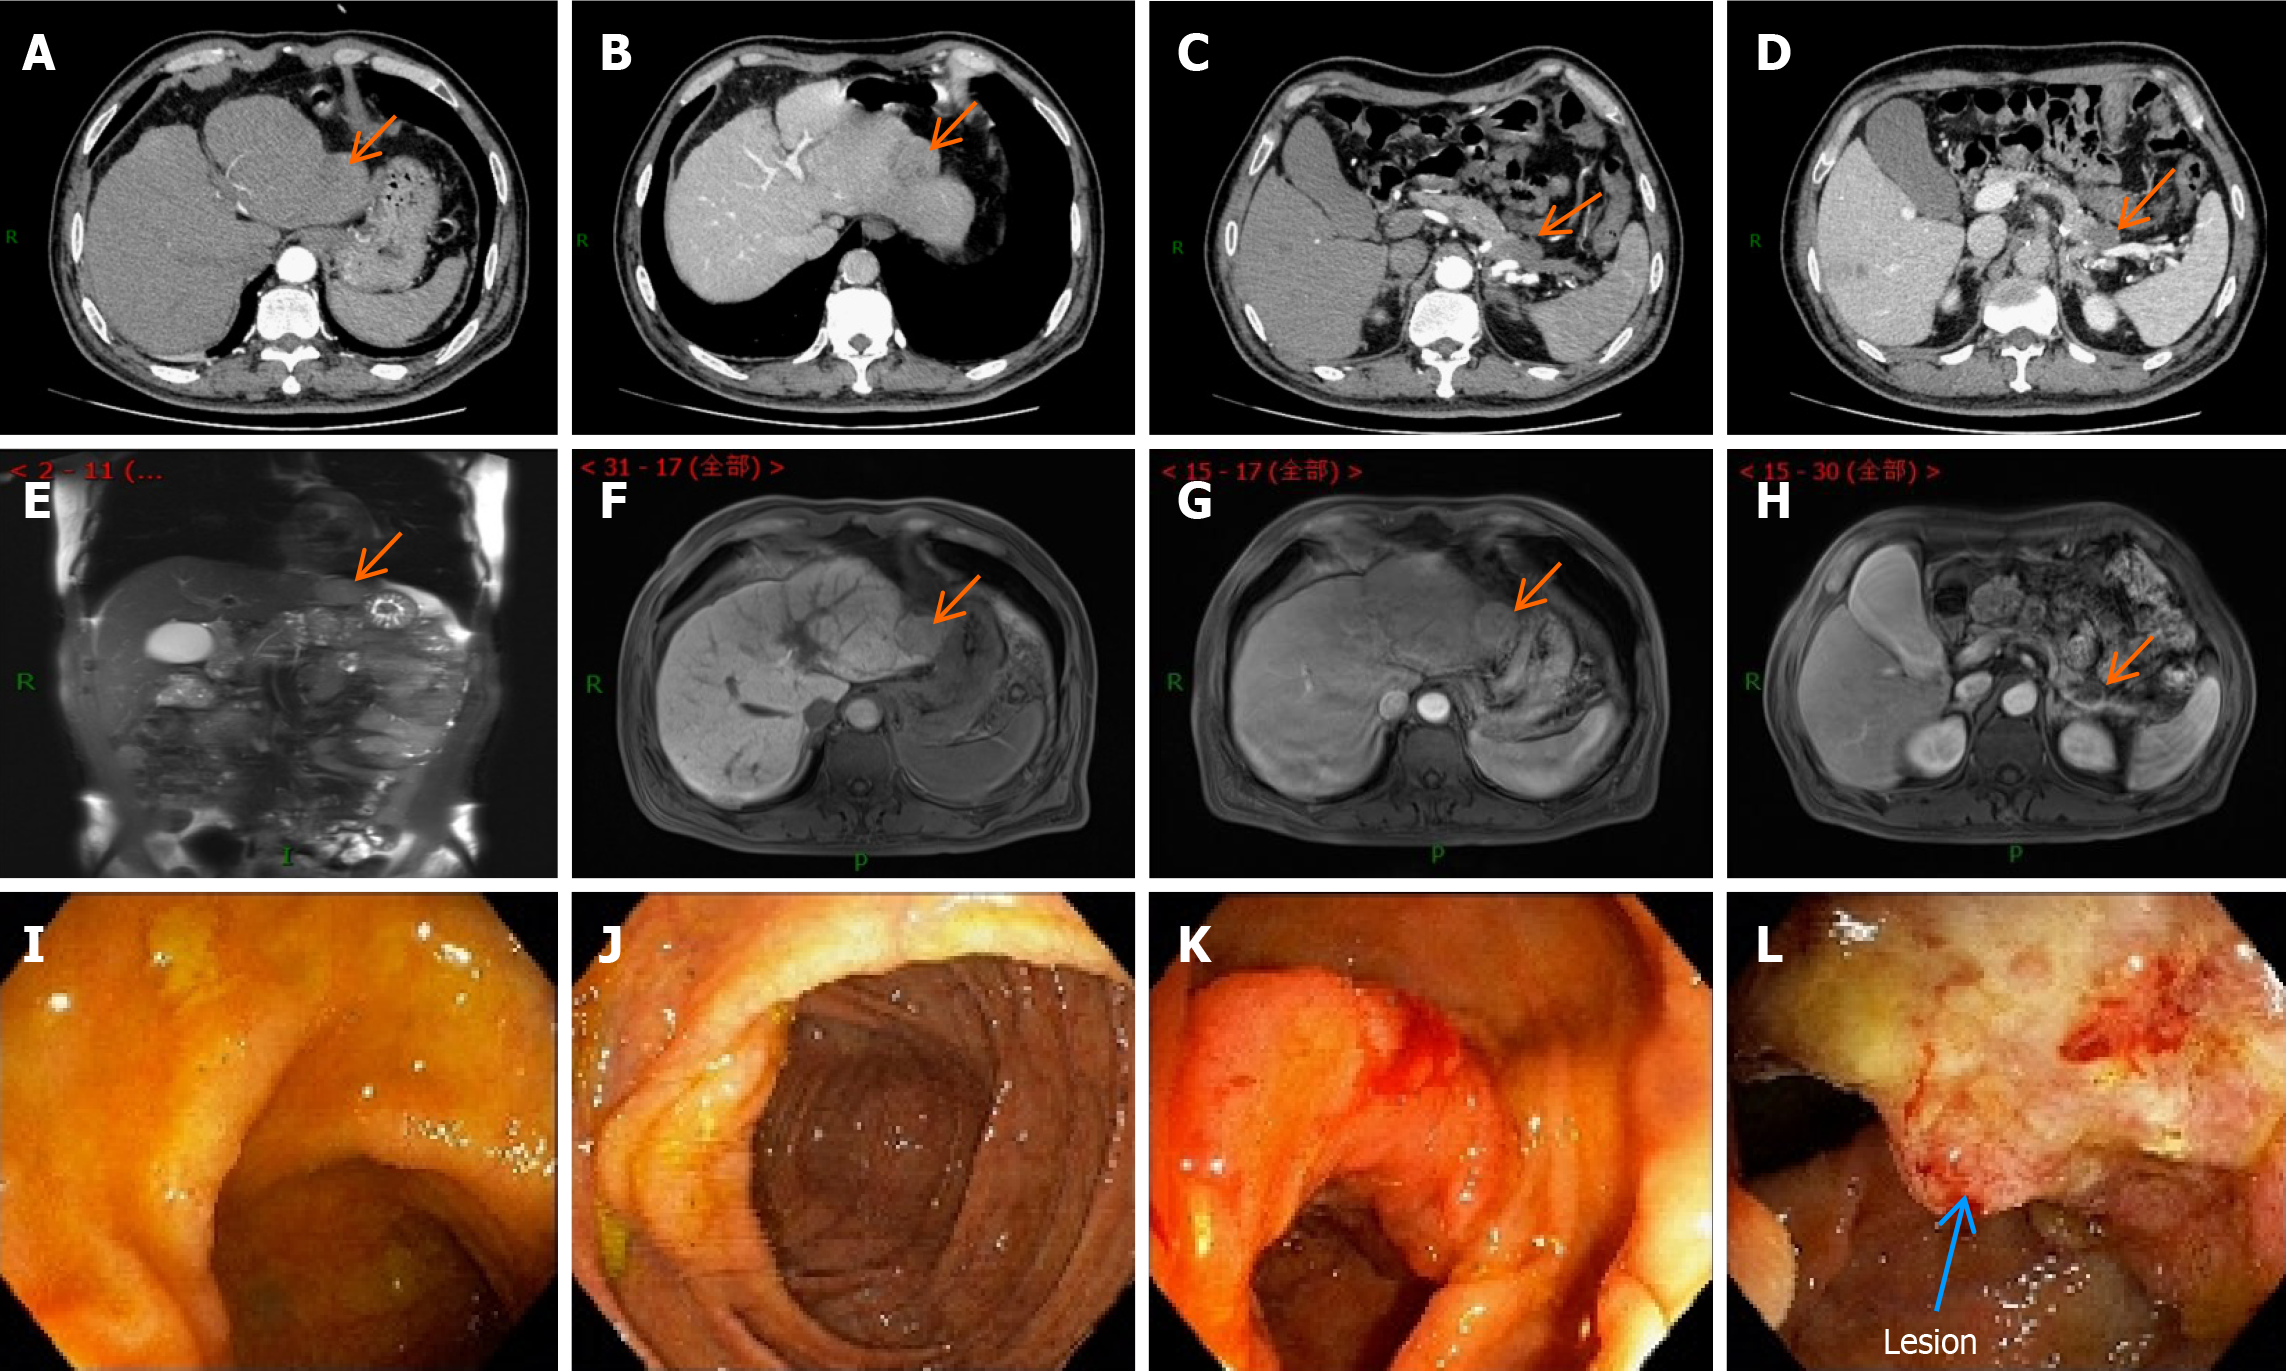
Figure 1 Schematic diagram of the enhanced computed tomography, magnetic resonance imaging, and colonoscopy results before the first surgery.
A: Contrast-enhanced abdominal computed tomography (CT) image of the liver during the arterial phase; B: Contrast-enhanced abdominal CT image of the liver during the portal phase; C: Contrast-enhanced abdominal CT image of the arterial pancreatic lesion; D: Contrast-enhanced abdominal CT image of the arterial pancreatic lesion; E-H: Contrast-enhanced magnetic resonance imaging (MRI) images of the liver and pancreatic foci at different levels. They suggest that the hepatic fissure was widened, and the edge of the liver was not smooth. The left lobe could be seen as a nodular abnormal signal shadow of about 35 mm × 31 mm in size. There was a low signal in T1-weighted image (T1WI) and a high signal in T2WI. There was mild enhancement in the arterial phase after enhancement, which receded in the delayed phase and was considered to be hepatocellular carcinoma. Pancreatic atrophy and the caudal part of the pancreas could be seen as cystic foci of about 25 mm × 28 mm in size. There was a low signal in T1WI and a high signal in T2WI. There was no enhancement in the arterial phase after enhancement, which was considered a cystic adenoma; I: Electron enteroscopic image of the end of the ileum; J: Electron enteroscopic image of the cecum; K: Electron enteroscopic image of the liver region; L: Electron enteroscopic image of the liver region, suggesting neoplasm in the liver region of the colon, a longitudinal change of 3 cm, and narrowing of the intestinal lumen by half. The results of the sampling pathology suggested moderately differentiated adenocarcinoma of the colon.
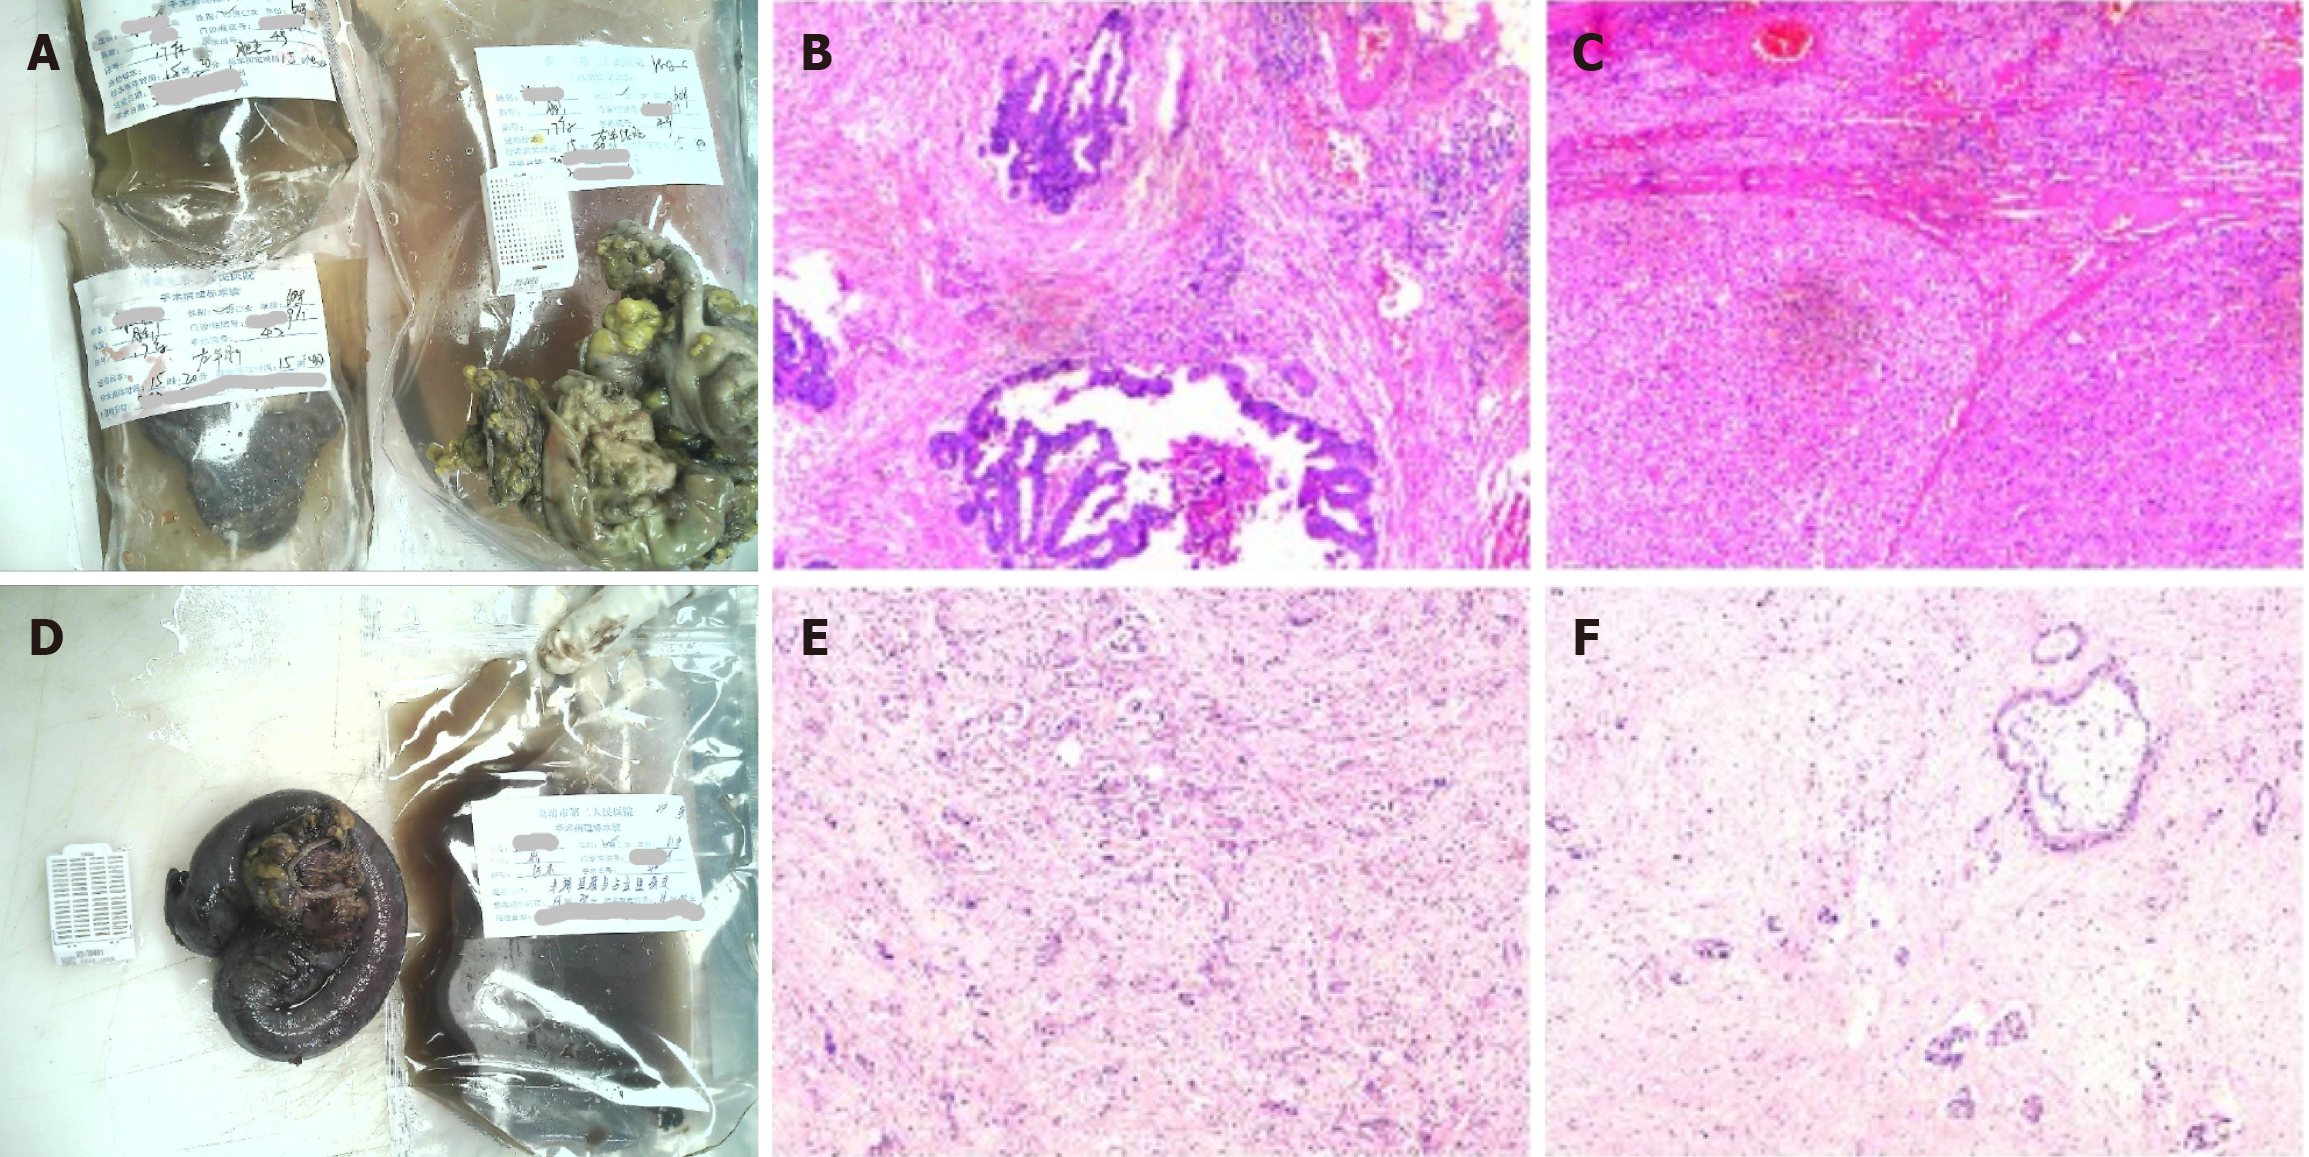
Figure 2 Schematic diagram of the pathological results of the lesions after the first and second operations.
A: Gross images of the first surgery specimen; B and C: Light microscopic images of the first surgery specimen with the following immunohistochemical results: CD34+, D2-40+, CK7-, CK19-, hepatocyte+, CD34+, endothelial vascularization of hepatic sinusoids, carcinoembryonic antigen-. Pathological diagnosis: (Right hemicolon) low-moderately differentiated adenocarcinoma infiltrating the plasma membrane layer in the fibro-fatty tissues (there was choroidal carcinoma embolus and there were no nerve invasion, negative margins, or metastasis in the lymph nodes); (left liver) moderately differentiated hepatocellular carcinoma (there was no choroidal carcinoma embolus or nerve invasion, negative margins, or cirrhotic changes); D: Gross images of the second surgical specimen; E and F: Light microscopic images of the second surgical procedure. The immunohistochemical results were as follows: Tumor cells CK7+, CK20-, villin+, hepatocyte few cells+, glypican-3-, CK8/18+, CDX2 few+, D2-40 lymphatic vessels+, CD34 vascular+, Ki67 hotspot area+ in about 50%-60%. Pathological diagnosis: (Terminal ileum and occupying lesion) moderately-lowly differentiated adenocarcinoma (the tumor invaded the intestinal wall tissue from the plasma membrane upward and focally invaded the mucosal musculature. Combined with the history and immunohistochemistry results, the colonic origin and hepatocellular carcinoma origin were not supported at this time, and pancreatic origin was considered. Moreover, vascular cancer embolism and nerve invasion could be observed in the interior).
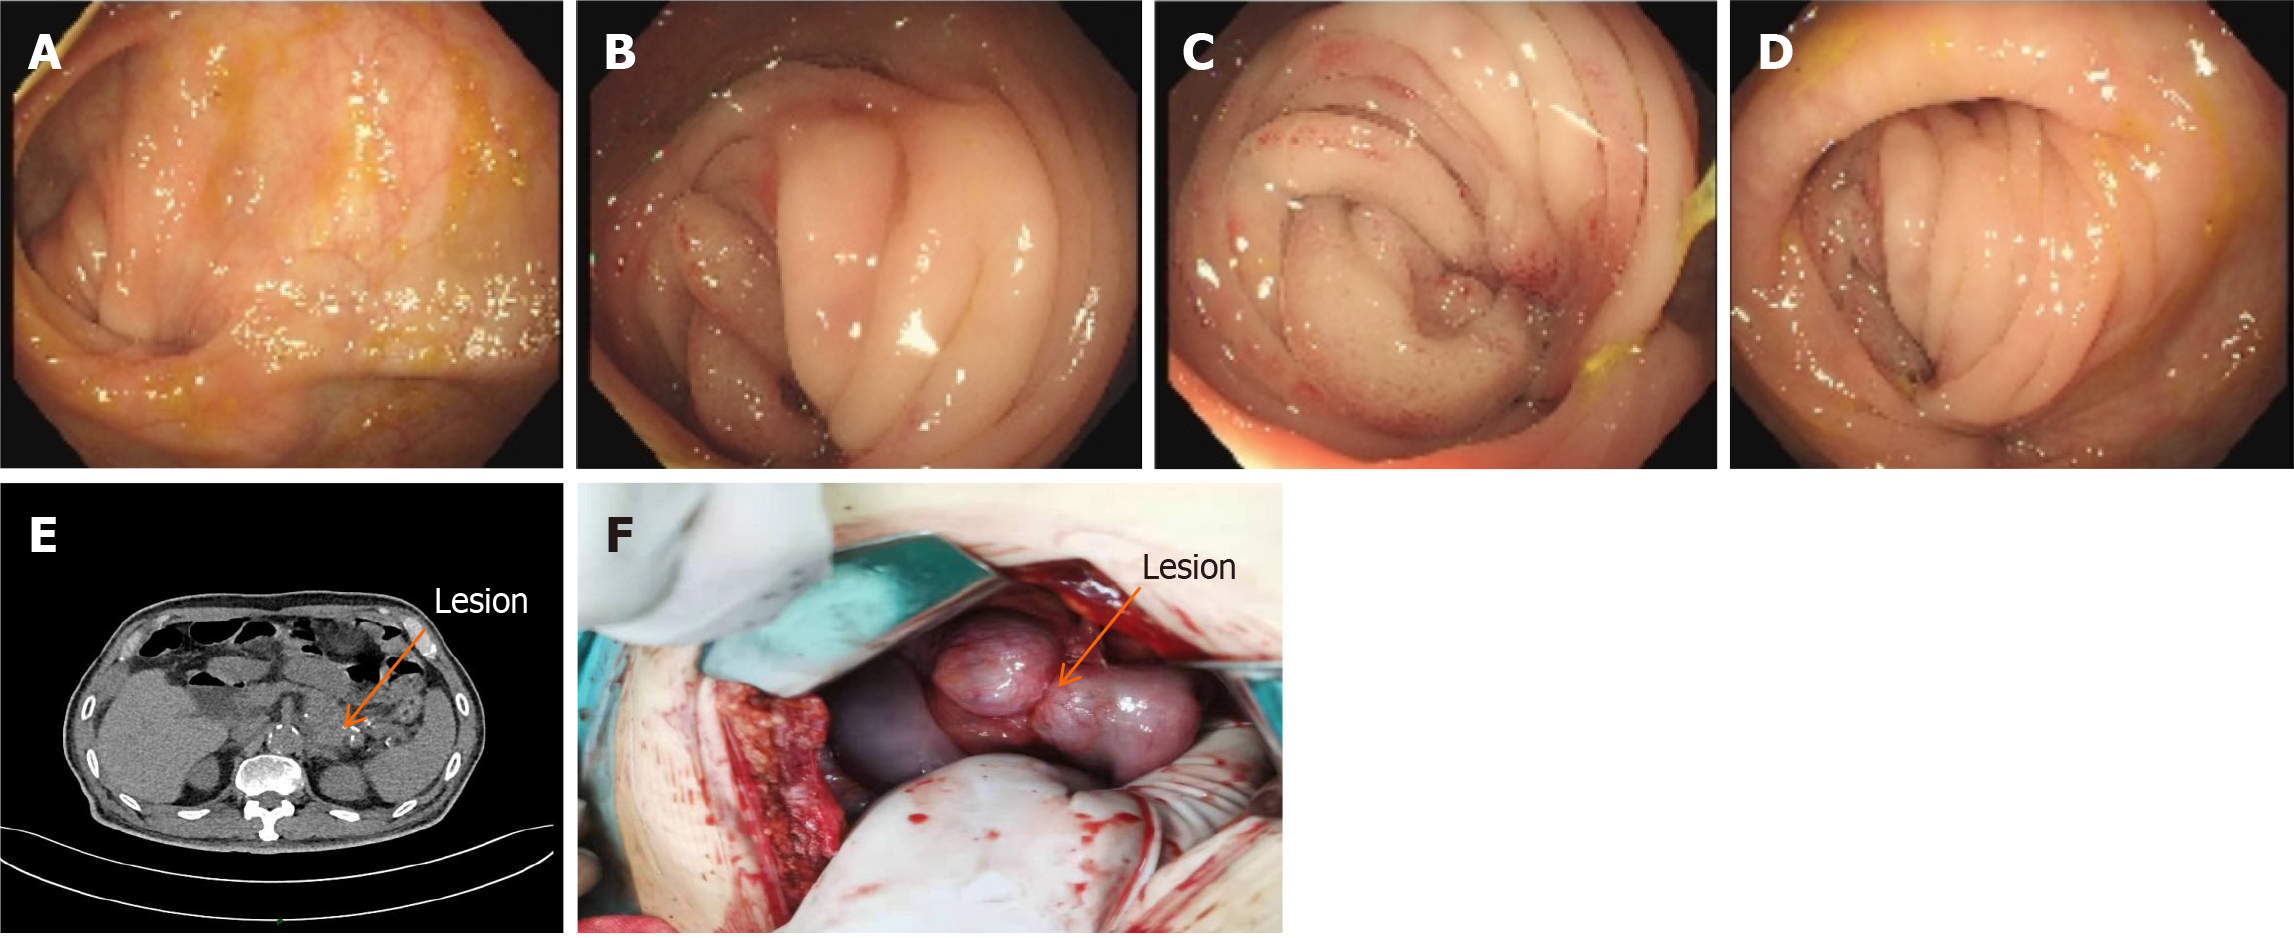
Figure 3 Schematic diagram of the colonoscopic and abdominal computed tomography results before the second operation and the lesion during the operation.
A-D: Entering the scope 70 cm from the anus. Anastomotic changes were visible. There was mucosal congestion and entanglement, and it was difficult to enter the scope; E: Dilatation and pneumatization of the bowel in the upper abdomen. When wide and large air-fluid planes could be seen, intestinal obstruction was considered. When the original lesion in the tail of the pancreas was enlarged compared with the previous one with unclear borders, cystadenoma was considered; F: Intra-operatively, the original anastomosis was found to be entangled and narrowed, and the posterior pancreatic lesion invaded the original anastomosis, which was confirmed by pathological examination.
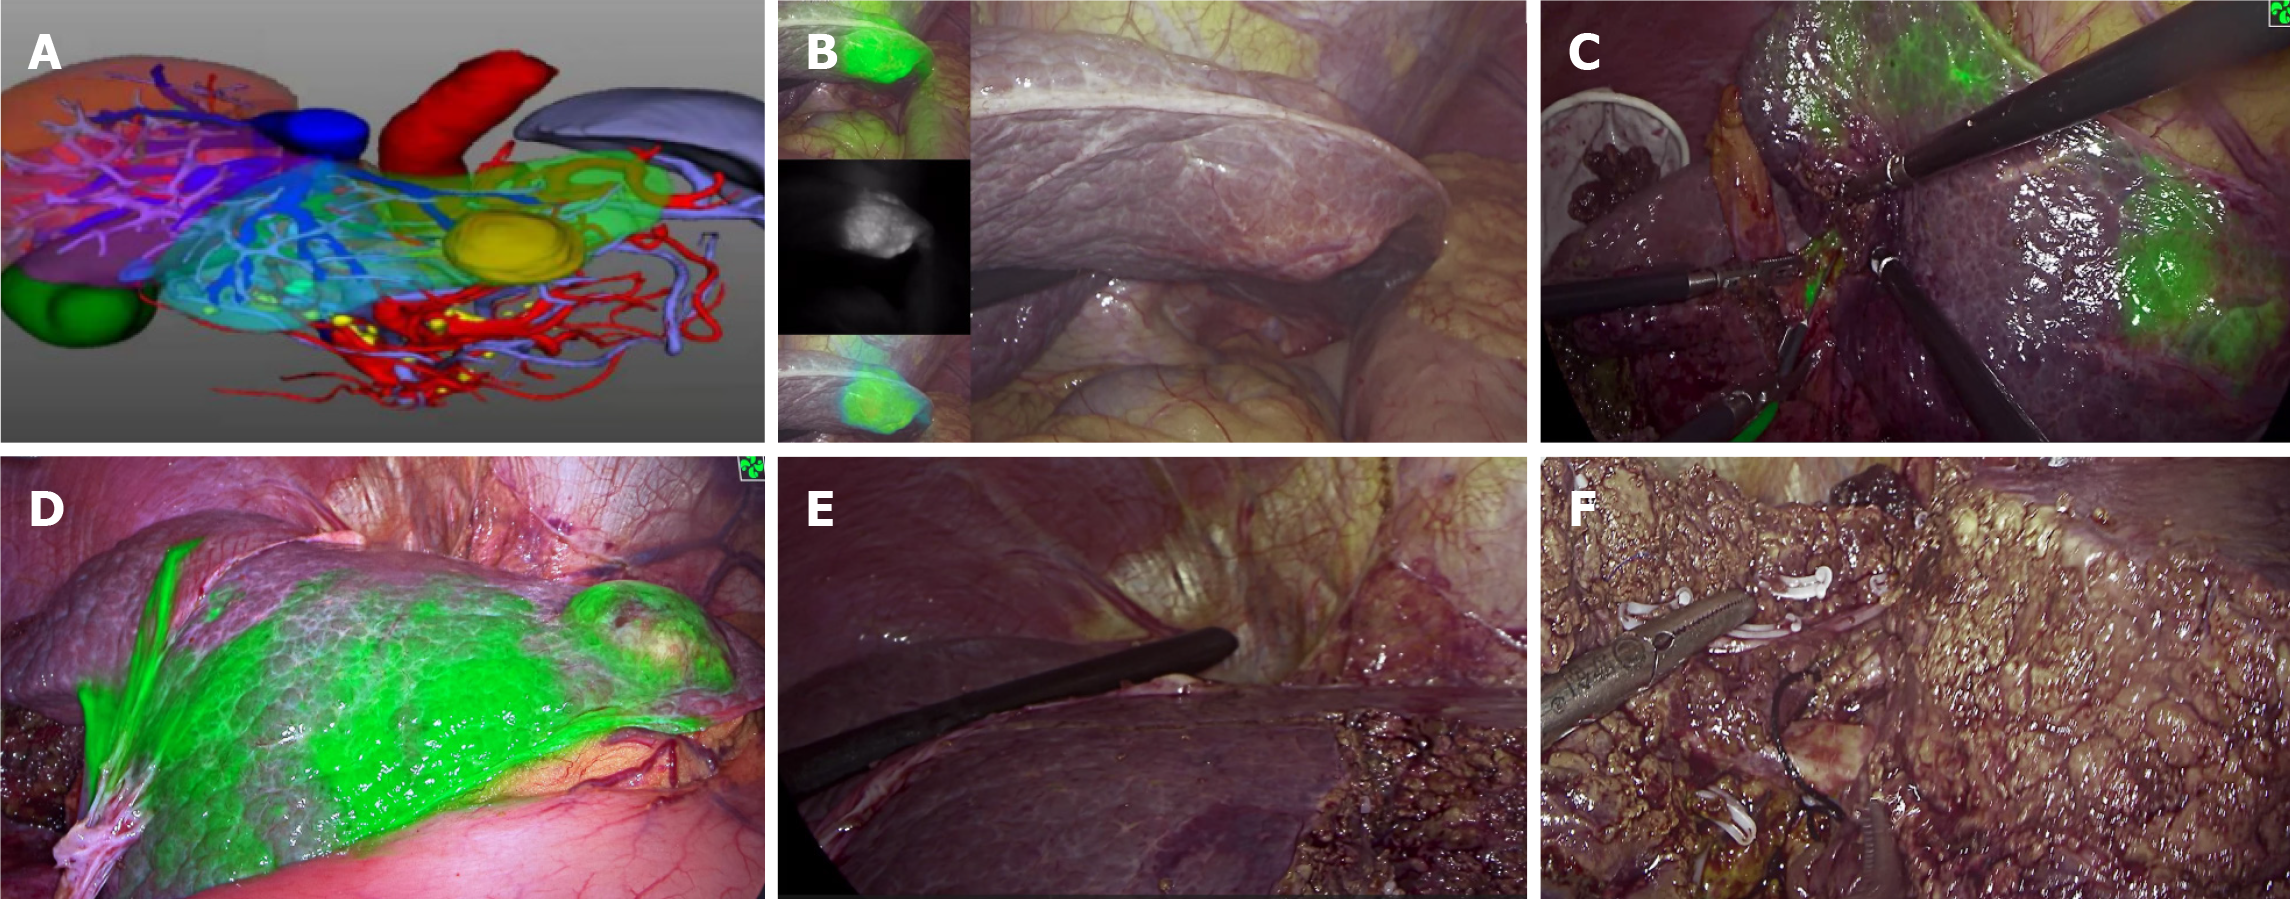
Figure 4 Intraoperative images during the first operation.
A: Preoperative three-dimensional reconstruction for the watershed analysis; B: Different fluorescence modes of liver lesions were visualized, and micrometastases in the liver could be screened simultaneously; C: Indocyanine green was injected into the portal watershed of the S3 segment, and the S3 segment was stained; D: The tumor boundary and boundaries of the S3 and S2 segments were clearly visible; E: Intra-operative ultrasonography was used to investigate the remaining part of the liver. Simultaneously, the location and course of the left hepatic vein were investigated with the aid of ultrasonography, which ensured that the left hepatic vein was intact and exposed; F: Cross-section of the liver after resection of segment S2. The morphology and course of the left hepatic vein could be clearly seen.
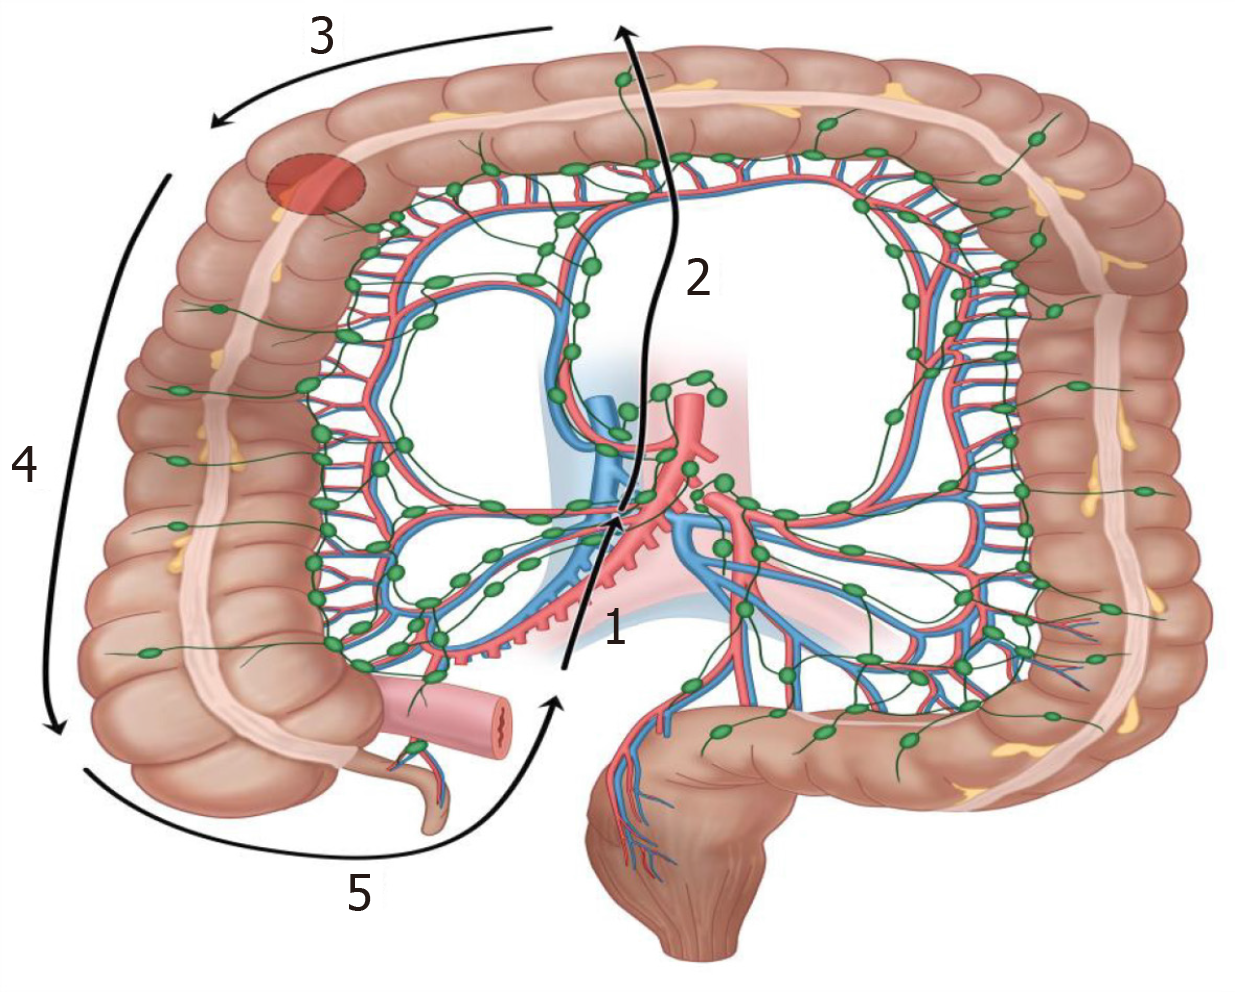
Figure 5 Schematic diagram of the unidirectional loop laparoscopic radical right hemicolectomy pathway for right hemicolectomy using the caudal medial approach during the first operation.
1: Dissect the terminal ileocecal mesentery; 2: Sweep the surgical trunk; 3: Dissect the gastrocolic ligament; 4: Spare the right lateral peritoneum; 5: Free the ileocecal region.
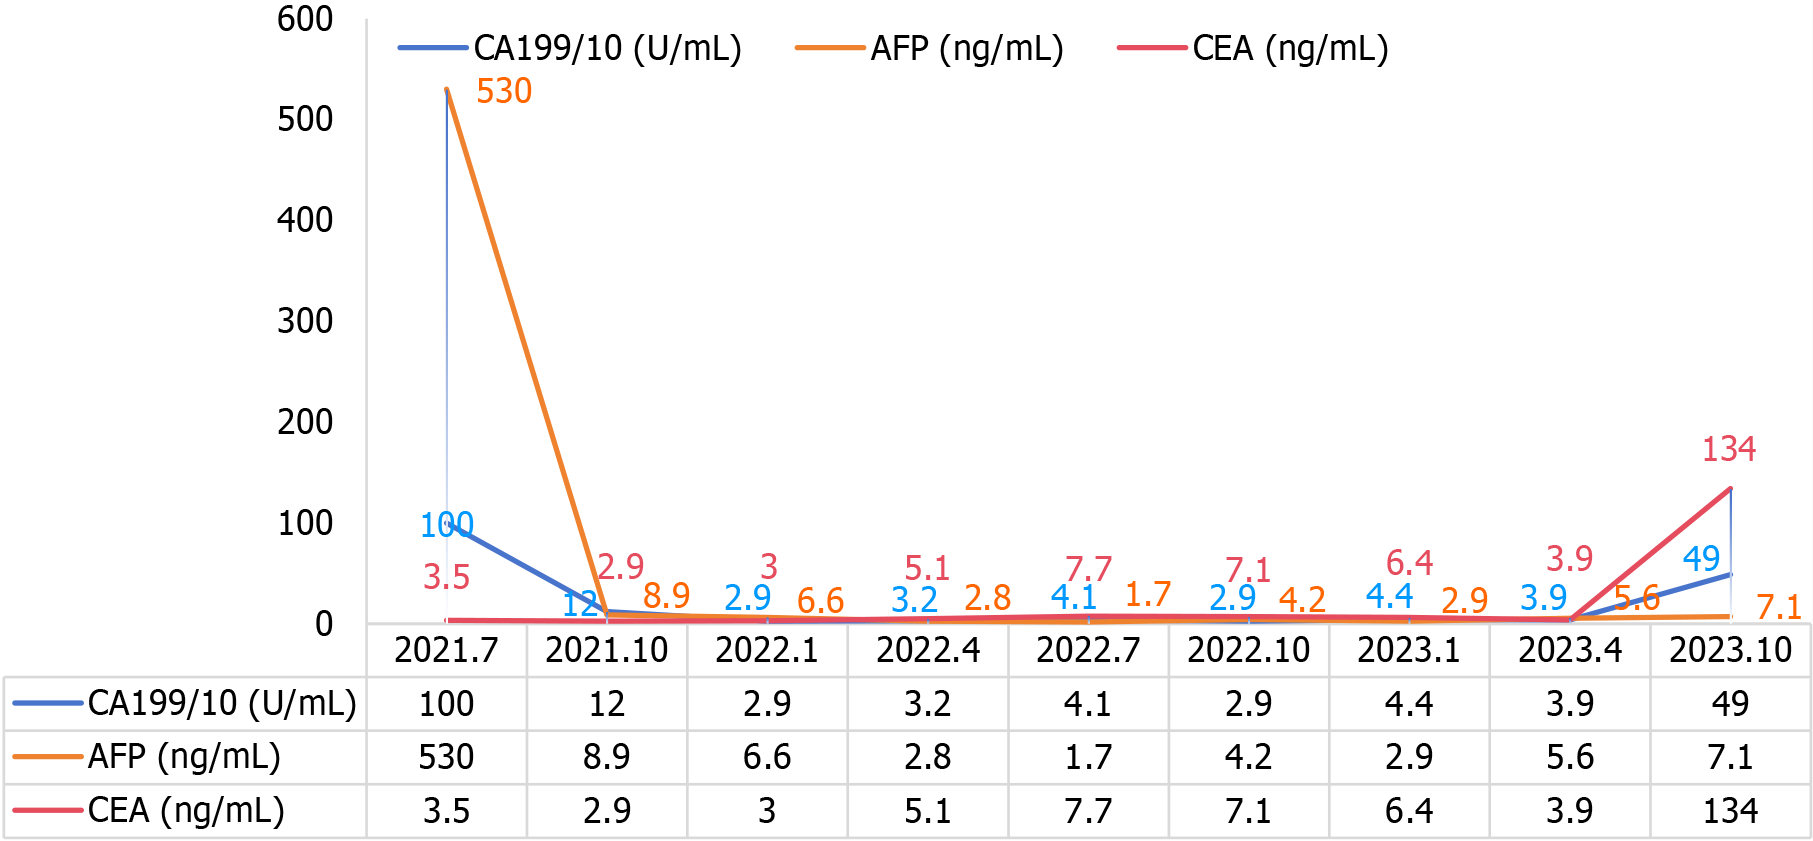
Figure 6 Schematic diagram of the trends of carbohydrate antigen 199, alpha fetoprotein, and carcinoembryonic antigen indices in the follow-up of the disease course.
CA199: Carbohydrate antigen 199; AFP: Alpha fetoprotein; CEA: Carcinoembryonic antigen.
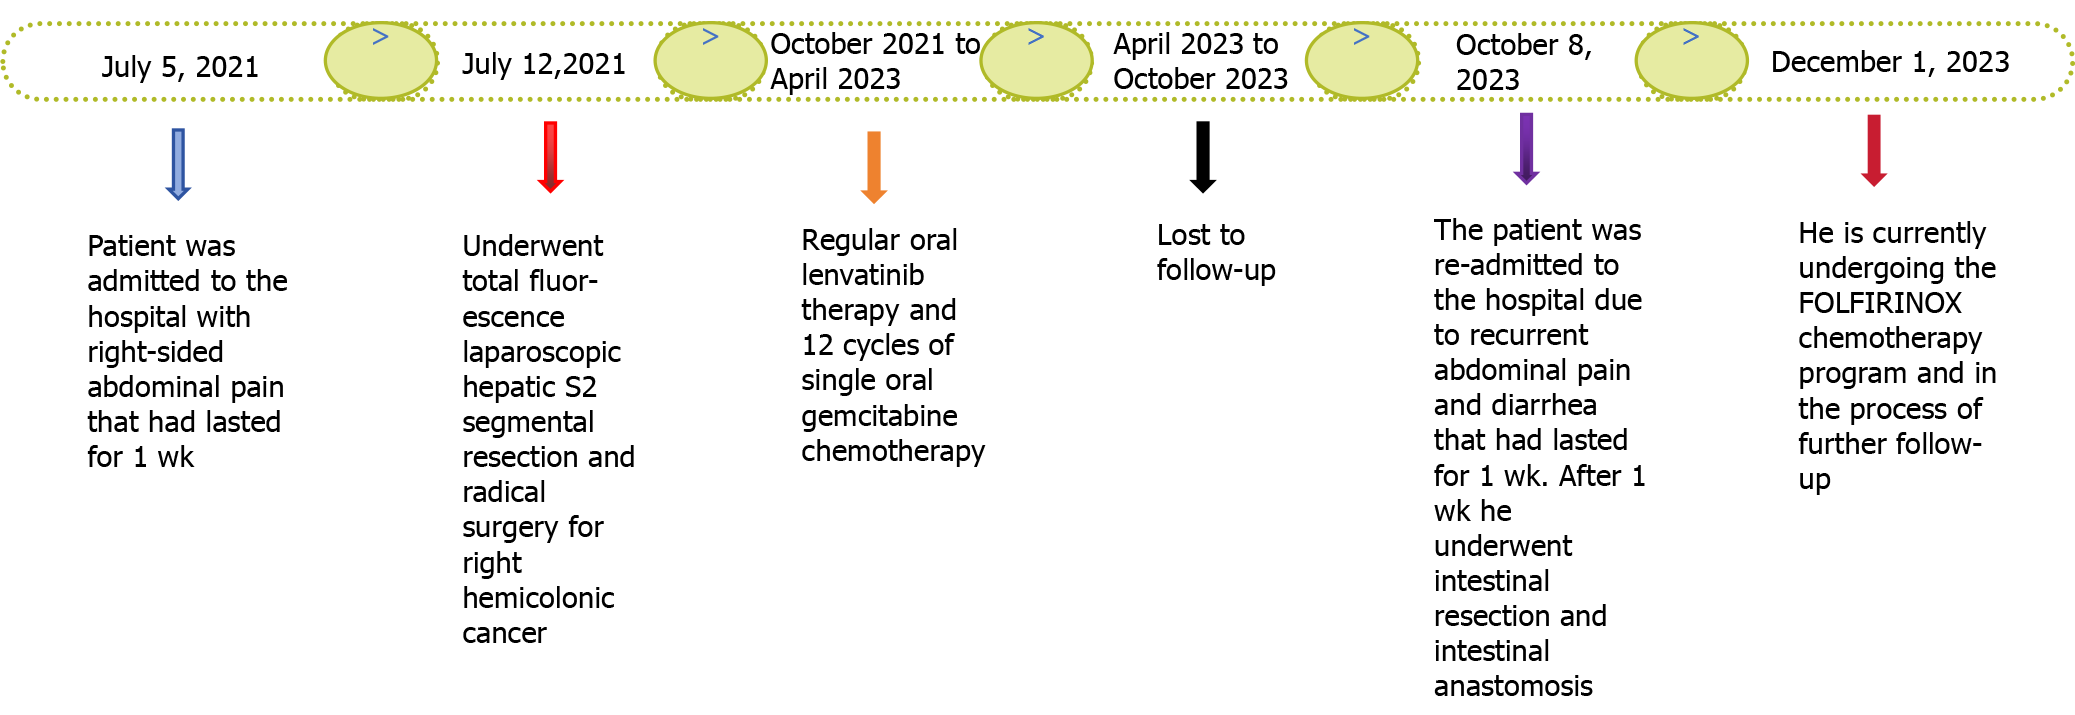
Figure 7
Timeline of the disease progression.
- Citation: Wan DD, Li XJ, Wang XR, Liu TX. Metachronous multifocal carcinoma: A case report. World J Gastrointest Oncol 2024; 16(7): 3350-3356
- URL: https://www.wjgnet.com/1948-5204/full/v16/i7/3350.htm
- DOI: https://dx.doi.org/10.4251/wjgo.v16.i7.3350


