Copyright
©The Author(s) 2024.
World J Gastrointest Oncol. Jul 15, 2024; 16(7): 3284-3298
Published online Jul 15, 2024. doi: 10.4251/wjgo.v16.i7.3284
Published online Jul 15, 2024. doi: 10.4251/wjgo.v16.i7.3284
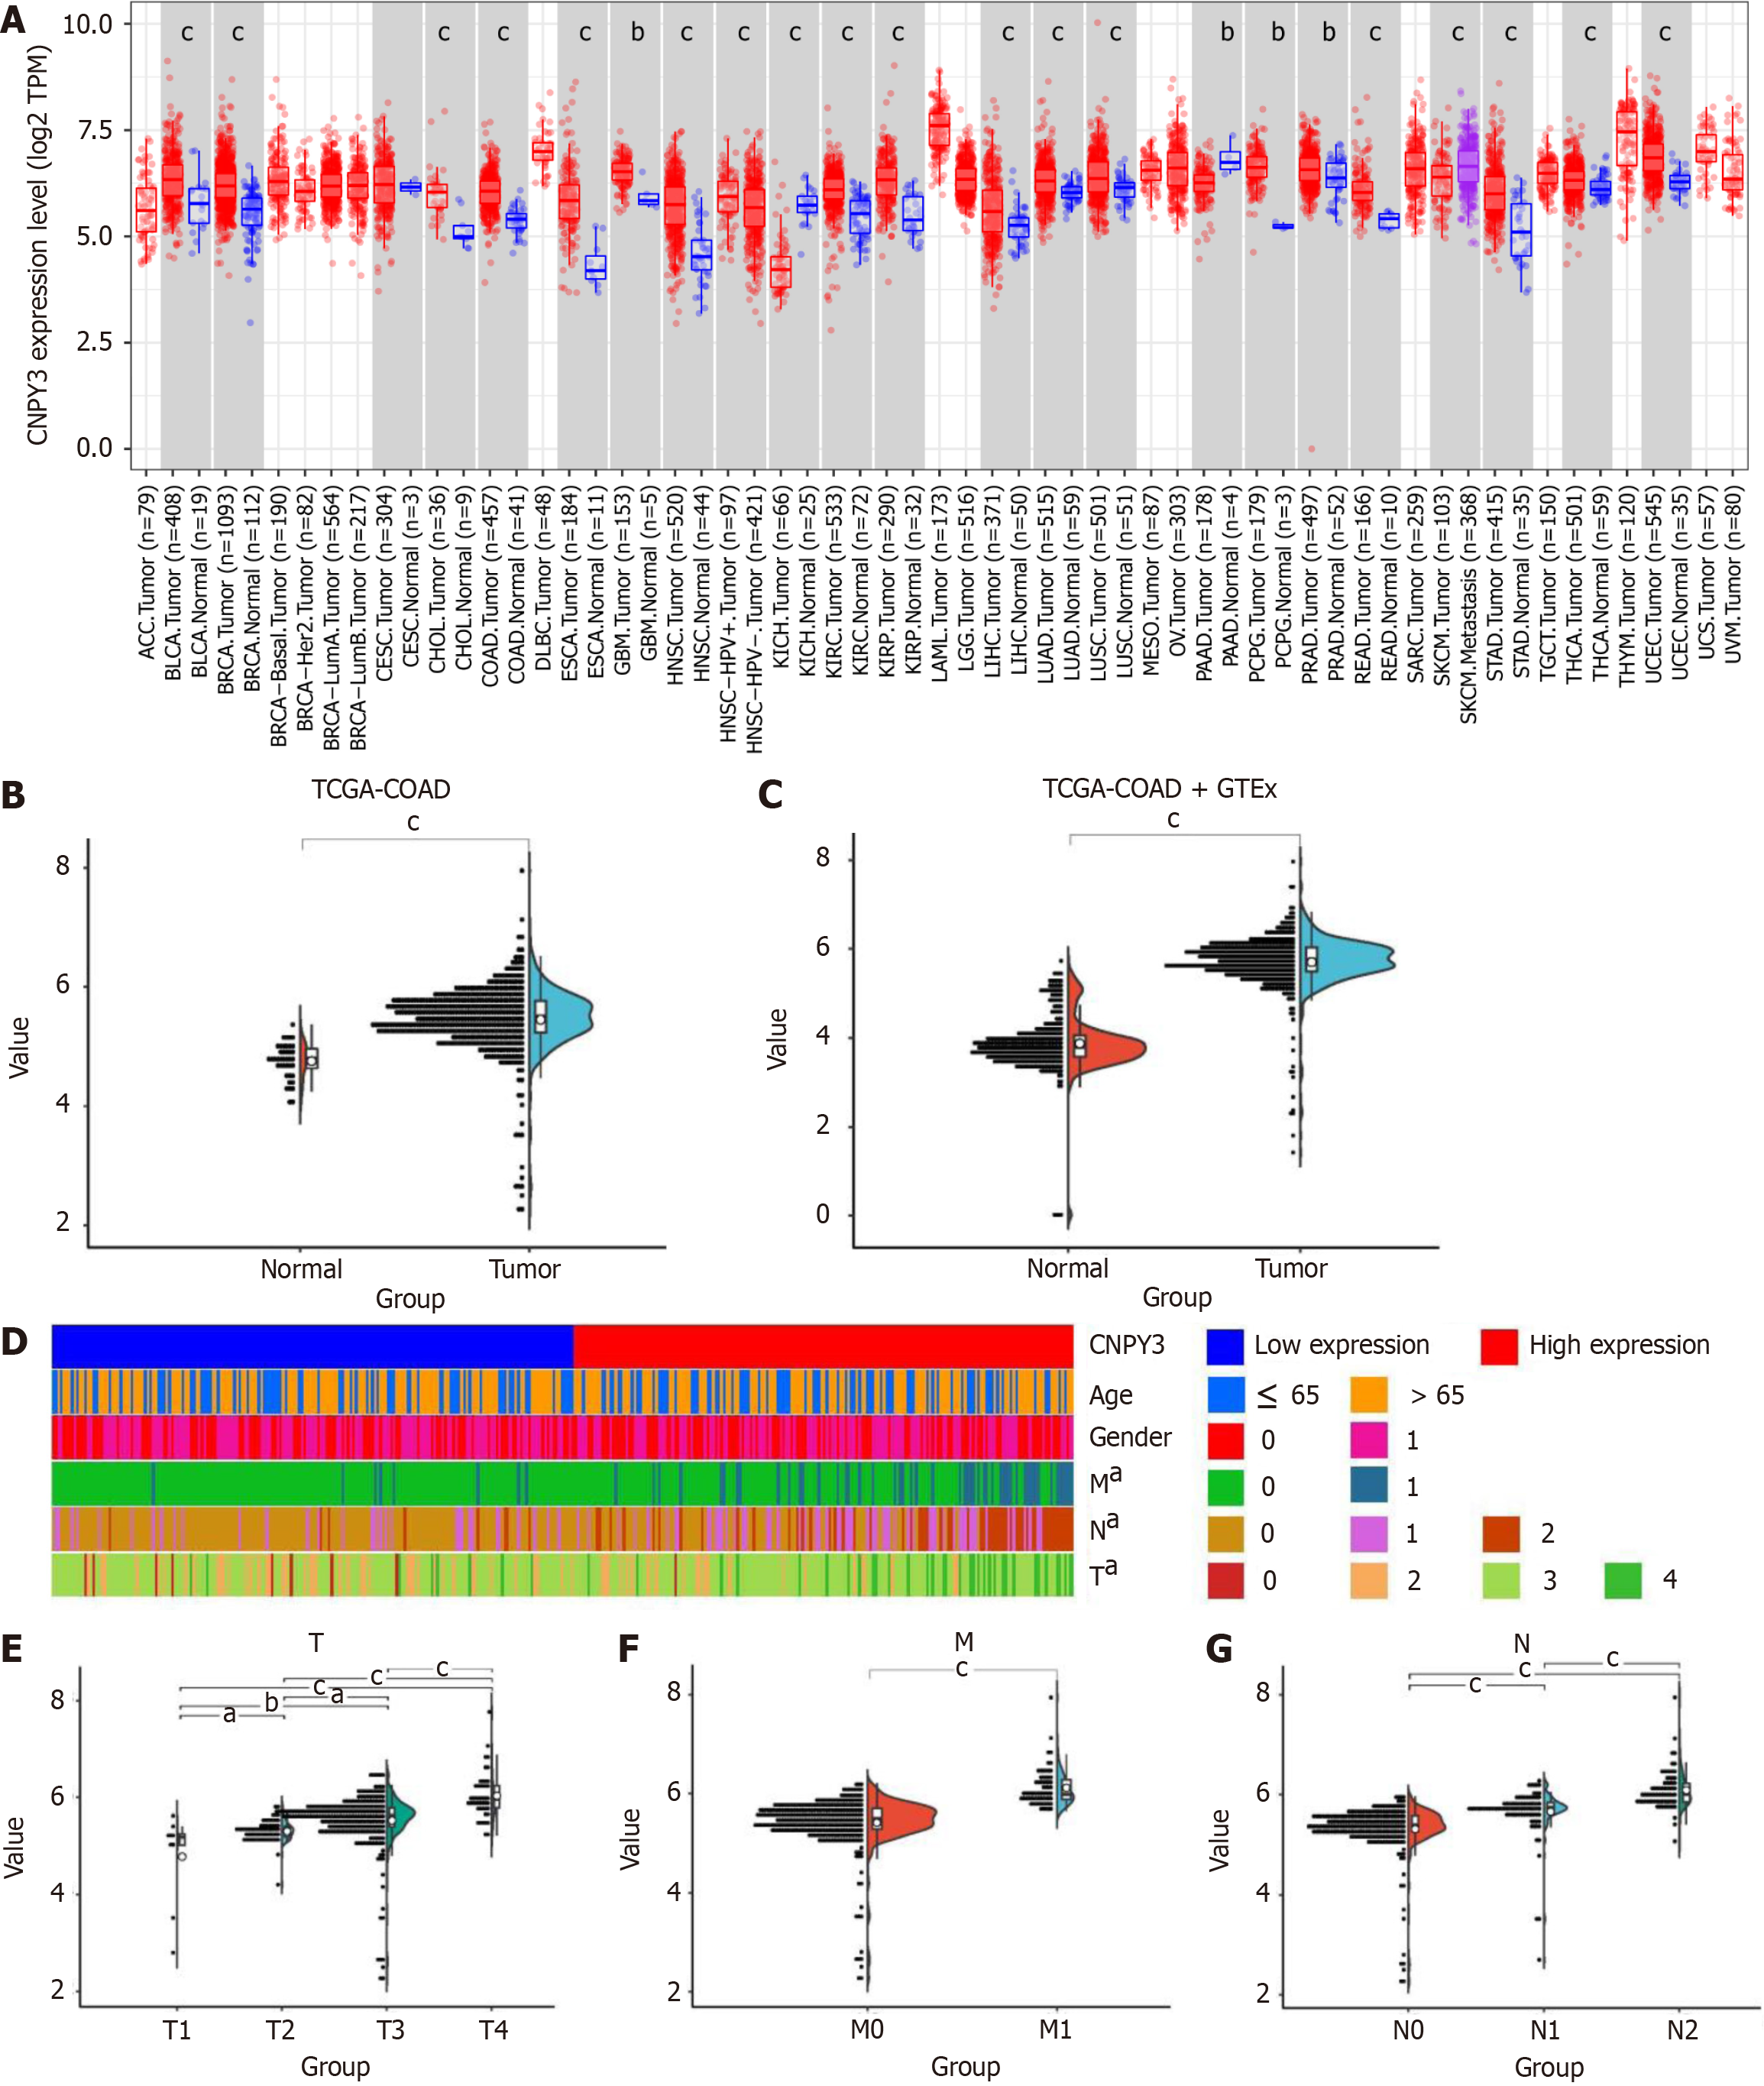
Figure 1 Expression levels of canopy FGF signaling regulator 3 in pan-cancer and Cancer Genome Atlas colon adenocarcinoma cohort.
A: Canopy FGF signaling regulator 3 (CNPY3) was highly expressed in several digestive system cancers; B: CNPY3 was highly expressed in Cancer Genome Atlas (TCGA)-colon adenocarcinoma cohort; C: CNPY3 was highly expressed in merged dataset (Genotype Tissue Expression normal, TCGA normal, and TCGA cancer); D: Heatmap of associations between CNPY3 expression and clinicopathological features; E: Correlation between CNPY3 expression and T stage. F: Correlation between CNPY3 expression and M stage; G: Correlation between CNPY3 expression and N stage. aP < 0.05; bP < 0.01, cP < 0.001. CNPY3: Canopy FGF signaling regulator 3; TCGA: The Cancer Genome Atlas; COAD: Colon adenocarcinoma; GTEx: Genotype Tissue Expression.
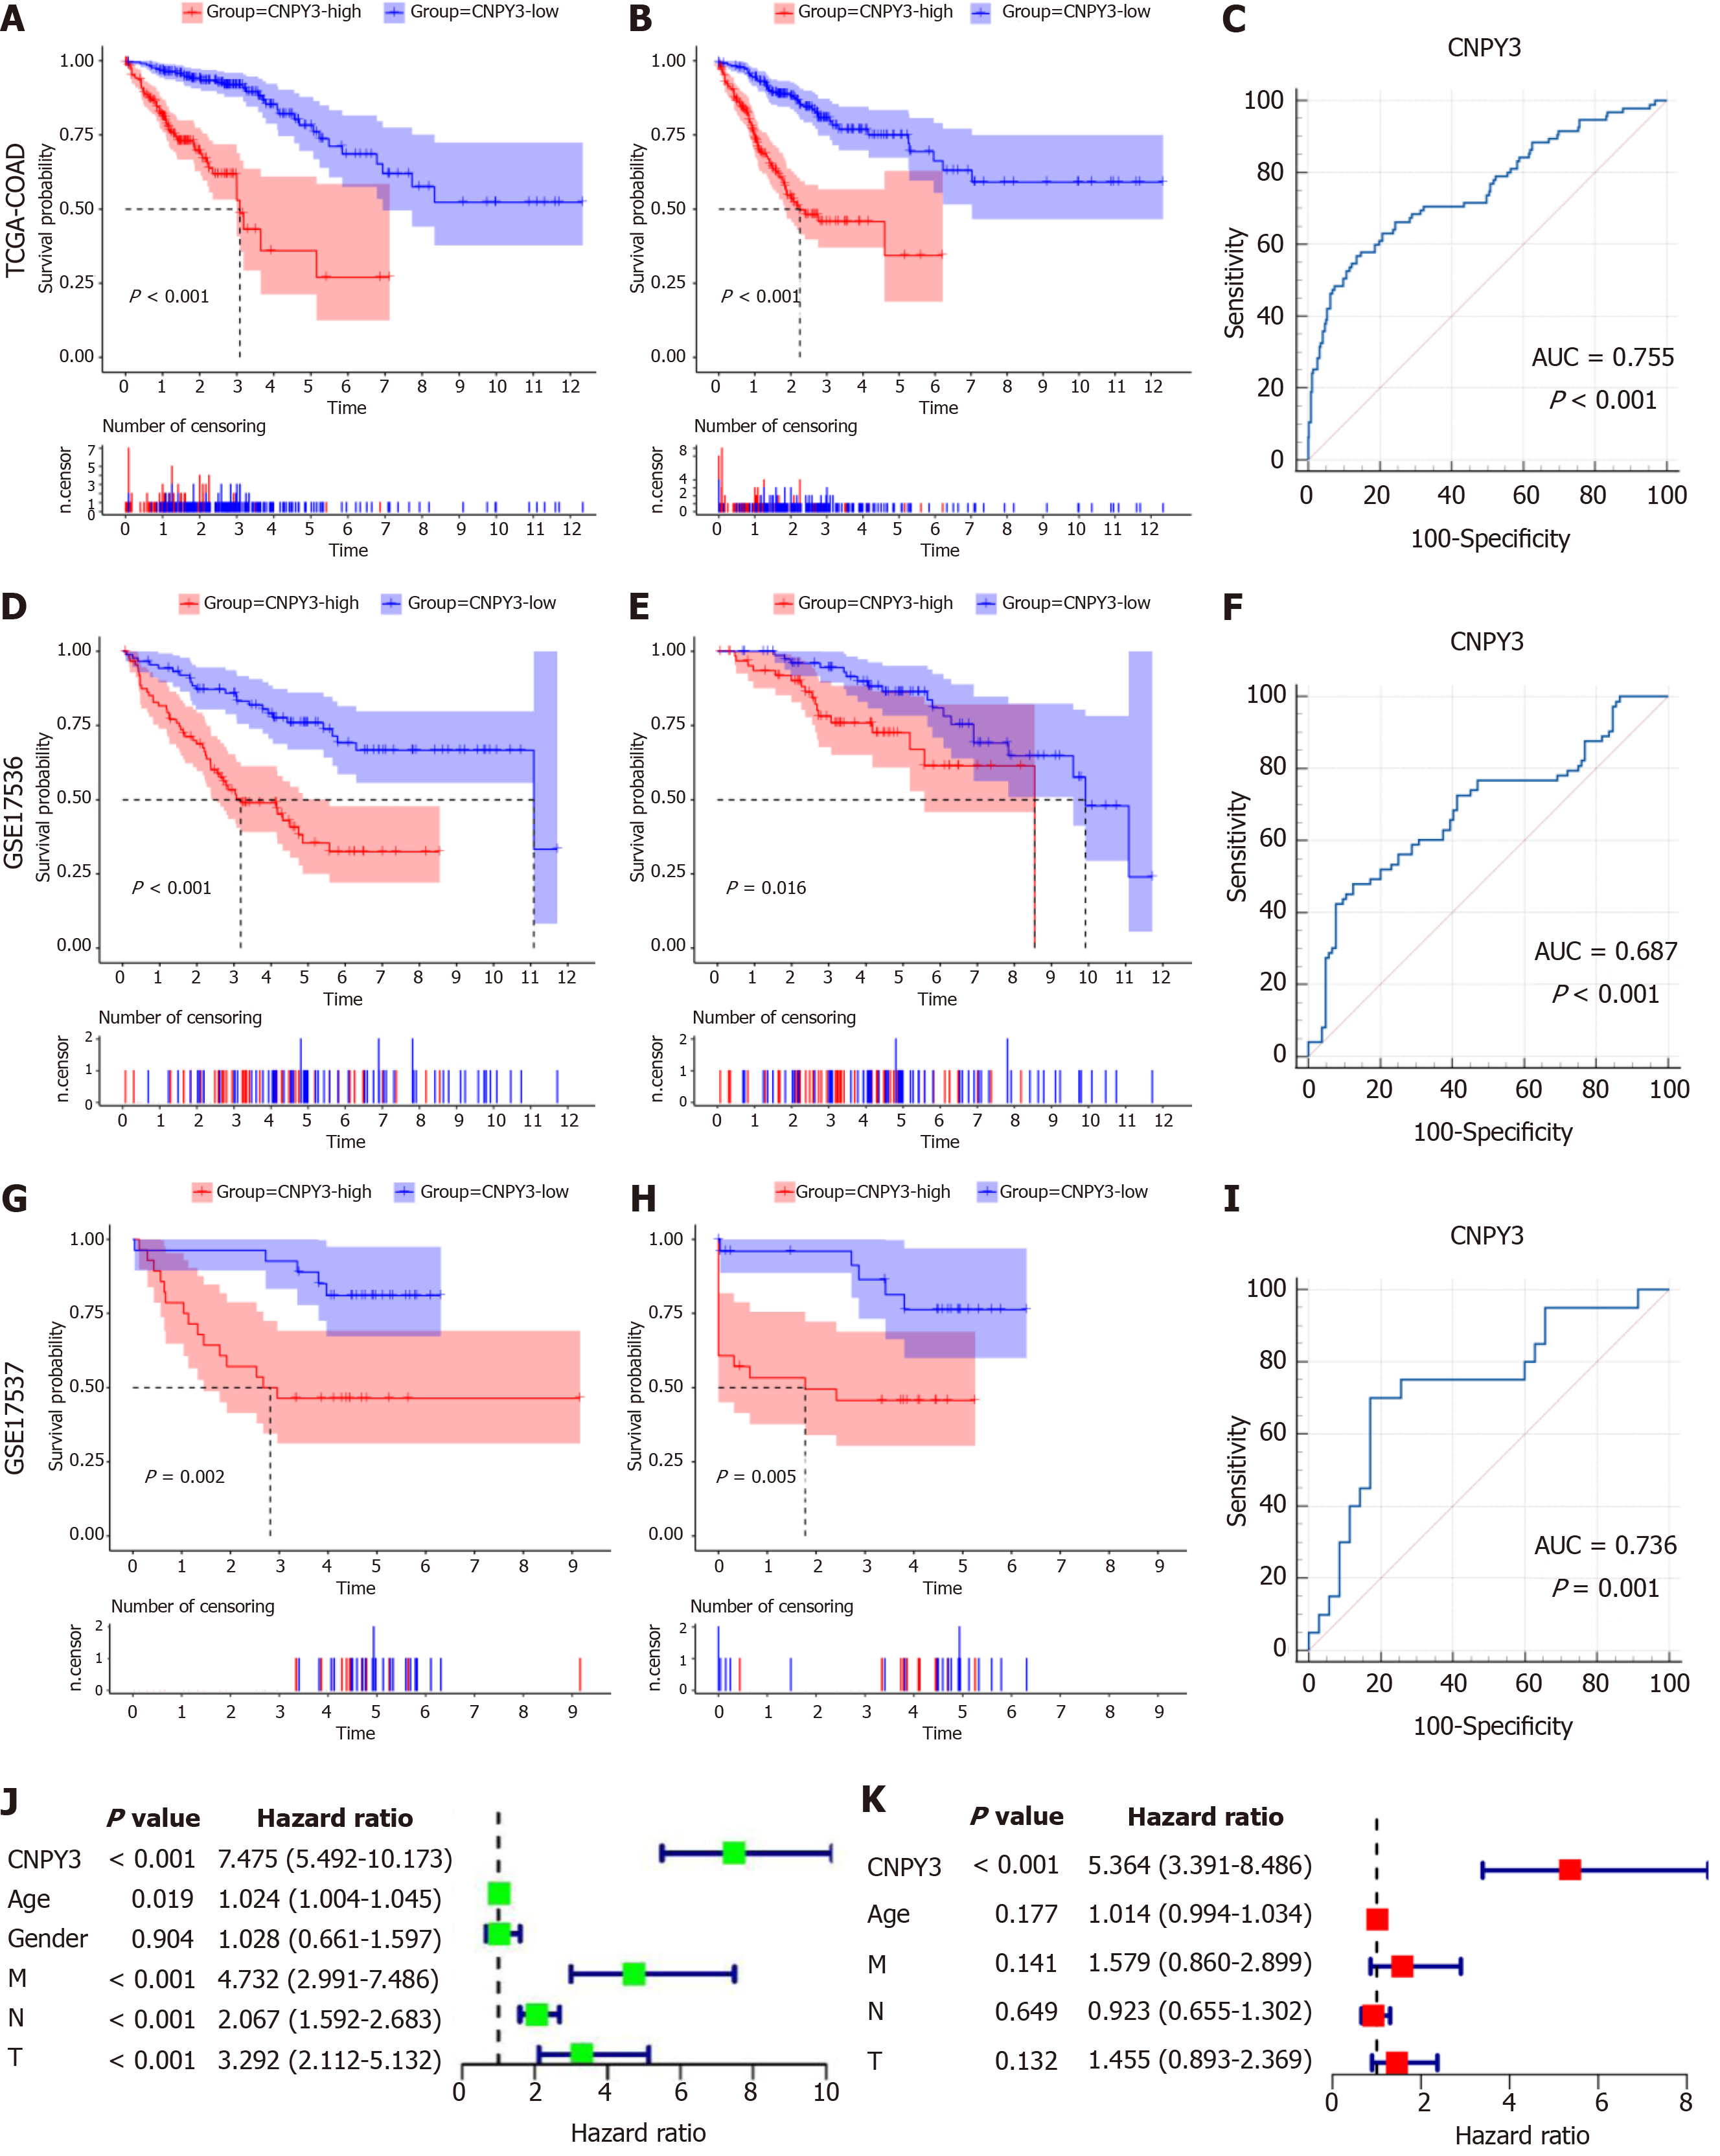
Figure 2 Prognostic analysis of canopy FGF signaling regulator 3.
A: Overall survival (OS) curve of Cancer Genome Atlas (TCGA)-colon adenocarcinoma (COAD) cohort; B: Progression-free survival (PFS) curve of TCGA-COAD cohort; C: Receiver operating characteristic (ROC) curve of TCGA-COAD cohort [area under curve (AUC) = 0.755]; D: OS curve of GSE17536 cohort; E: PFS curve of GSE17536 cohort; F: ROC curve of GSE17536 cohort (AUC = 0.687); G: OS curve of GSE17537 cohort; H: PFS curve of GSE17537 cohort; I: ROC curve of GSE17537 cohort (AUC = 0.736); J: Univariate regression analysis; K: Multivariate regression analysis. CNPY3: Canopy FGF signaling regulator 3; TCGA: The Cancer Genome Atlas; COAD: Colon adenocarcinoma; GTEx: Genotype Tissue Expression.
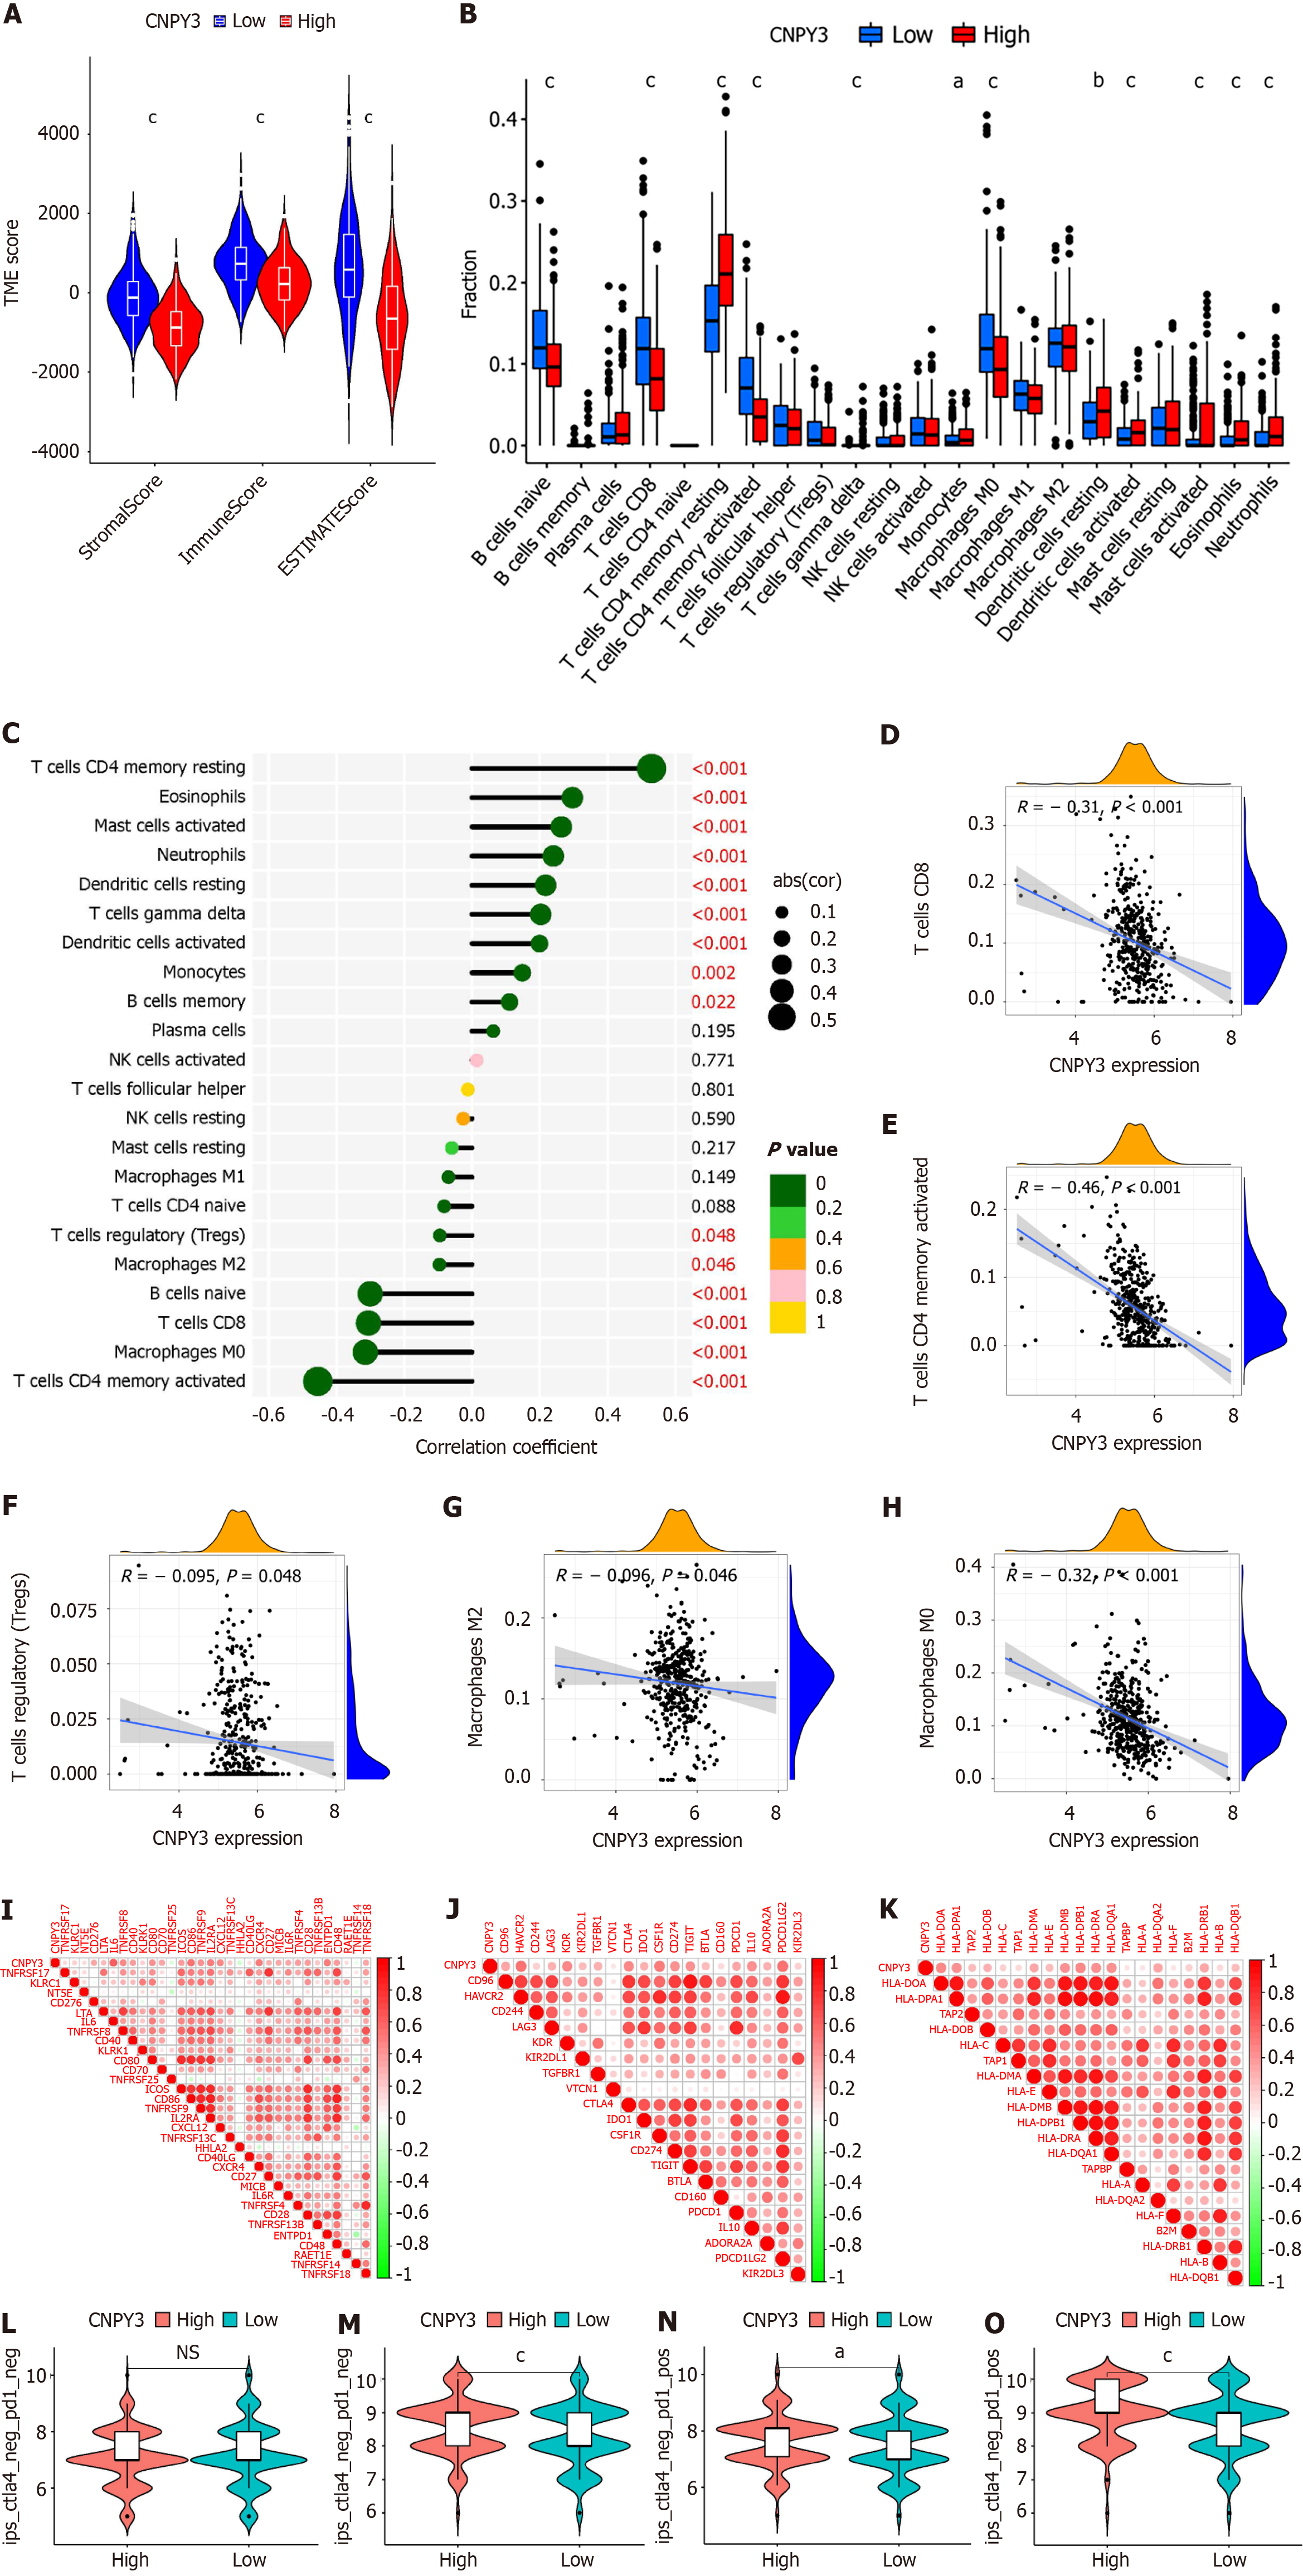
Figure 3 Immune correlation analysis.
A: Differences in immune microenvironment-related indexes (stomal, immune, and ESTIMATE scores); B: Differences in immune cell infiltration; C: Correlations between canopy FGF signaling regulator 3 (CNPY3) expression and immune cell infiltration; D-H: Correlations between CNPY3 expression and activated CD8+ T cells (D), CD4+ T cells (E), regulatory T cells (F), M2 macrophages (G), and M0 macrophages (H); I-K: Correlations between CNPY3 expression and expression of immunostimulatory factors (I), immune inhibitors (J), and MHC molecules (K); L-O: Patient response to immune checkpoint inhibitors. aP < 0.05; bP < 0.01, cP < 0.001, NS: Not significant; CNPY3: Canopy FGF signaling regulator 3.
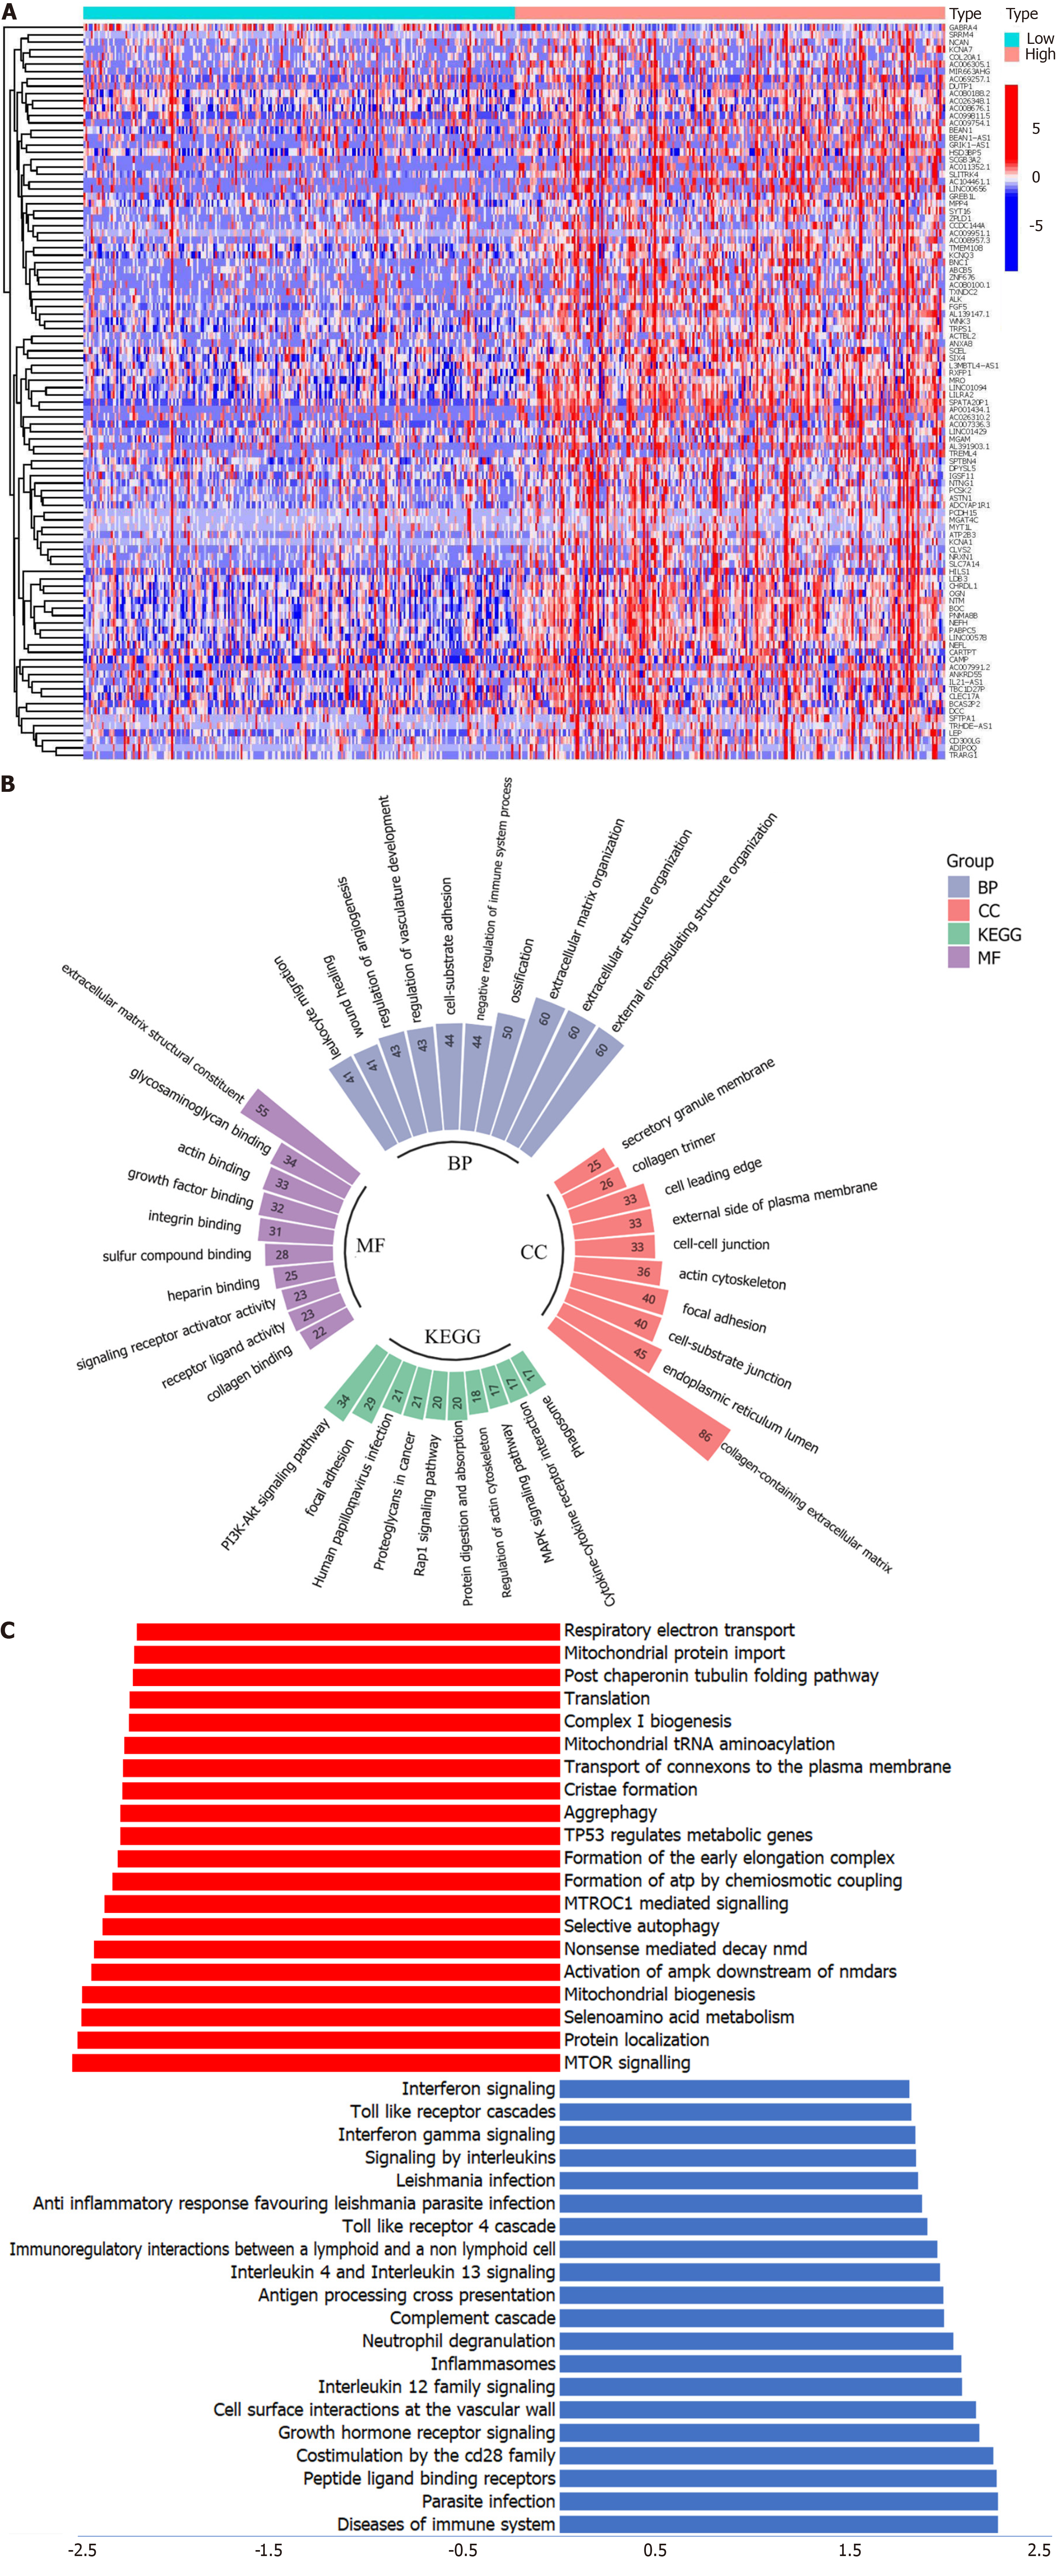
Figure 4 Functional enrichment analysis.
A: Top 50 differently expressed genes (DEGs); B: Gene Ontology and Kyoto Encyclopedia of Genes and Genomes analysis of DEGs; C: Gene Set Enrichment Analysis enrichment analysis. BP: Biological process; CC: Cellular component; MF: Molecular function; KEGG: Kyoto Encyclopedia of Genes and Genomes.
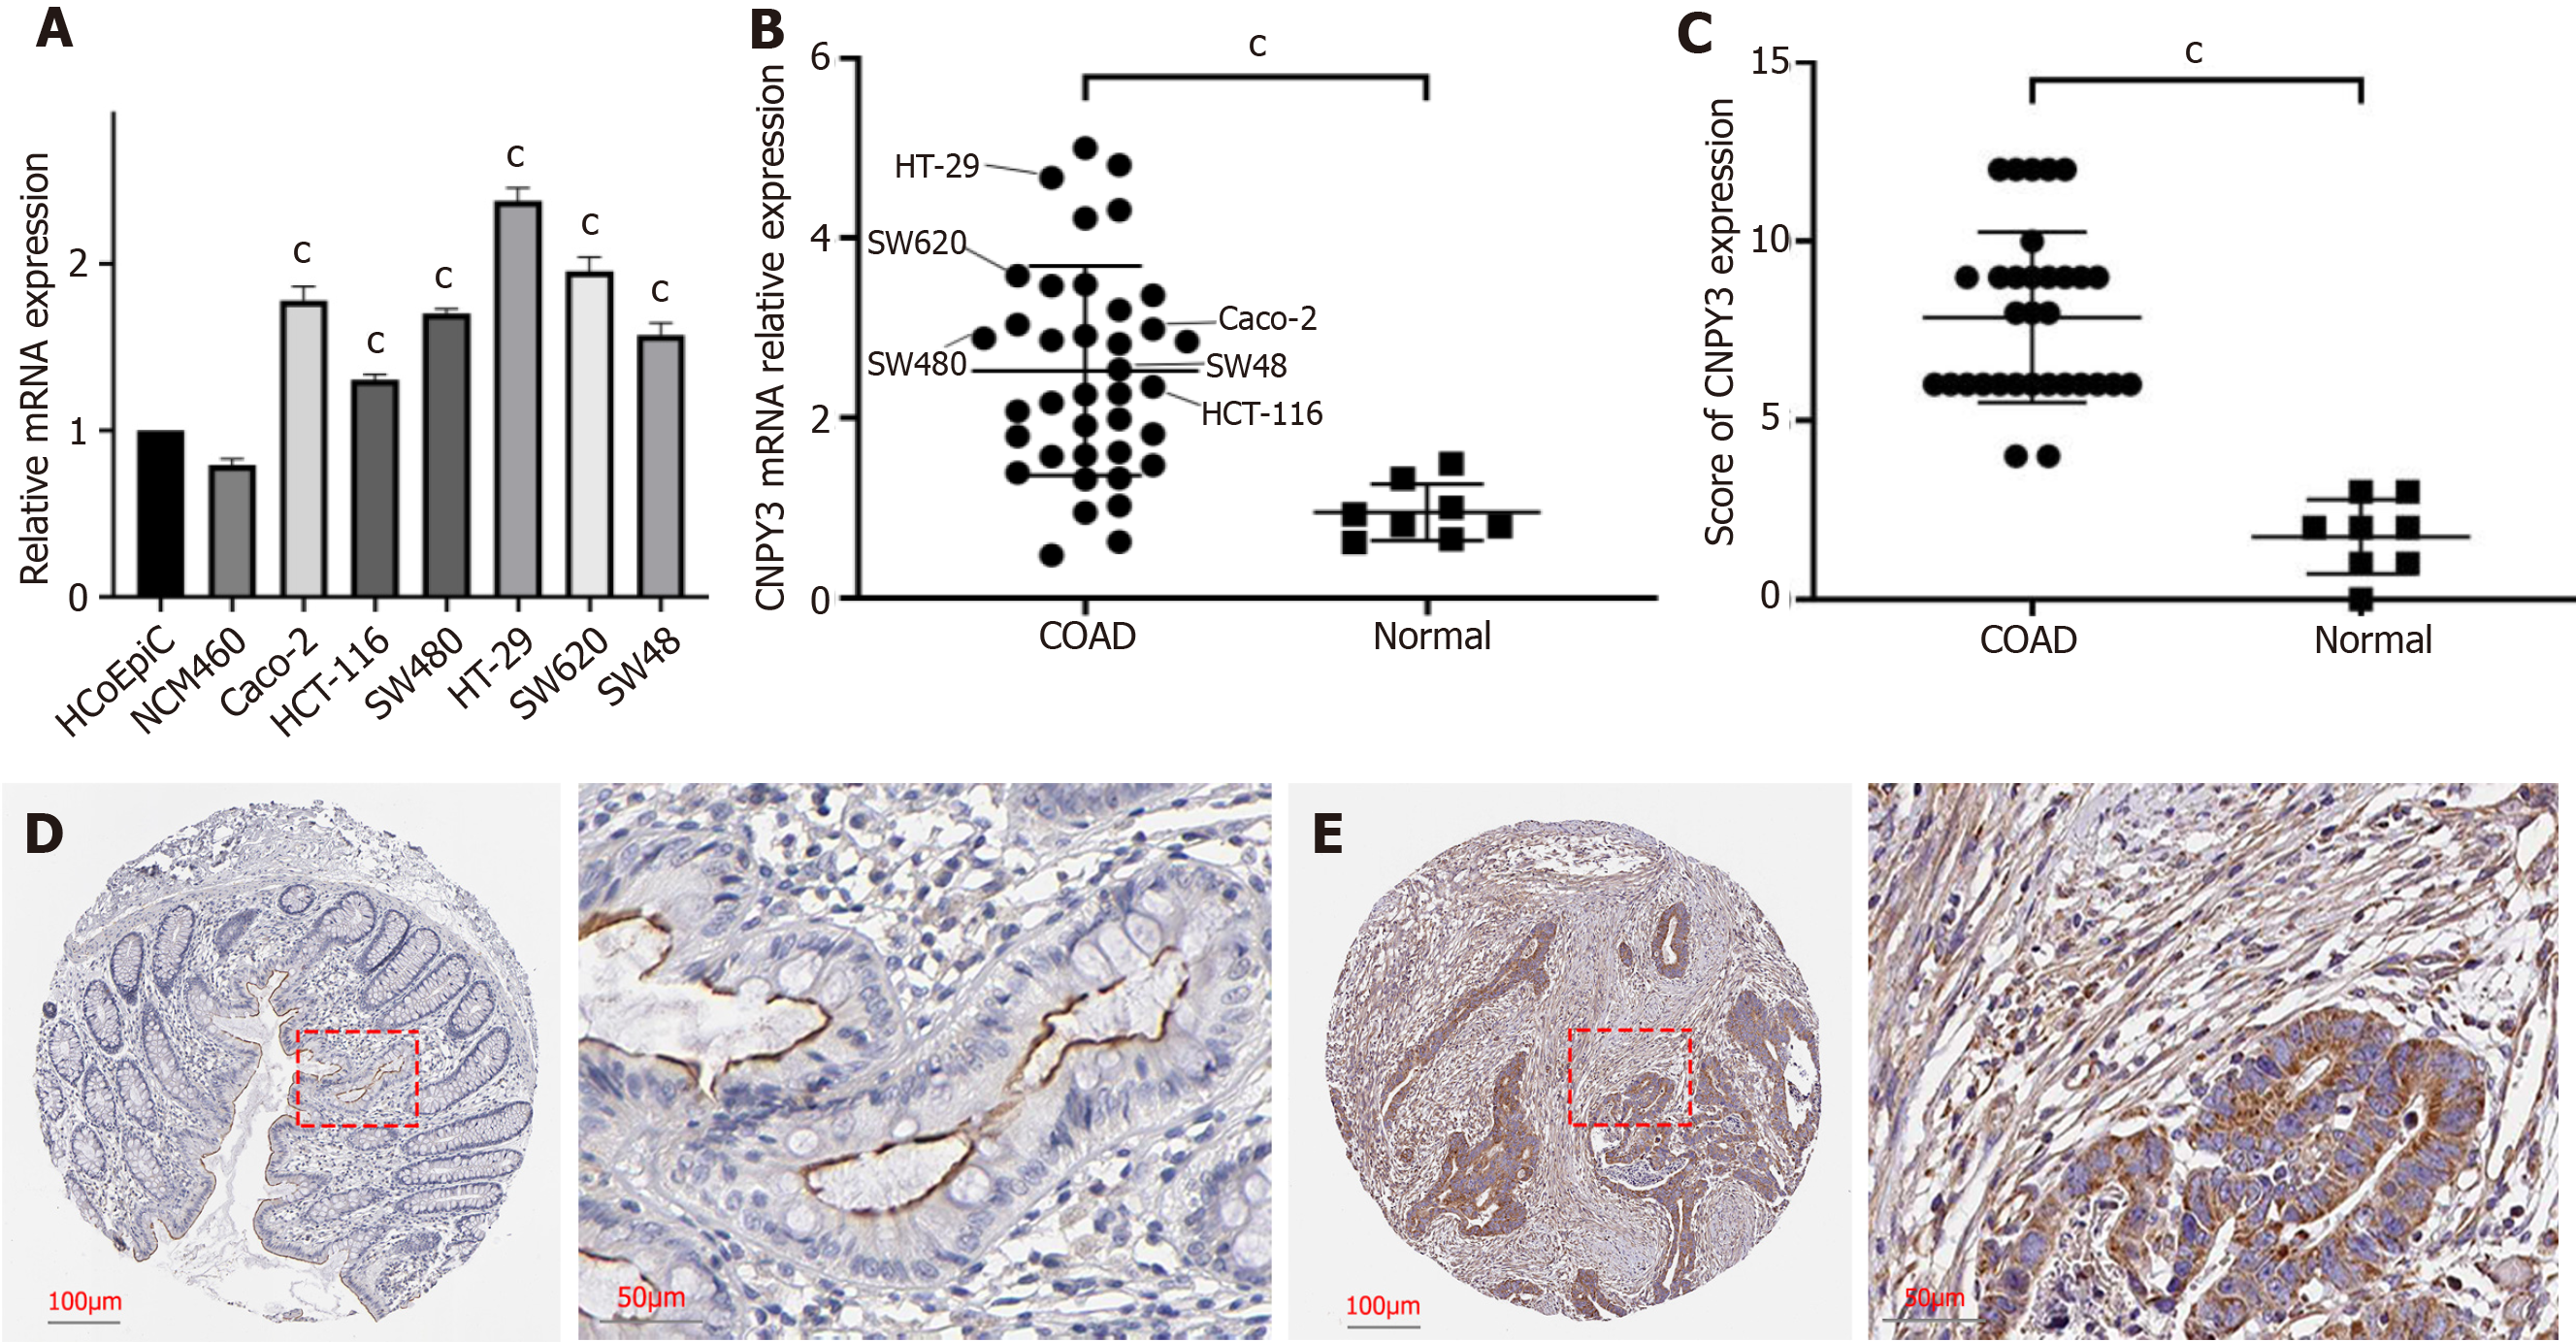
Figure 5 Validation of high canopy FGF signaling regulator 3 expression.
A: Relative mRNA expression levels of canopy FGF signaling regulator 3 (CNPY3) in normal (HCoEpiC and NCM460) and cancer cell lines (Caco-2, HCT-116, HT-29, SW48, SW480, and SW620); B: Relative mRNA expression levels of CNPY3 in normal tissue, tumor tissue, and tumor cell lines; C: Differences in immunohistochemical scores; D: Representative immunohistochemical staining images of normal tissue; E: Representative immunohistochemical staining images of tumor tissue. aP < 0.05; bP < 0.01, cP < 0.001. CNPY3: Canopy FGF signaling regulator 3; COAD: Colon adenocarcinoma.
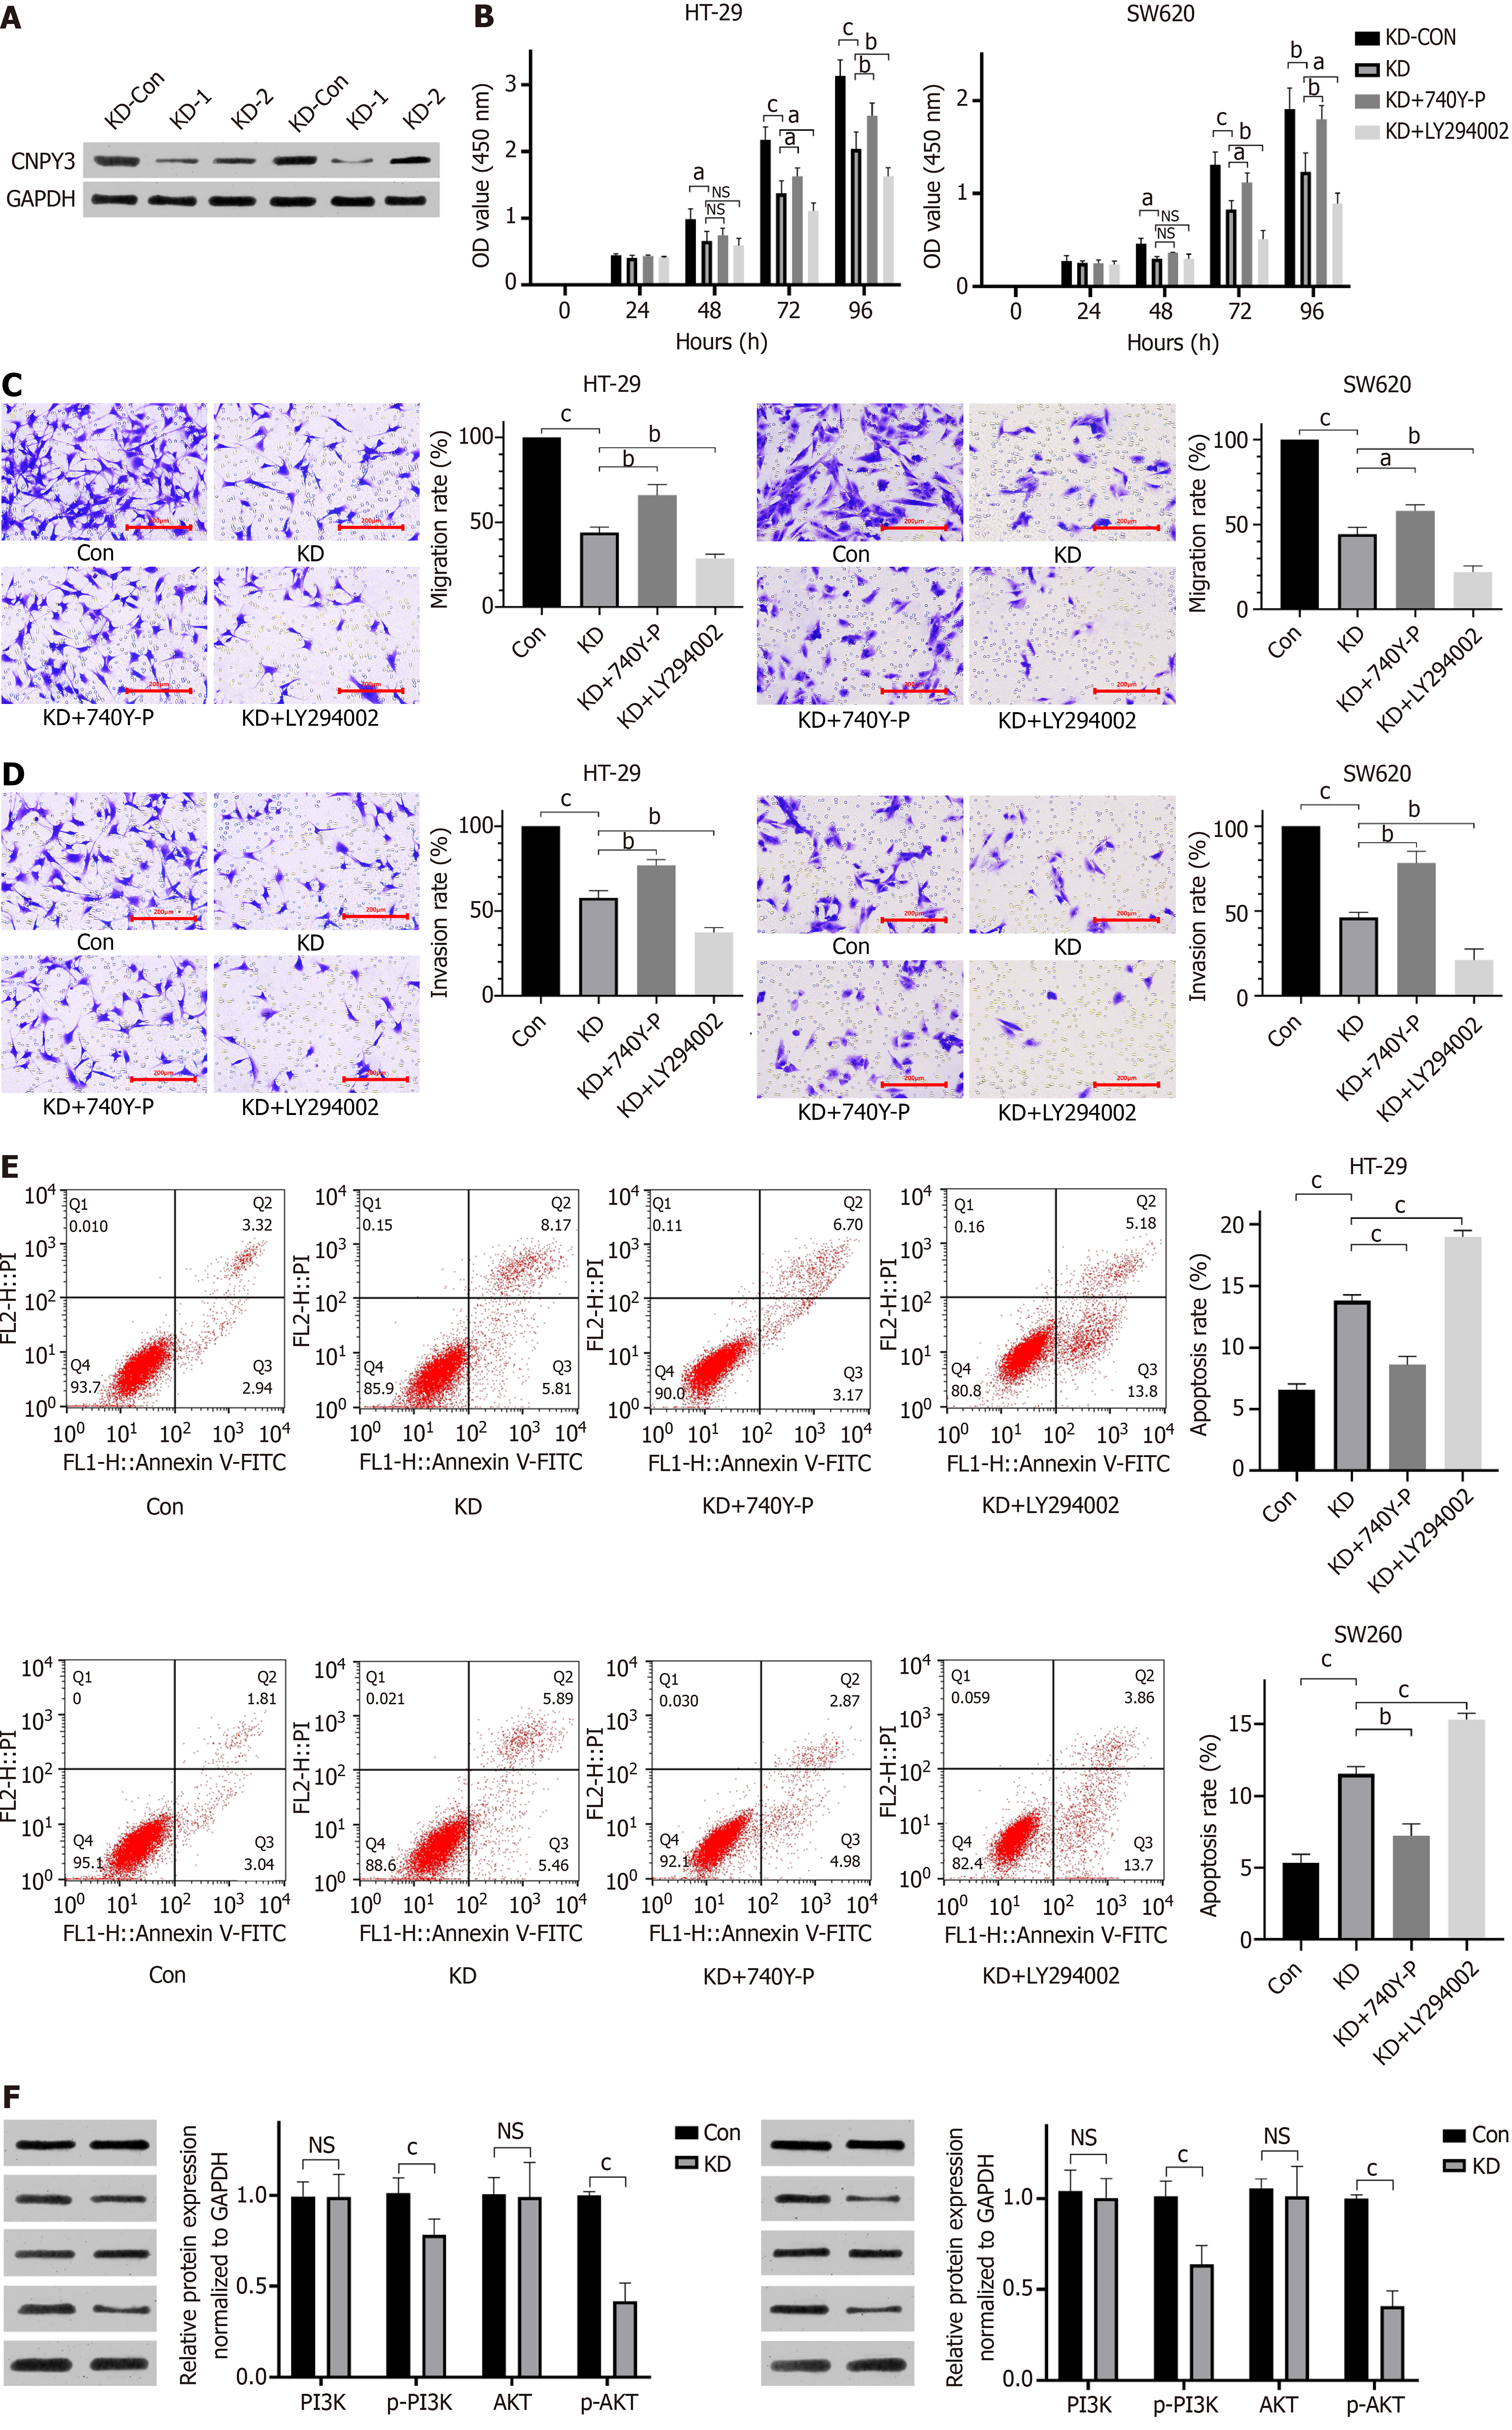
Figure 6 Functional experiments.
A: Results of Western blot analysis after transfection; B: Results of CCK-8 assay; C: Representative images of migration; D: Representative images of invasion; E: Results of apoptosis assay; F: Expression of key proteins in PI3K/AKT pathway. aP < 0.05; bP < 0.01, cP < 0.001. CNPY3: Canopy FGF signaling regulator 3; NS: Not significant.
- Citation: Gao XC, Zhou BH, Ji ZX, Li Q, Liu HN. Canopy FGF signaling regulator 3 affects prognosis, immune infiltration, and PI3K/AKT pathway in colon adenocarcinoma. World J Gastrointest Oncol 2024; 16(7): 3284-3298
- URL: https://www.wjgnet.com/1948-5204/full/v16/i7/3284.htm
- DOI: https://dx.doi.org/10.4251/wjgo.v16.i7.3284


