Copyright
©The Author(s) 2024.
World J Gastrointest Oncol. Jul 15, 2024; 16(7): 3256-3269
Published online Jul 15, 2024. doi: 10.4251/wjgo.v16.i7.3256
Published online Jul 15, 2024. doi: 10.4251/wjgo.v16.i7.3256
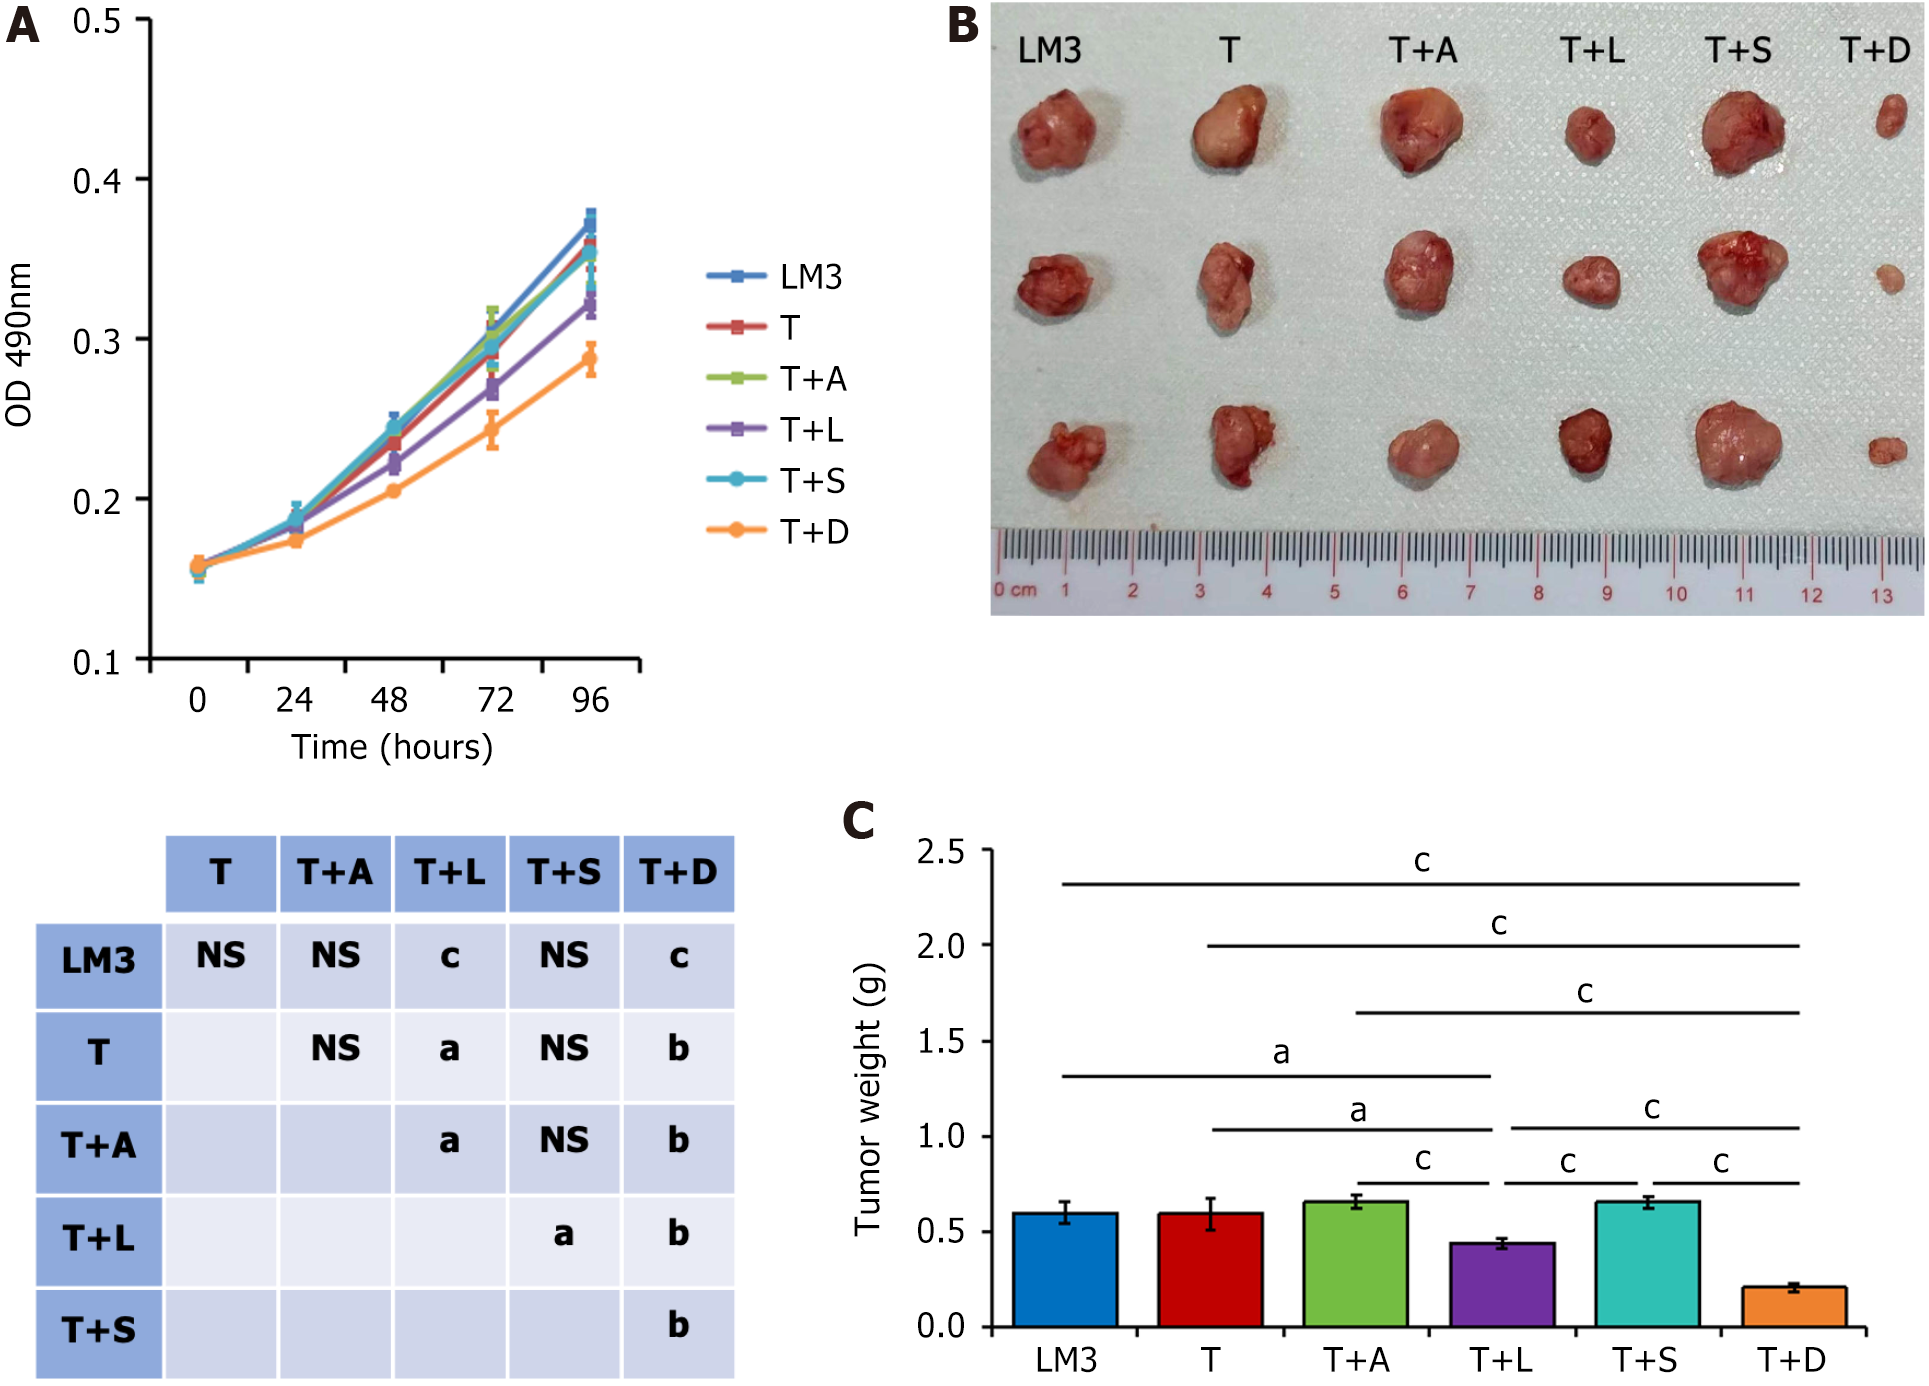
Figure 1 Proliferation of LM3 cells cocultured with monocytes.
A: The proliferation of LM3 liver cancer cells cocultured with monocytes from patients in the transcatheter arterial chemoembolization combined with donafenib group (T + D) after three weeks of treatment were the lowest, followed by those from the transcatheter arterial chemoembolization combined with lenvatinib group (T + L); B and C: Using LM3 cells co cultured with monocytes for subcutaneous tumorigenesis in nude mice, the tumor weight was the lowest after coculture with monocytes from the T + D group, followed by those from the T + L group. aP < 0.05, bP < 0.01, cP < 0.001, ns: No significance. OD: Optical density; T + A: Transcatheter arterial chemoembolization combined with apatinib group; T + L: Transcatheter arterial chemoembolization combined with lenvatinib group; T + S: Transcatheter arterial chemoembolization combined with sorafenib group; T + D: Transcatheter arterial chemoembolization combined with donafenib group.
Figure 2 In situ liver tumor growth and tumor immune response.
A and B: After simulating the treatment of in situ liver cancer in mice with different treatment groups, the tumor weight of the transcatheter arterial chemoembolization (T) group was significantly lower than that of the solvent control group, and significantly higher than all combined treatment groups; C and D: The number of infiltrating CD8+ T cells in the T group tumor tissues and the four combined groups was significantly higher than that in the solvent control group, with the T + donafenib (D) group having the highest level CD8+ T cell infiltration, followed by the T + lenvatinib (L) group; E and F: The expression of programmed cell death ligand 1 in the T group tumor tissues was significantly higher than that in the other group; G and H: The expression of Ki-67 in the tumor tissues of the solvent control group was significantly higher than that in the other groups, while its expression in the T group tumor tissues was significantly higher than that in each combination group. Specifically, Ki-67 expression in the T + D group was significantly lower than that in other combination therapy groups. aP < 0.05, bP < 0.01, cP < 0.001, ns: No significance. T + A: Transcatheter arterial chemoembolization combined with apatinib group; T + L: Transcatheter arterial chemoembolization combined with lenvatinib group; T + S: Transcatheter arterial chemoembolization combined with sorafenib group; T + D: Transcatheter arterial chemoembolization combined with donafenib group; PD-L1: Programmed cell death ligand 1.
Figure 3 Progression free survival and overall survival curves of the patient.
A: There was no significant difference in progression free survival time among different combination therapy groups; B: There was no significant difference in overall survival time among different combination therapy groups. T + A: Transcatheter arterial chemoembolization combined with apatinib group; T + L: Transcatheter arterial chemoembolization combined with lenvatinib group; T + S: Transcatheter arterial chemoembolization combined with sorafenib group; T + D: Transcatheter arterial chemoembolization combined with donafenib group.
- Citation: Guo Y, Li RC, Xia WL, Yang X, Zhu WB, Li FT, Hu HT, Li HL. Immune effect and prognosis of transcatheter arterial chemoembolization and tyrosine kinase inhibitors therapy in patients with hepatocellular carcinoma. World J Gastrointest Oncol 2024; 16(7): 3256-3269
- URL: https://www.wjgnet.com/1948-5204/full/v16/i7/3256.htm
- DOI: https://dx.doi.org/10.4251/wjgo.v16.i7.3256


