Copyright
©The Author(s) 2024.
World J Gastrointest Oncol. Jul 15, 2024; 16(7): 3241-3255
Published online Jul 15, 2024. doi: 10.4251/wjgo.v16.i7.3241
Published online Jul 15, 2024. doi: 10.4251/wjgo.v16.i7.3241
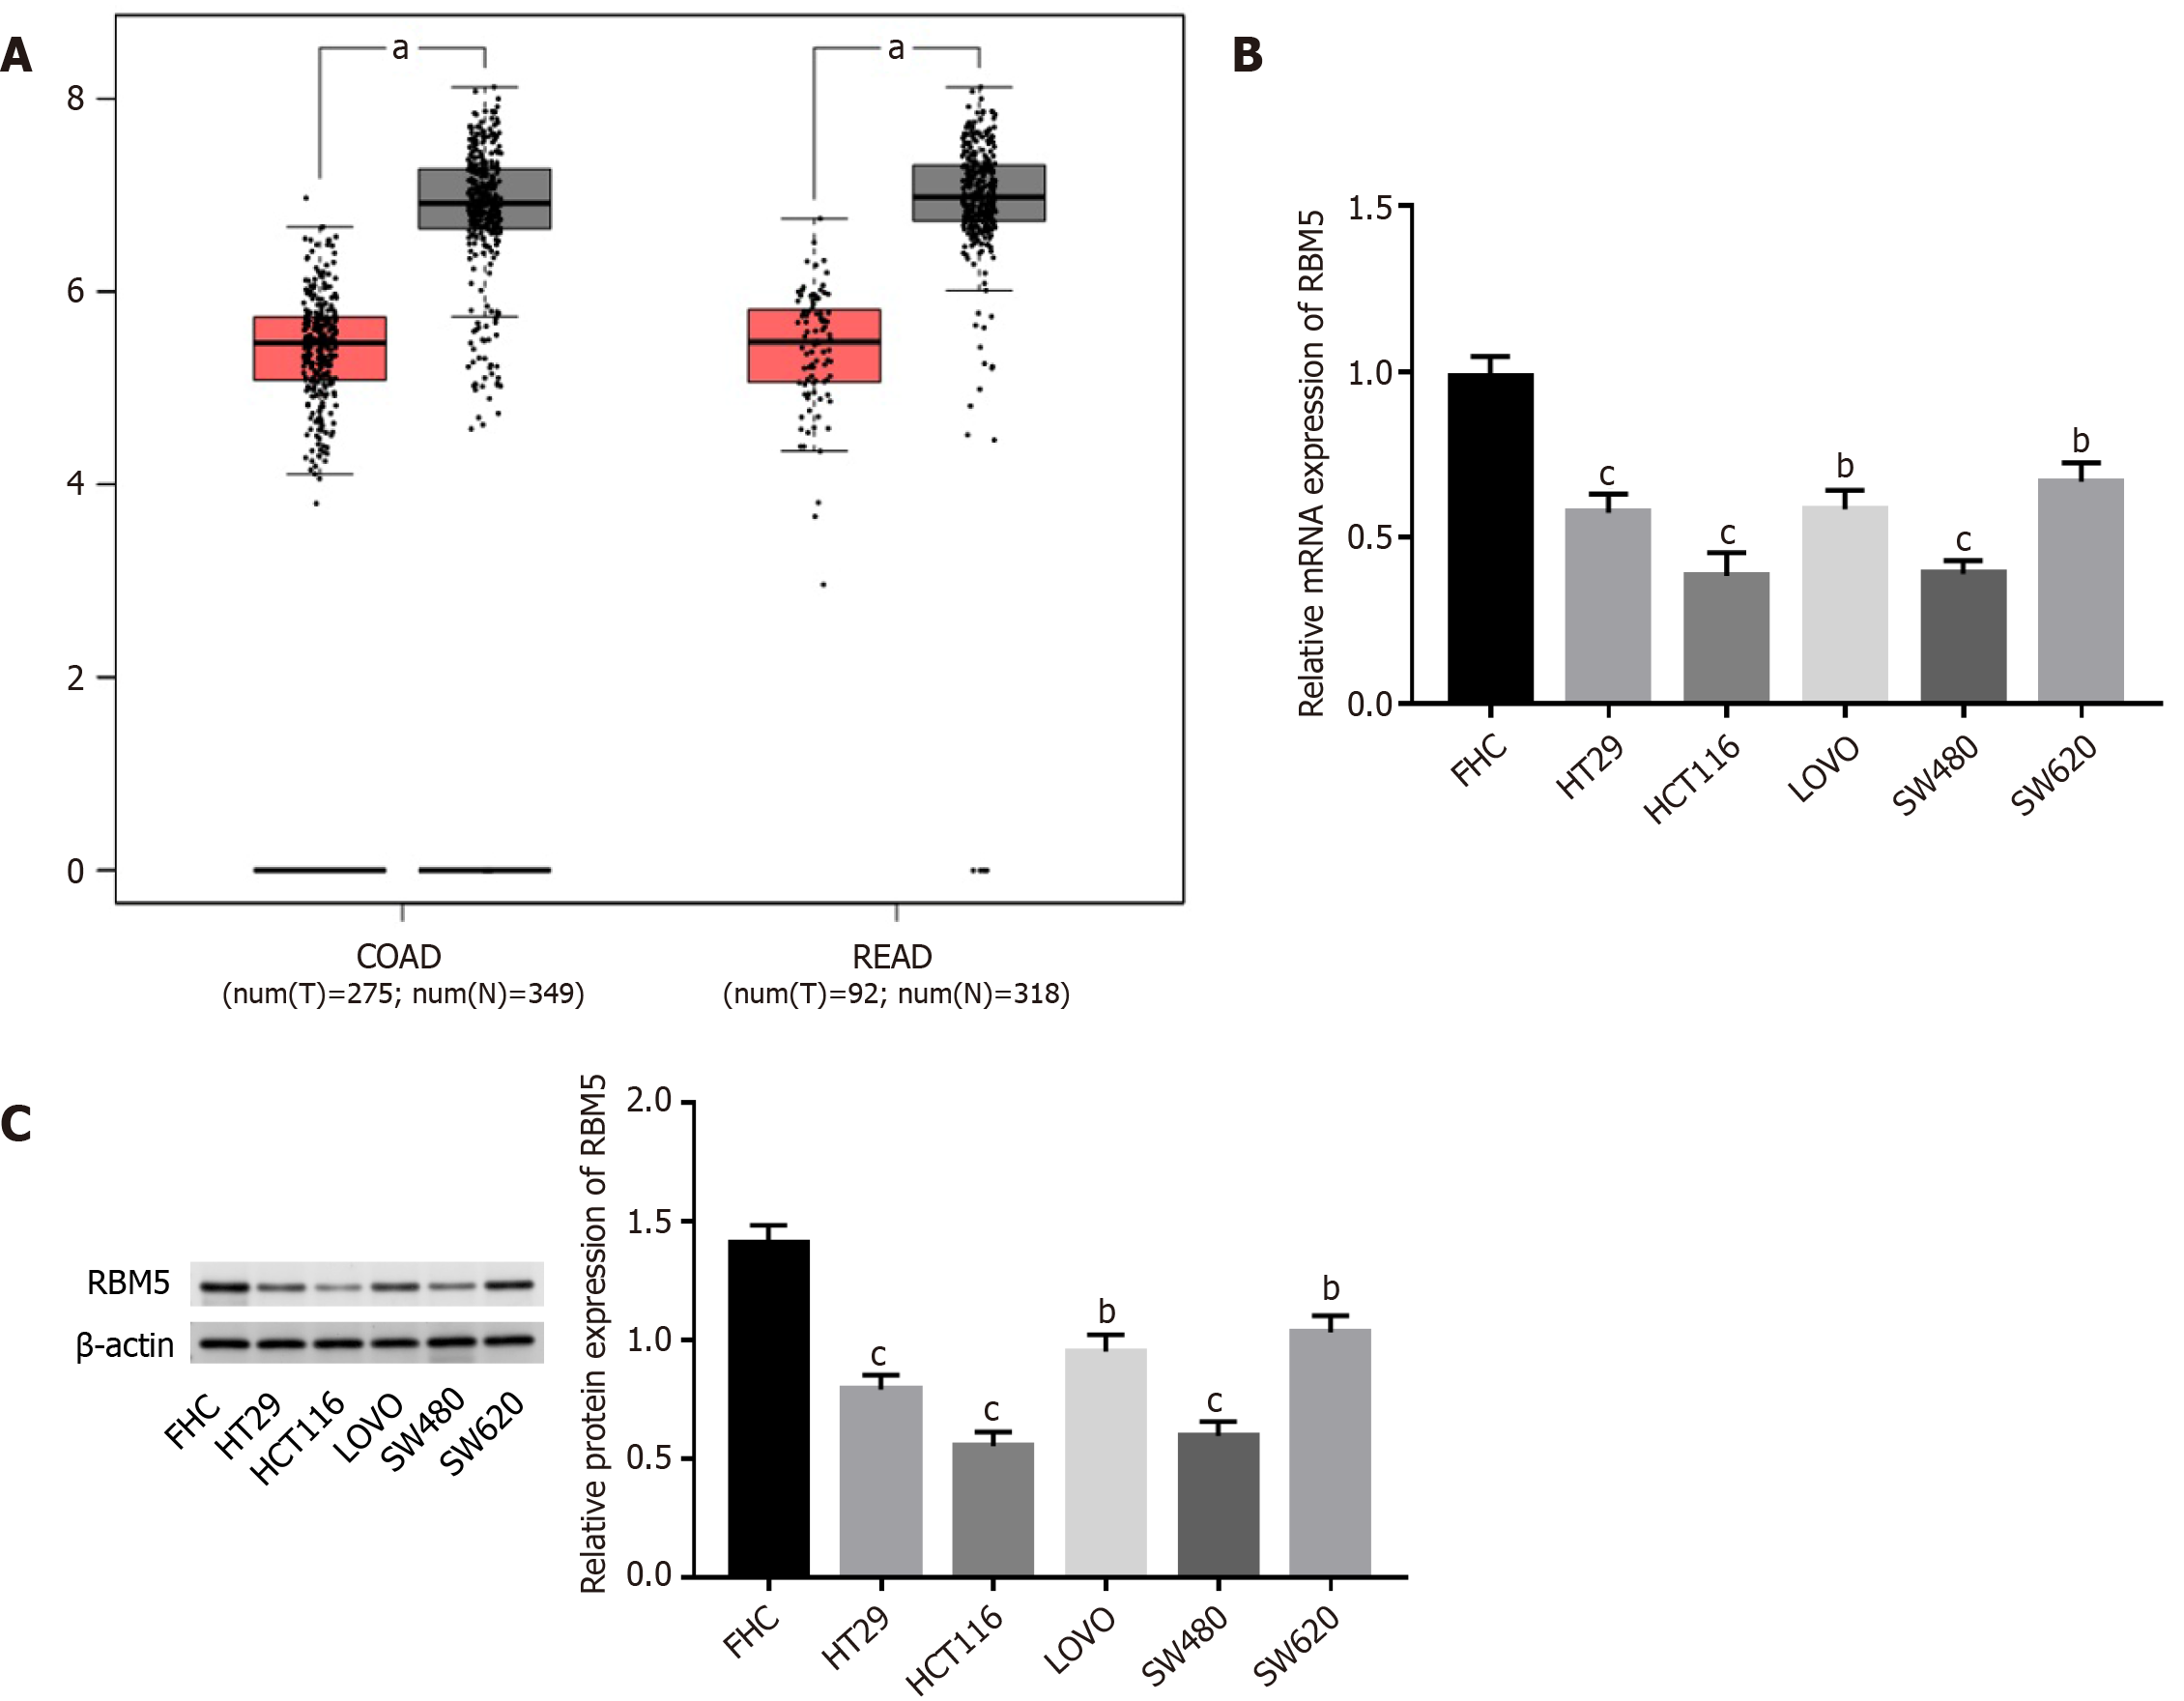
Figure 1 RNA binding motif 5 is lowly expressed in colorectal cancer tissues and cells.
A: The mRNA expression of RNA binding motif 5 (RBM5) in tumor tissues and normal tissues was analyzed via the Gene Expression Profiling Interactive Analysis; B: Relative mRNA expression of RBM5 in fetal human cell (FHC), HT29, HCT116, LOVO, SW480 and SW620 cells was detected by quantitative real time-polymerase chain reaction; C: Relative protein expression of RBM5 in FHC, HT29, HCT116, LOVO, SW480, and SW620 cells was detected by Western blot. RBM5: RNA binding motif 5. aP < 0.05, bP < 0.01, cP < 0.001.
Figure 2 RNA binding motif 5 overexpression represses proliferation, migration, invasion and glycolysis of colorectal cancer cells.
A: Relative protein expression of RNA binding motif 5 in HCT116 and SW480 cells was detected by Western blot; B: Cell counting kit-8 (CCK-8) assay was used to assess the viability of HCT116 and SW480 cells; C: 5-ethynyl-2’-deoxyuridine assay was used to assess proliferation of HCT116 and SW480 cells; D and E: Migration and invasion of HCT116 and SW480 cells were evaluated by transwell assays; F: Glucose consumption, lactic acid production, and adenosine-triphosphate production were detected by corresponding kits; G: Protein levels of hexokinase 2 and lactate dehydrogenase A were detected by Western blot in HCT116 and SW480 cells. RBM5: RNA binding motif 5; EDU: 5-ethynyl-2’-deoxyuridine; HK2: Hexokinase 2; LDHA: Lactate dehydrogenase A. bP < 0.01, cP < 0.001.
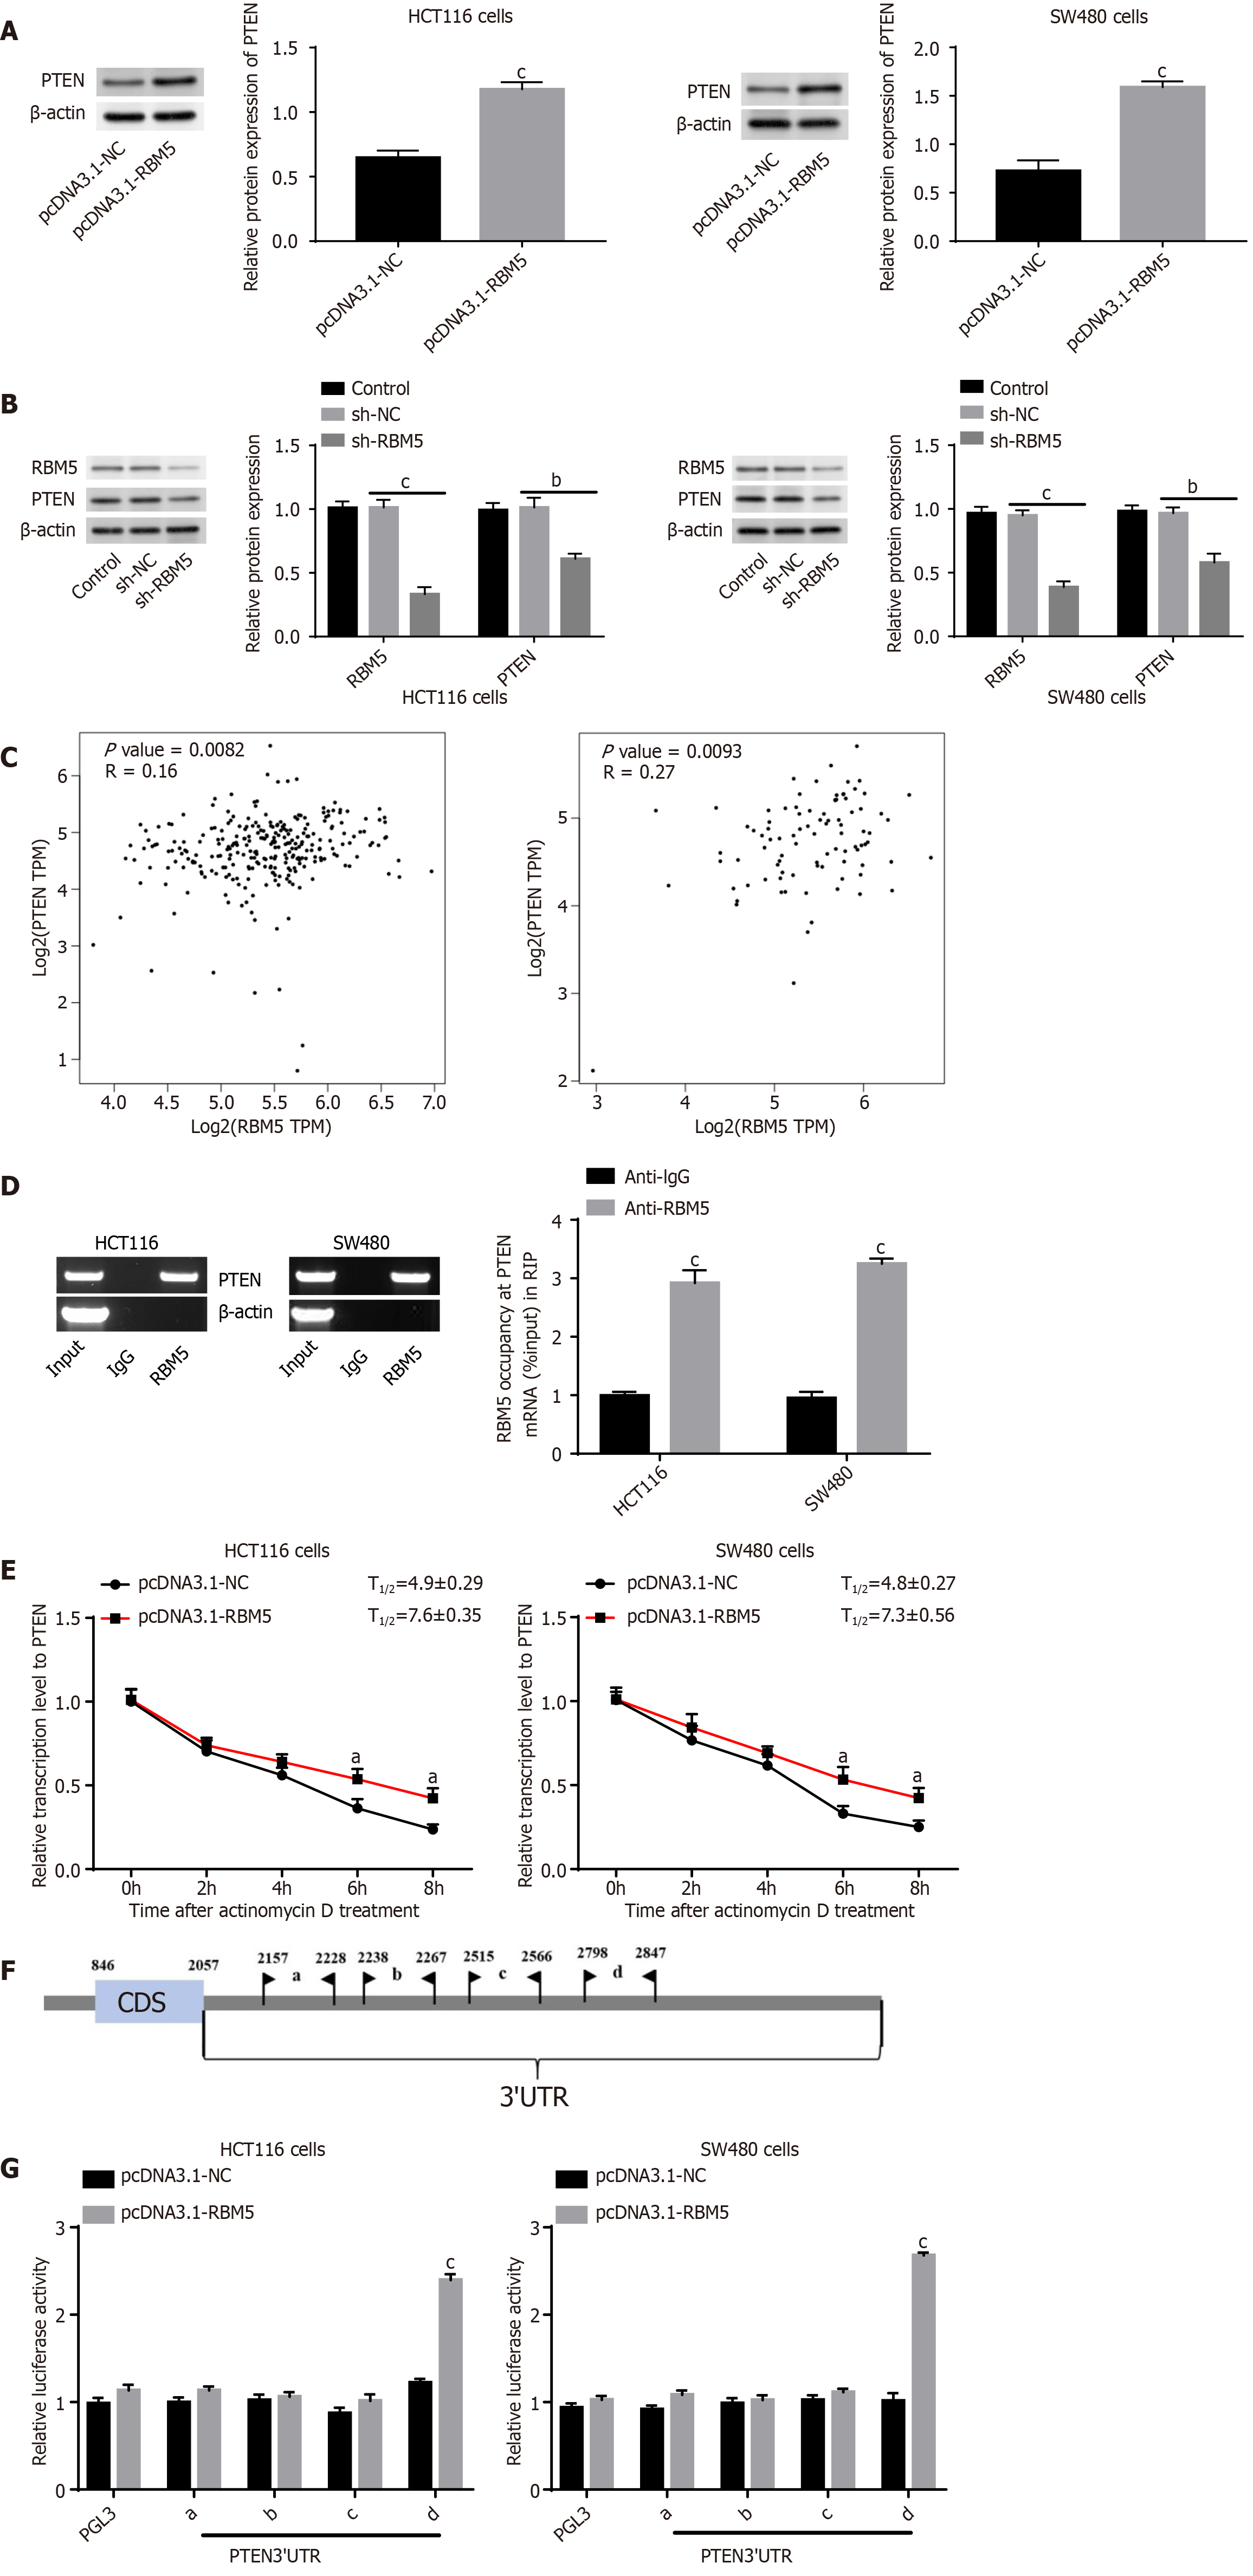
Figure 3 RNA binding motif 5 binds to phosphatase and tensin homolog mRNA to stabilize its expression.
A: Relative protein expression of phosphatase and tensin homolog (PTEN) in HCT116 and SW480 cells was detected by Western blot after RNA binding motif 5 (RBM5) overexpression; B: Relative protein expression of PTEN and RBM5 in HCT116 and SW480 cells was detected by Western blot; C: The correlation between the expression of RBM5 and PTEN in colon adenocarcinoma and rectum adenocarcinoma; D: The binding of RBM5 and PTEN in HCT116 and SW480 cells was confirmed by RNA immunoprecipitation assay; E: Relative mRNA expression of PTEN in HCT116 and SW480 cells was detected by quantitative real time-polymerase chain reaction after treatment with 5 μg/mL actinomycin D for 0-2-4-6-8 hours; F: CatRAPID (http://service.tartaglialab.com/page/catrapid_group) was used to predict the binding regions between RBM5 and PTEN 3 ‘UTR; G: Dual-luciferase reporter assay was used to confirm the interaction between RBM5 and PTEN 3’UTR. aP < 0.05, bP < 0.01, cP < 0.001. RBM5: RNA binding motif 5; PTEN: Phosphatase and tensin homolog.
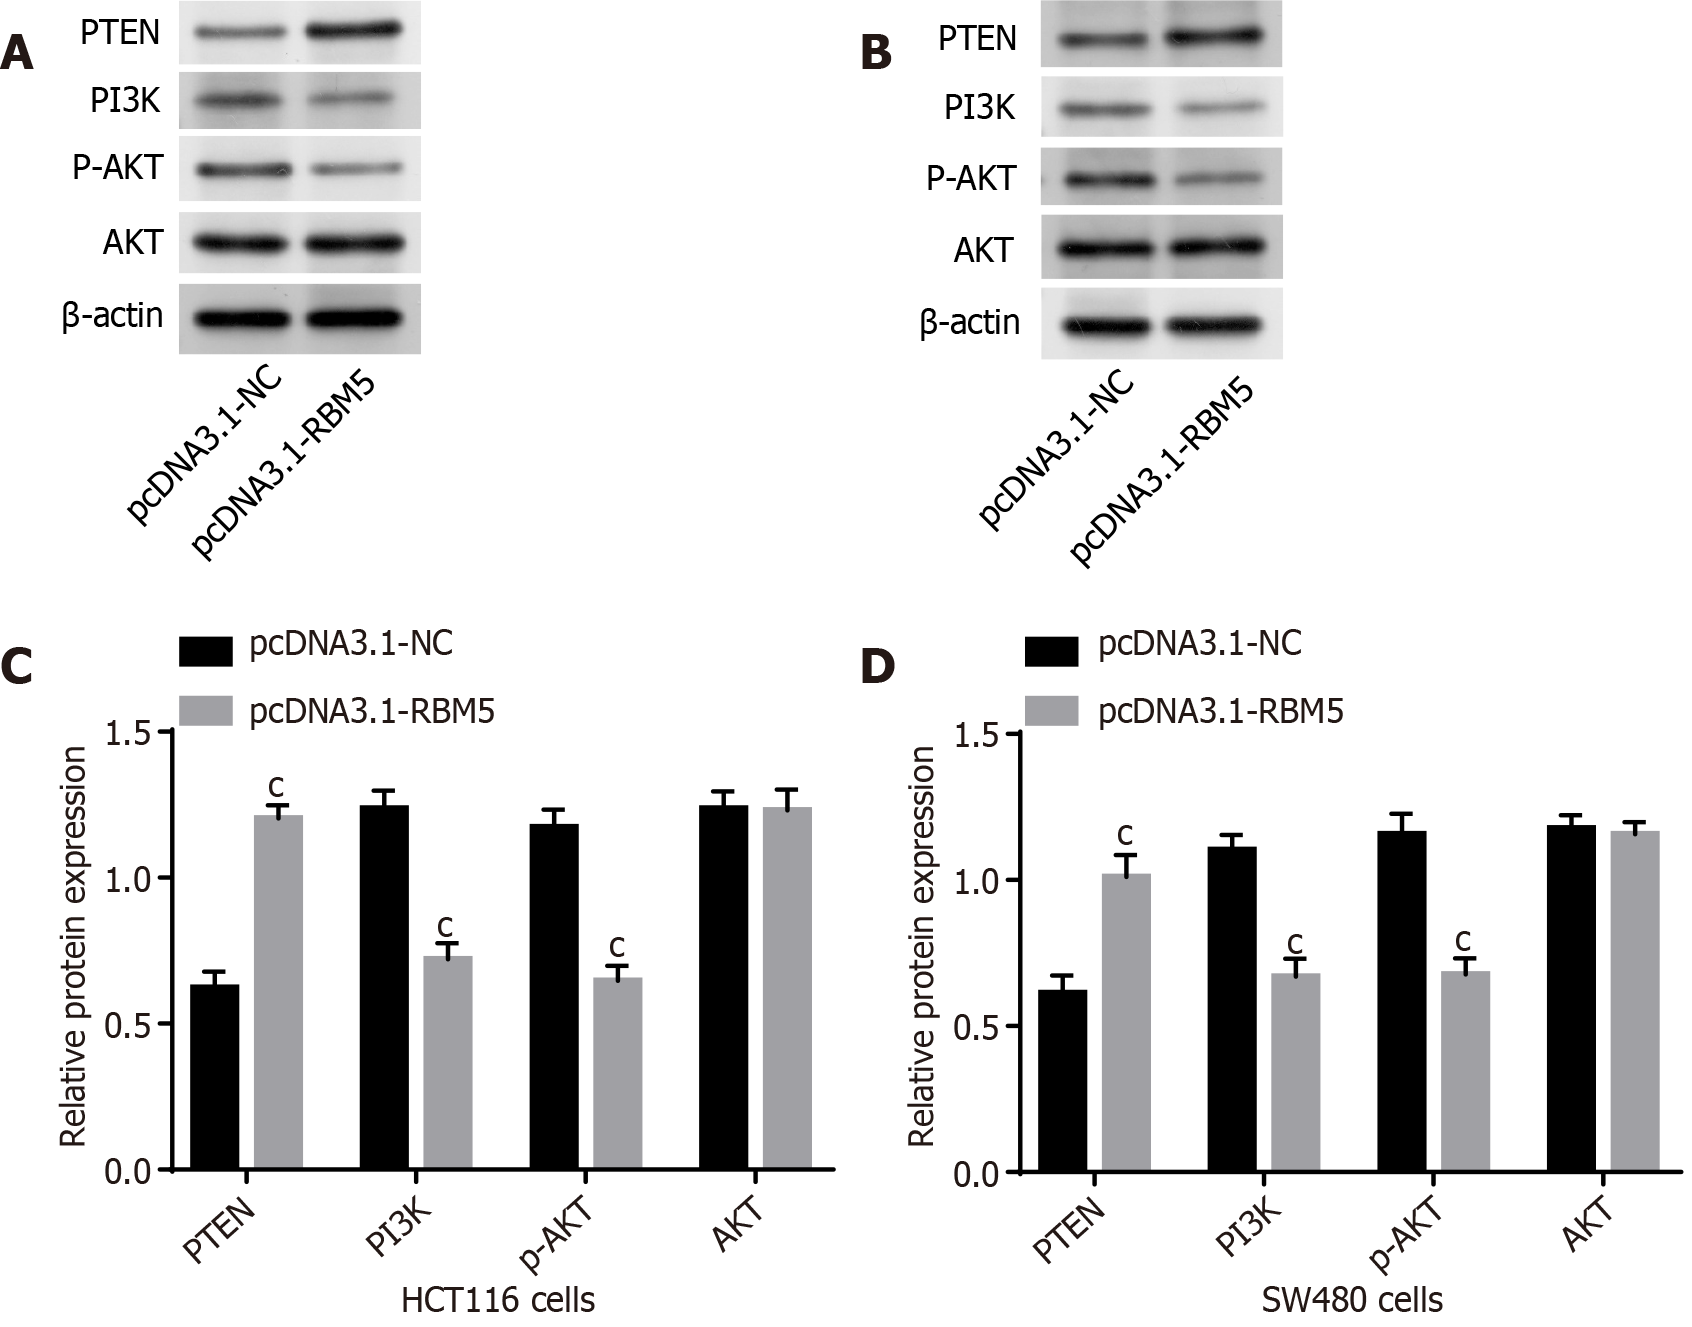
Figure 4 RNA binding motif 5 regulates the phosphatase and tensin homolog/PI3K/AKT pathway in colorectal cancer cells.
A-D: Protein levels of phosphatase and tensin homolog, phosphoinositide 3-kinase, phosphorylated-protein kinase B (p-AKT) and protein kinase B (AKT) were determined by Western blot in HCT116 and SW480 cells. cP < 0.001. RBM5: RNA binding motif 5; PTEN: Phosphatase and tensin homolog; PI3K: Phosphoinositide 3-kinase; p-AKT: Phosphorylated-protein kinase B.
Figure 5 Phosphatase and tensin homolog knockdown partially reversed inhibitory effects of RNA binding motif 5 on the proliferation, metastasis and glycolysis of colorectal cancer cells.
A: The knockdown efficiency of phosphatase and tensin homolog (PTEN) was detected using Western blot in HCT116 and SW480 cells; B: The expression of PTEN in HCT116 and SW480 cells was detected using Western blot; C: Cell counting kit-8 assay was used to assess the viability of HCT116 and SW480 cells; D: 5-ethynyl-2’-deoxyuridine assay was used to assess proliferation of HCT116 and SW480 cells; E and F: Migration and invasion of HCT116 and SW480 cells were evaluated by transwell assays; G: Glucose consumption, lactic acid production and adenosine-triphosphate production were detected by corresponding kits. aP < 0.05, bP < 0.01, cP < 0.001. PTEN: Phosphatase and tensin homolog.
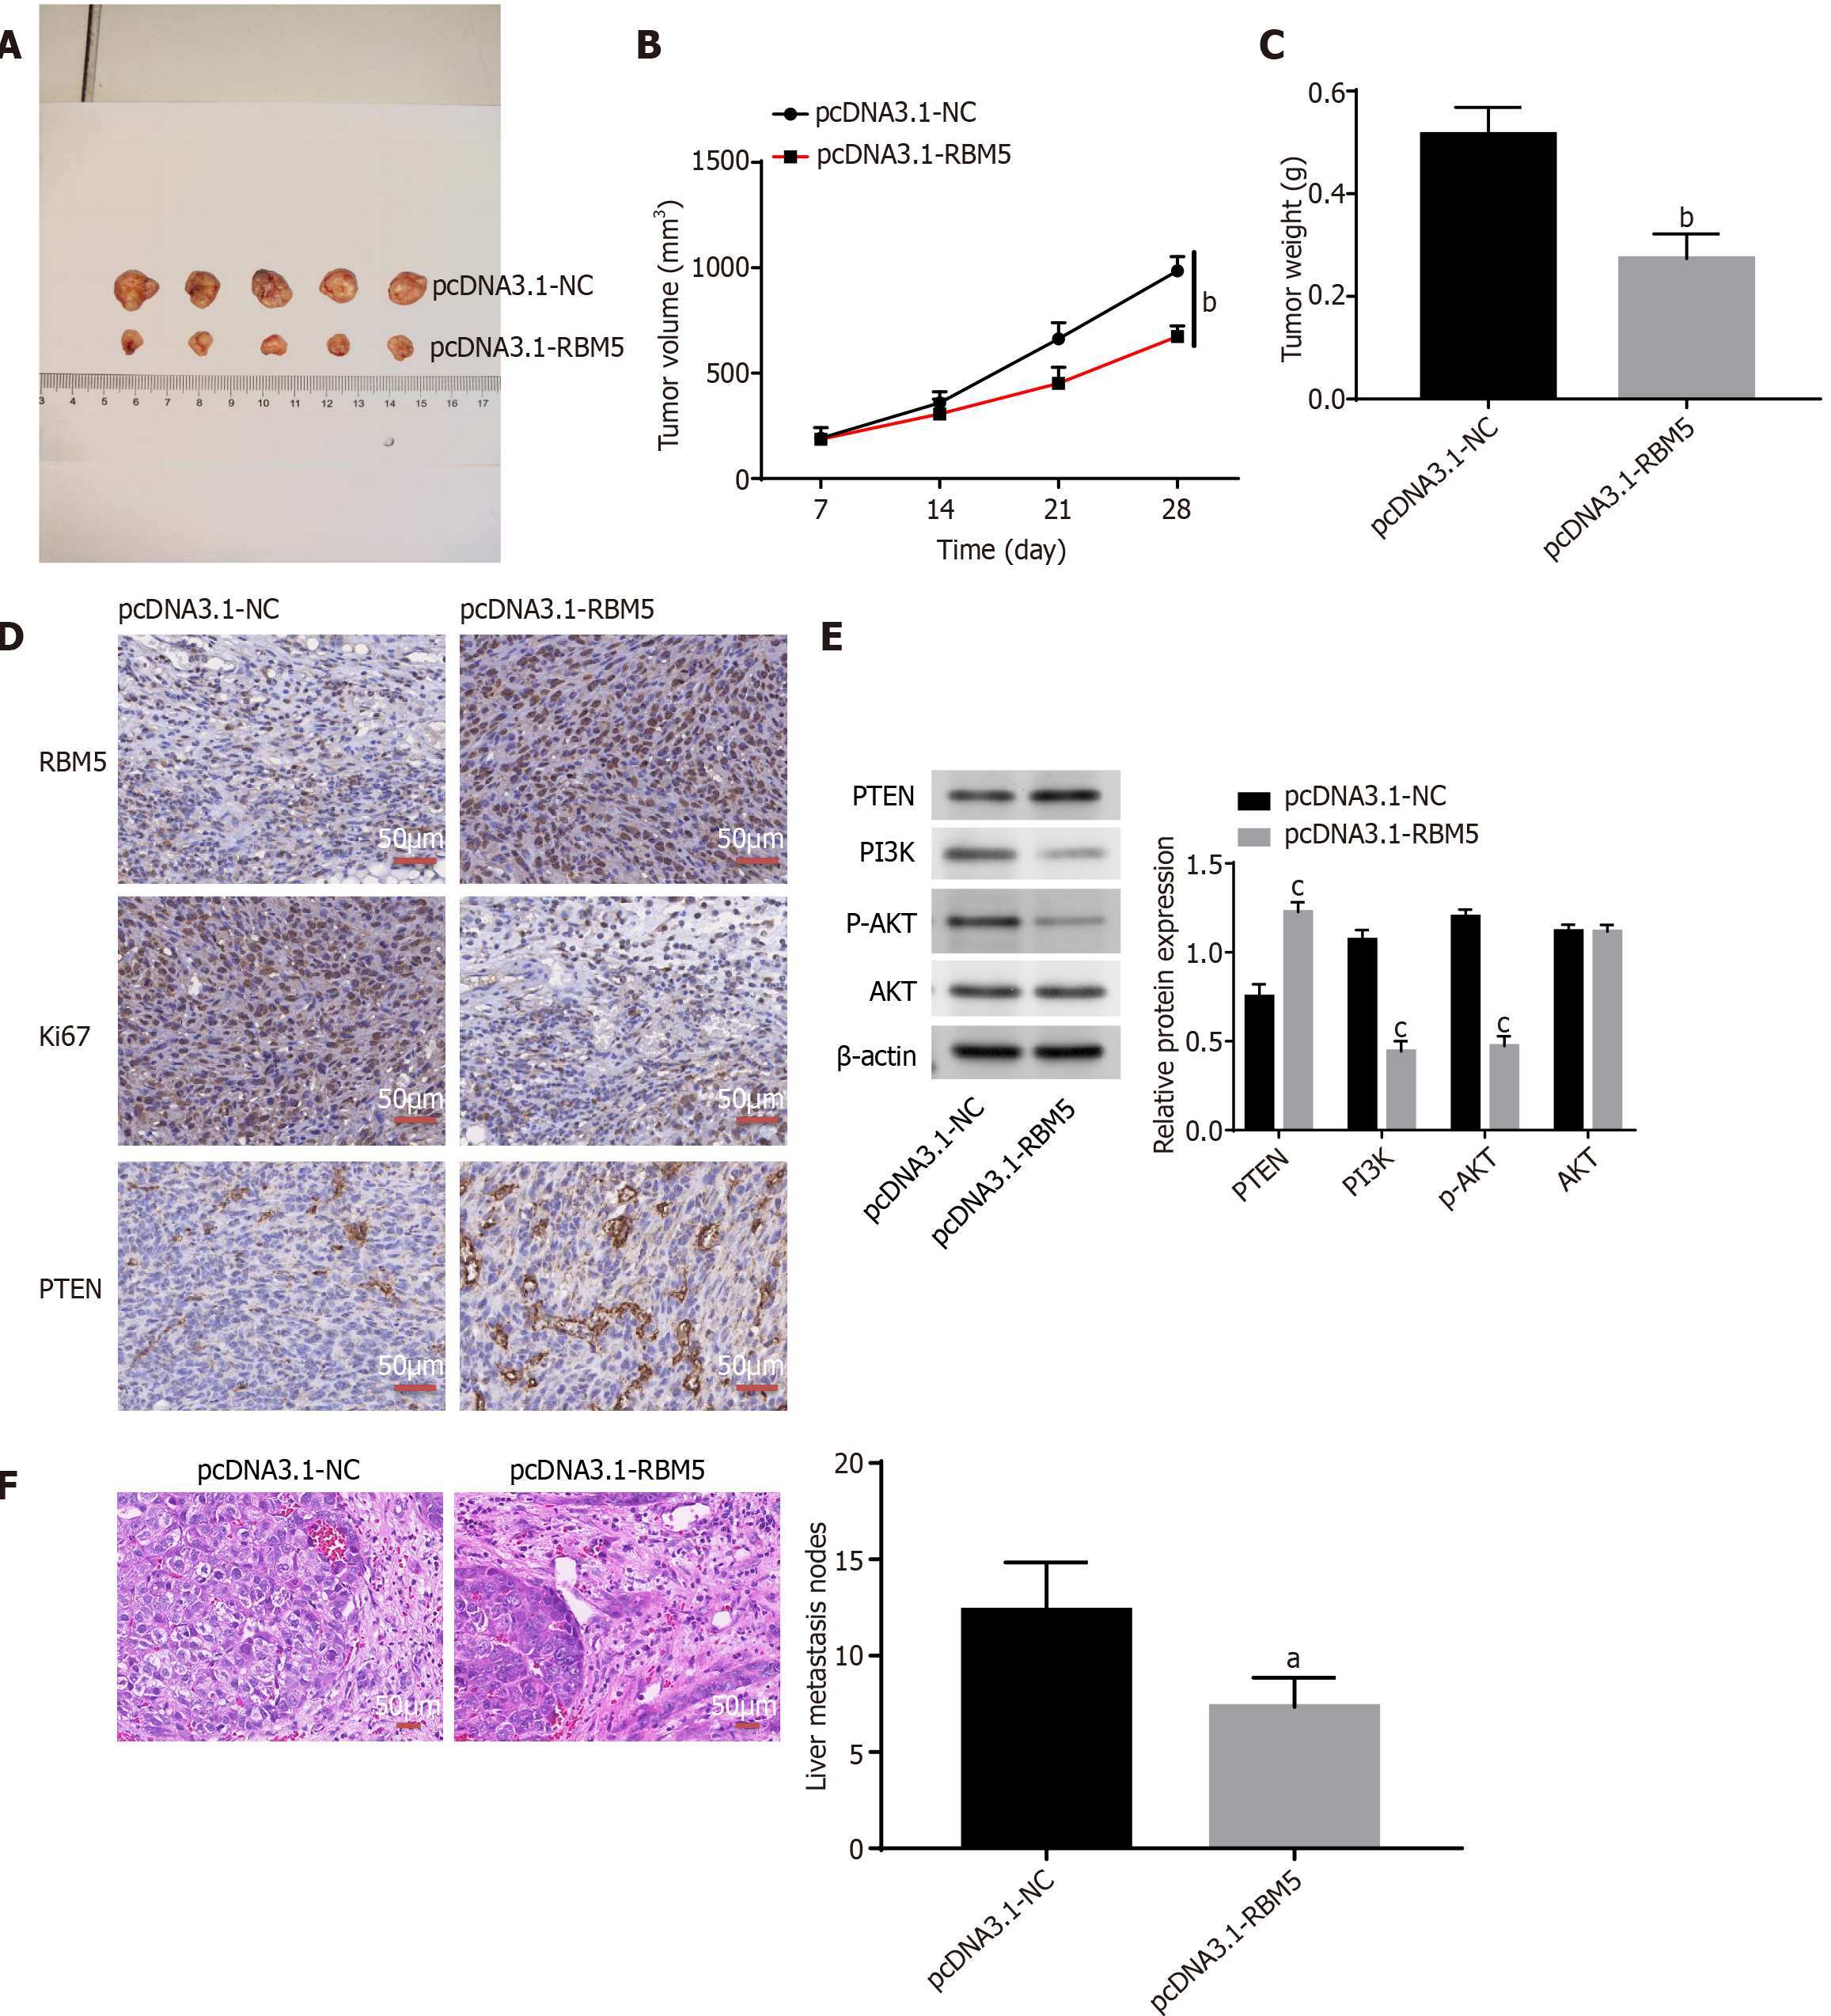
Figure 6 Overexpression of RNA binding motif 5 inhibits the tumor formation and metastasis of colorectal cancer in vivo.
A: Images of a tumor in xenograft mice, n = 5; B: The tumor volume in every 7 days; the construction of tumor growth curves of mice, n = 5; C: Xenograft mice’ average tumor weight, n = 5; D: Protein expression levels of RNA binding motif 5, phosphatase and tensin homolog (PTEN) and Ki67 in xenograft mice’ tumor tissues were detected by immunohistochemical staining, n = 5; E: Protein levels of PTEN, phosphoinositide 3-kinase, phosphorylated-protein kinase B, and AKT were determined by Western blot; F: Tumor liver metastasis was assessed by haematoxylin and eosin staining, n = 5. aP < 0.05,bP < 0.01,cP < 0.001. RBM5: RNA binding motif 5; PTEN: Phosphatase and tensin homolog; PI3K: Phosphoinositide 3-kinase; p-AKT: Phosphorylated-protein kinase B.
- Citation: Wang CX, Liu F, Wang Y. RBM5 suppresses proliferation, metastasis and glycolysis of colorectal cancer cells via stabilizing phosphatase and tensin homolog mRNA. World J Gastrointest Oncol 2024; 16(7): 3241-3255
- URL: https://www.wjgnet.com/1948-5204/full/v16/i7/3241.htm
- DOI: https://dx.doi.org/10.4251/wjgo.v16.i7.3241


