Copyright
©The Author(s) 2024.
World J Gastrointest Oncol. Jul 15, 2024; 16(7): 3097-3117
Published online Jul 15, 2024. doi: 10.4251/wjgo.v16.i7.3097
Published online Jul 15, 2024. doi: 10.4251/wjgo.v16.i7.3097
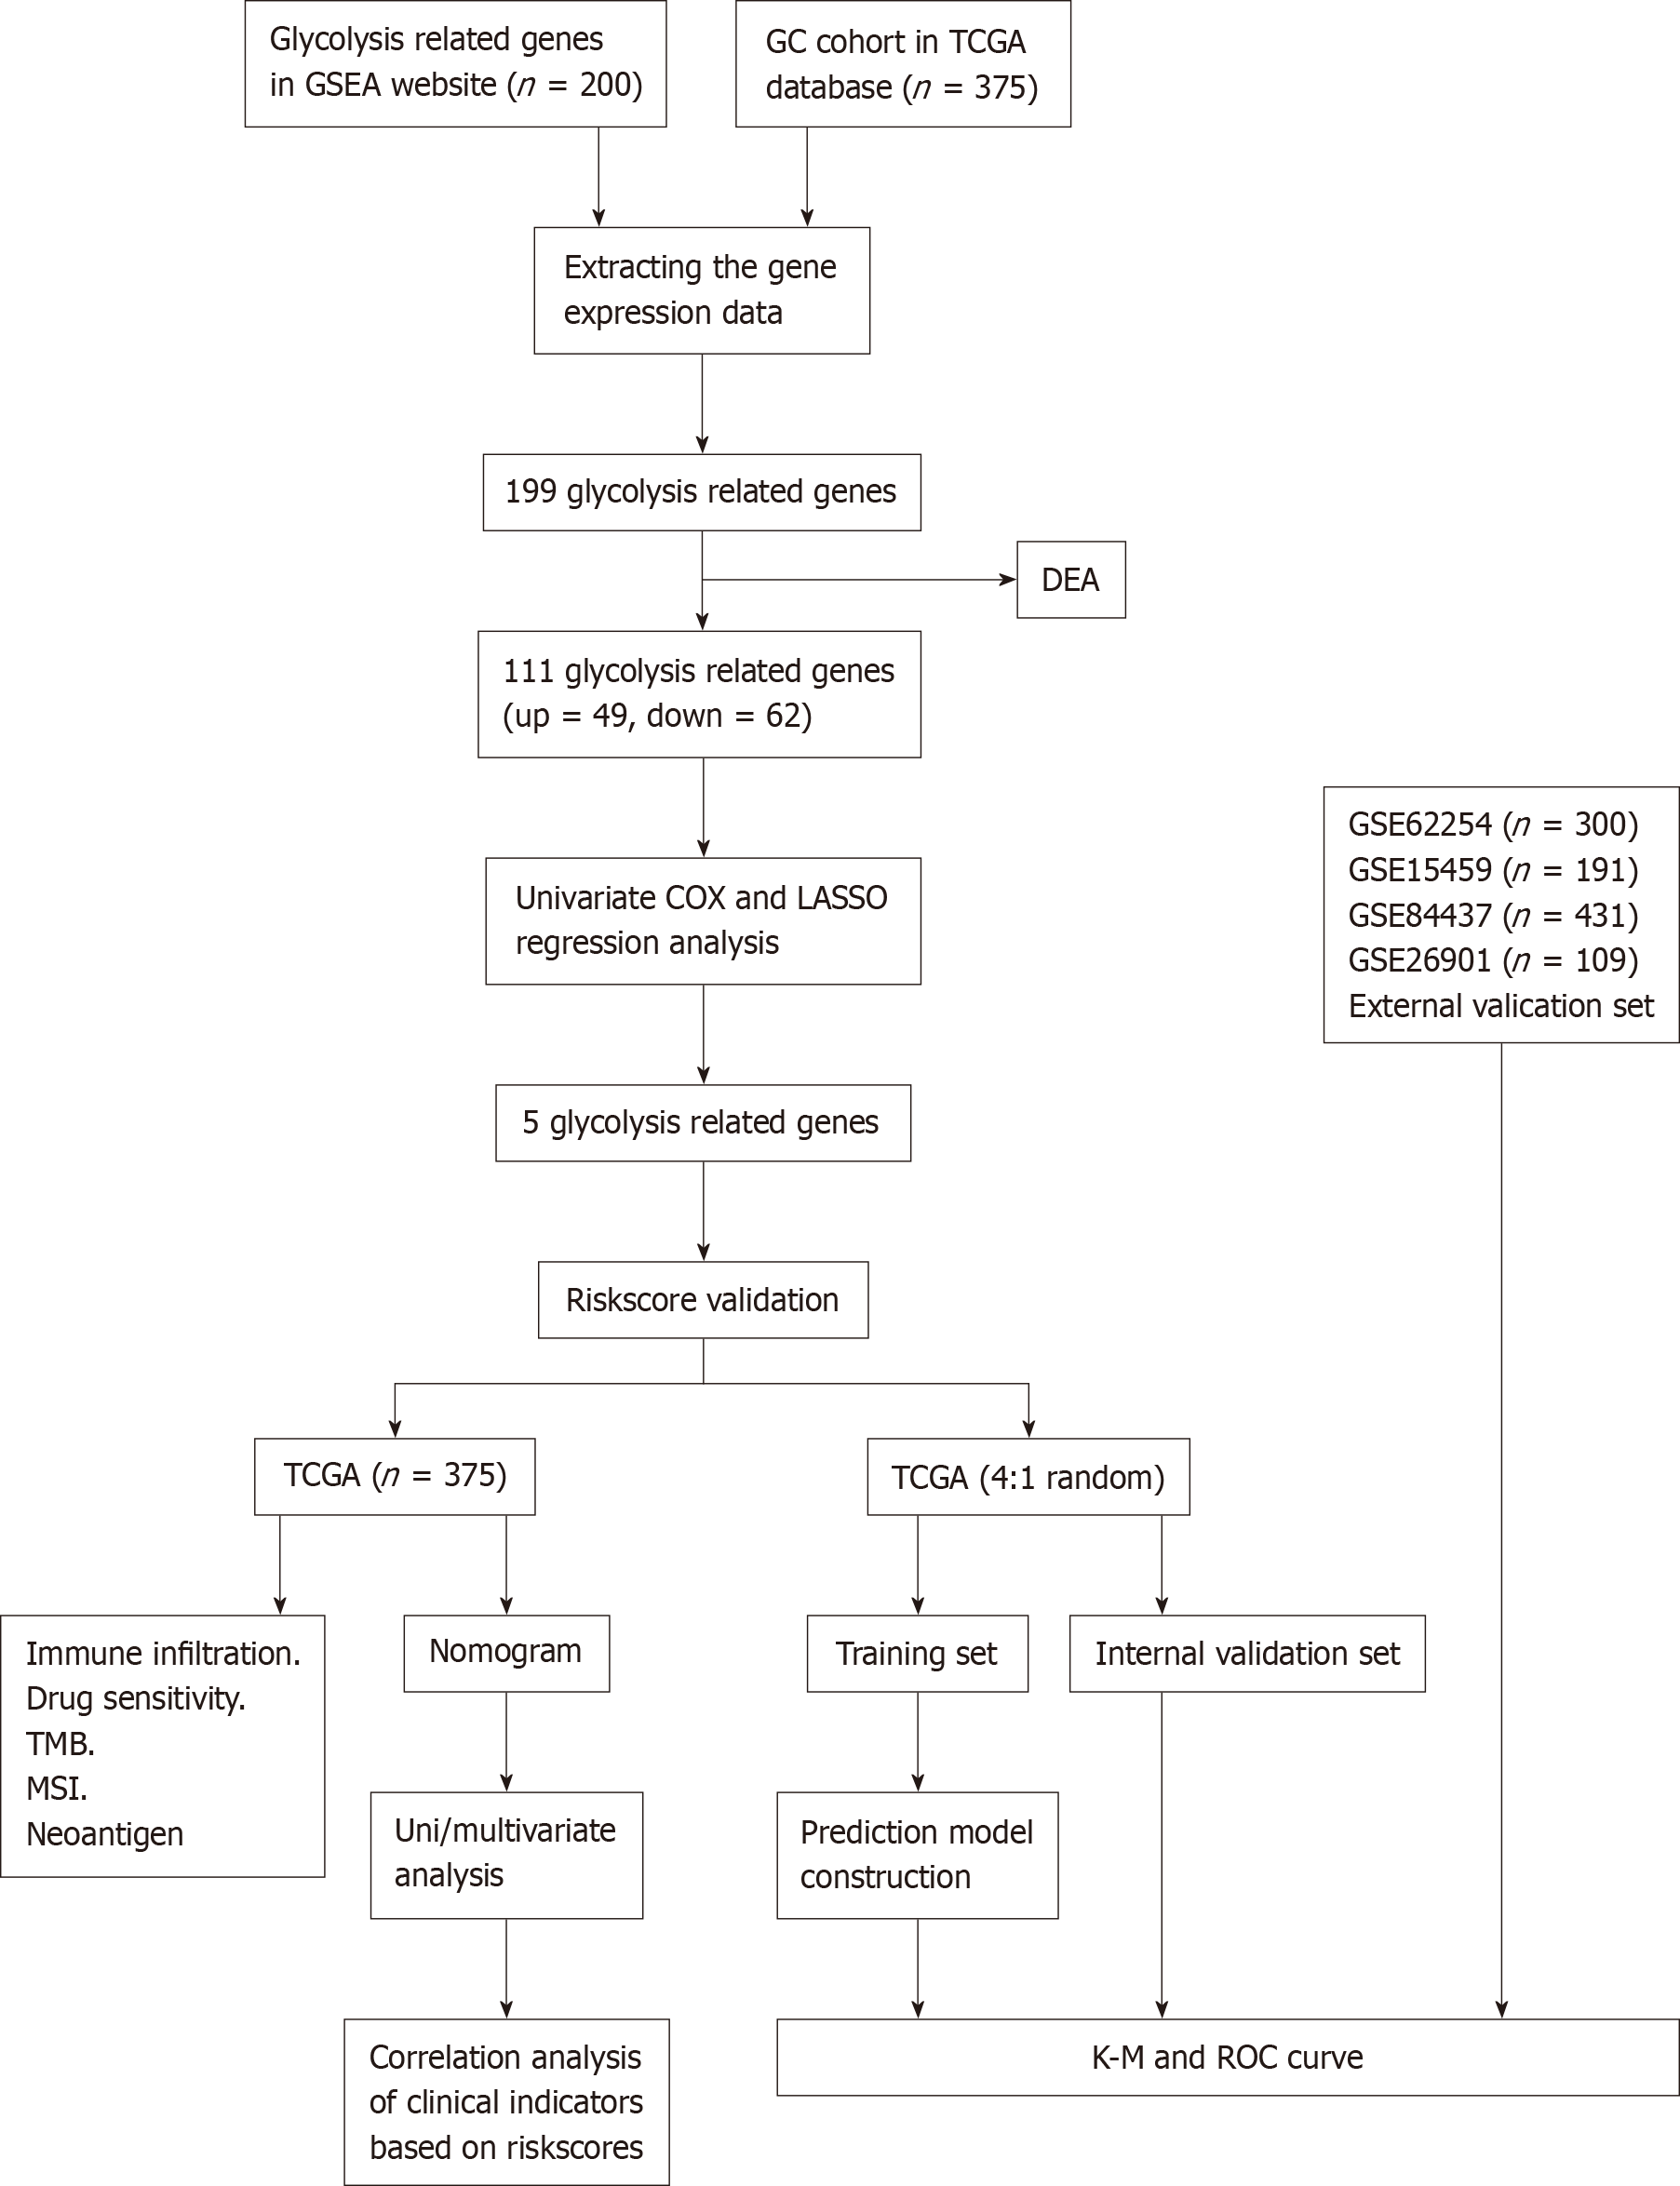
Figure 1 The workflow of construction and validation of the five-gene signature for gastric cancer.
GSEA: Gene set enrichment analysis; GC: Gastric cancer; TCGA: The Cancer Genome Atlas; DEA: Differential expression analysis; LASSO: Least absolute shrinkage and selection operator; TMB: Tumor mutational burden; MSI: Microsatellite instability; K-M: Kaplan-Meier; ROC: Receiver operating characteristic.
Figure 2 Differentially expressed glycolysis genes and their functional analysis.
A: Heatmap of the upregulated (yellow) and downregulated (green) genes between control (blue) and tumor (red) tissues of gastric cancer (GC); B: Volcano plot of the upregulated (red) and downregulated (green) genes between the normal (blue) and tumor (red) samples of GC; C and D: Gene Ontology enrichment (C) and Kyoto Encyclopedia of Genes and Genomes (D) analysis of the 111 differential expressed glycolysis genes in GC; E: Interaction network of 111 differential expressed glycolysis genes. FC: Fold change.
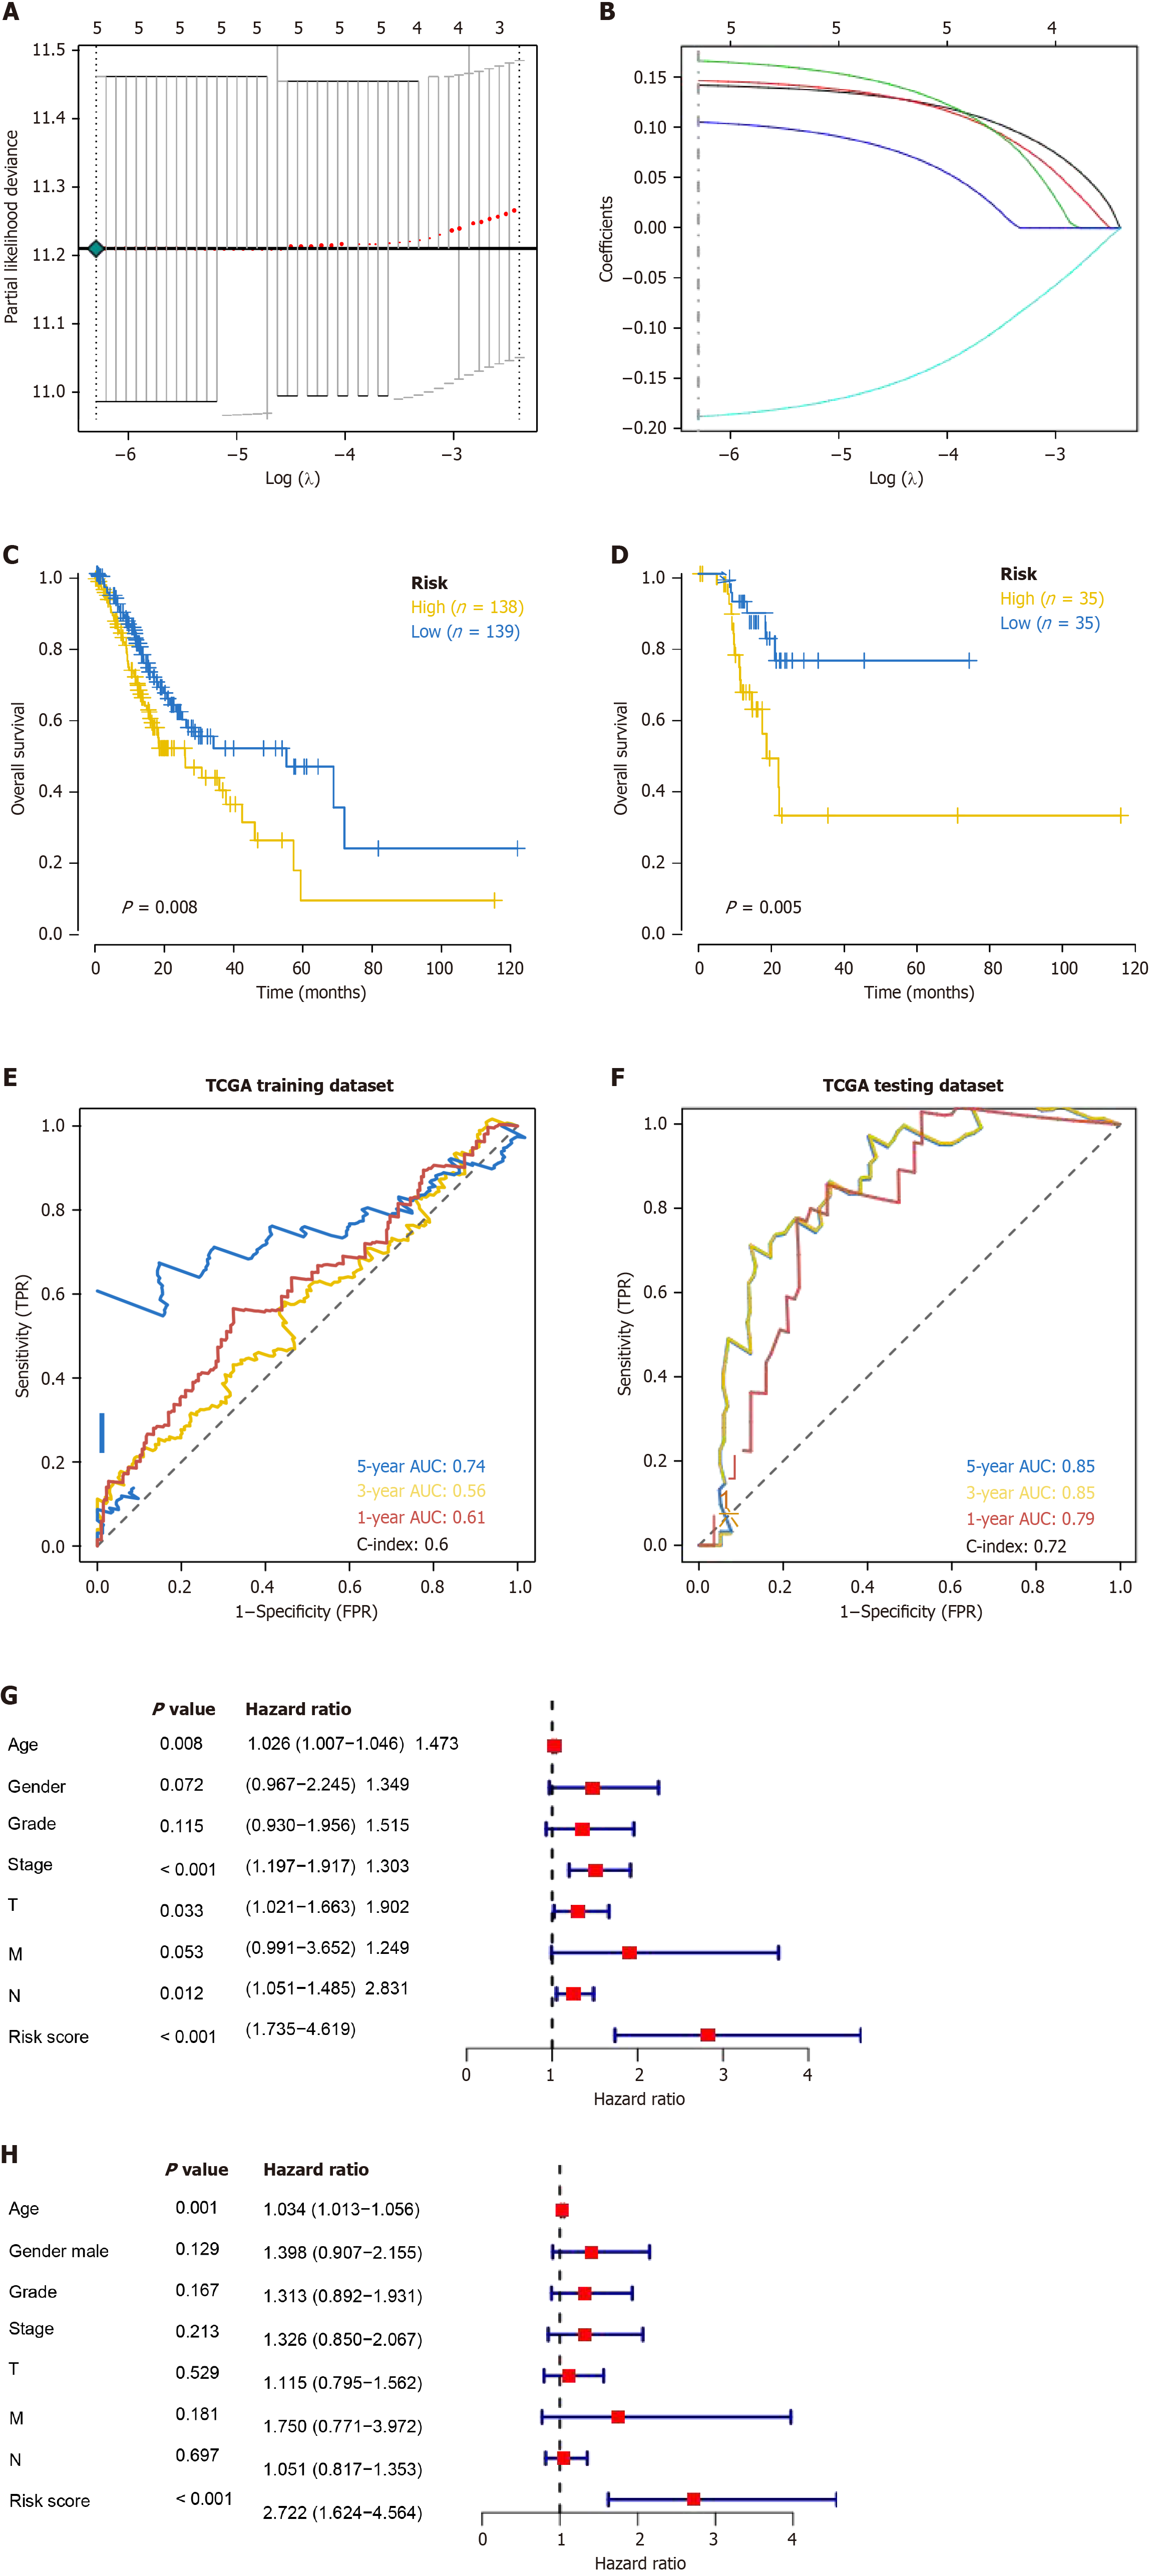
Figure 3 Least absolute shrinkage and selection operator Cox regression analysis for the screening of prognostic genes and con
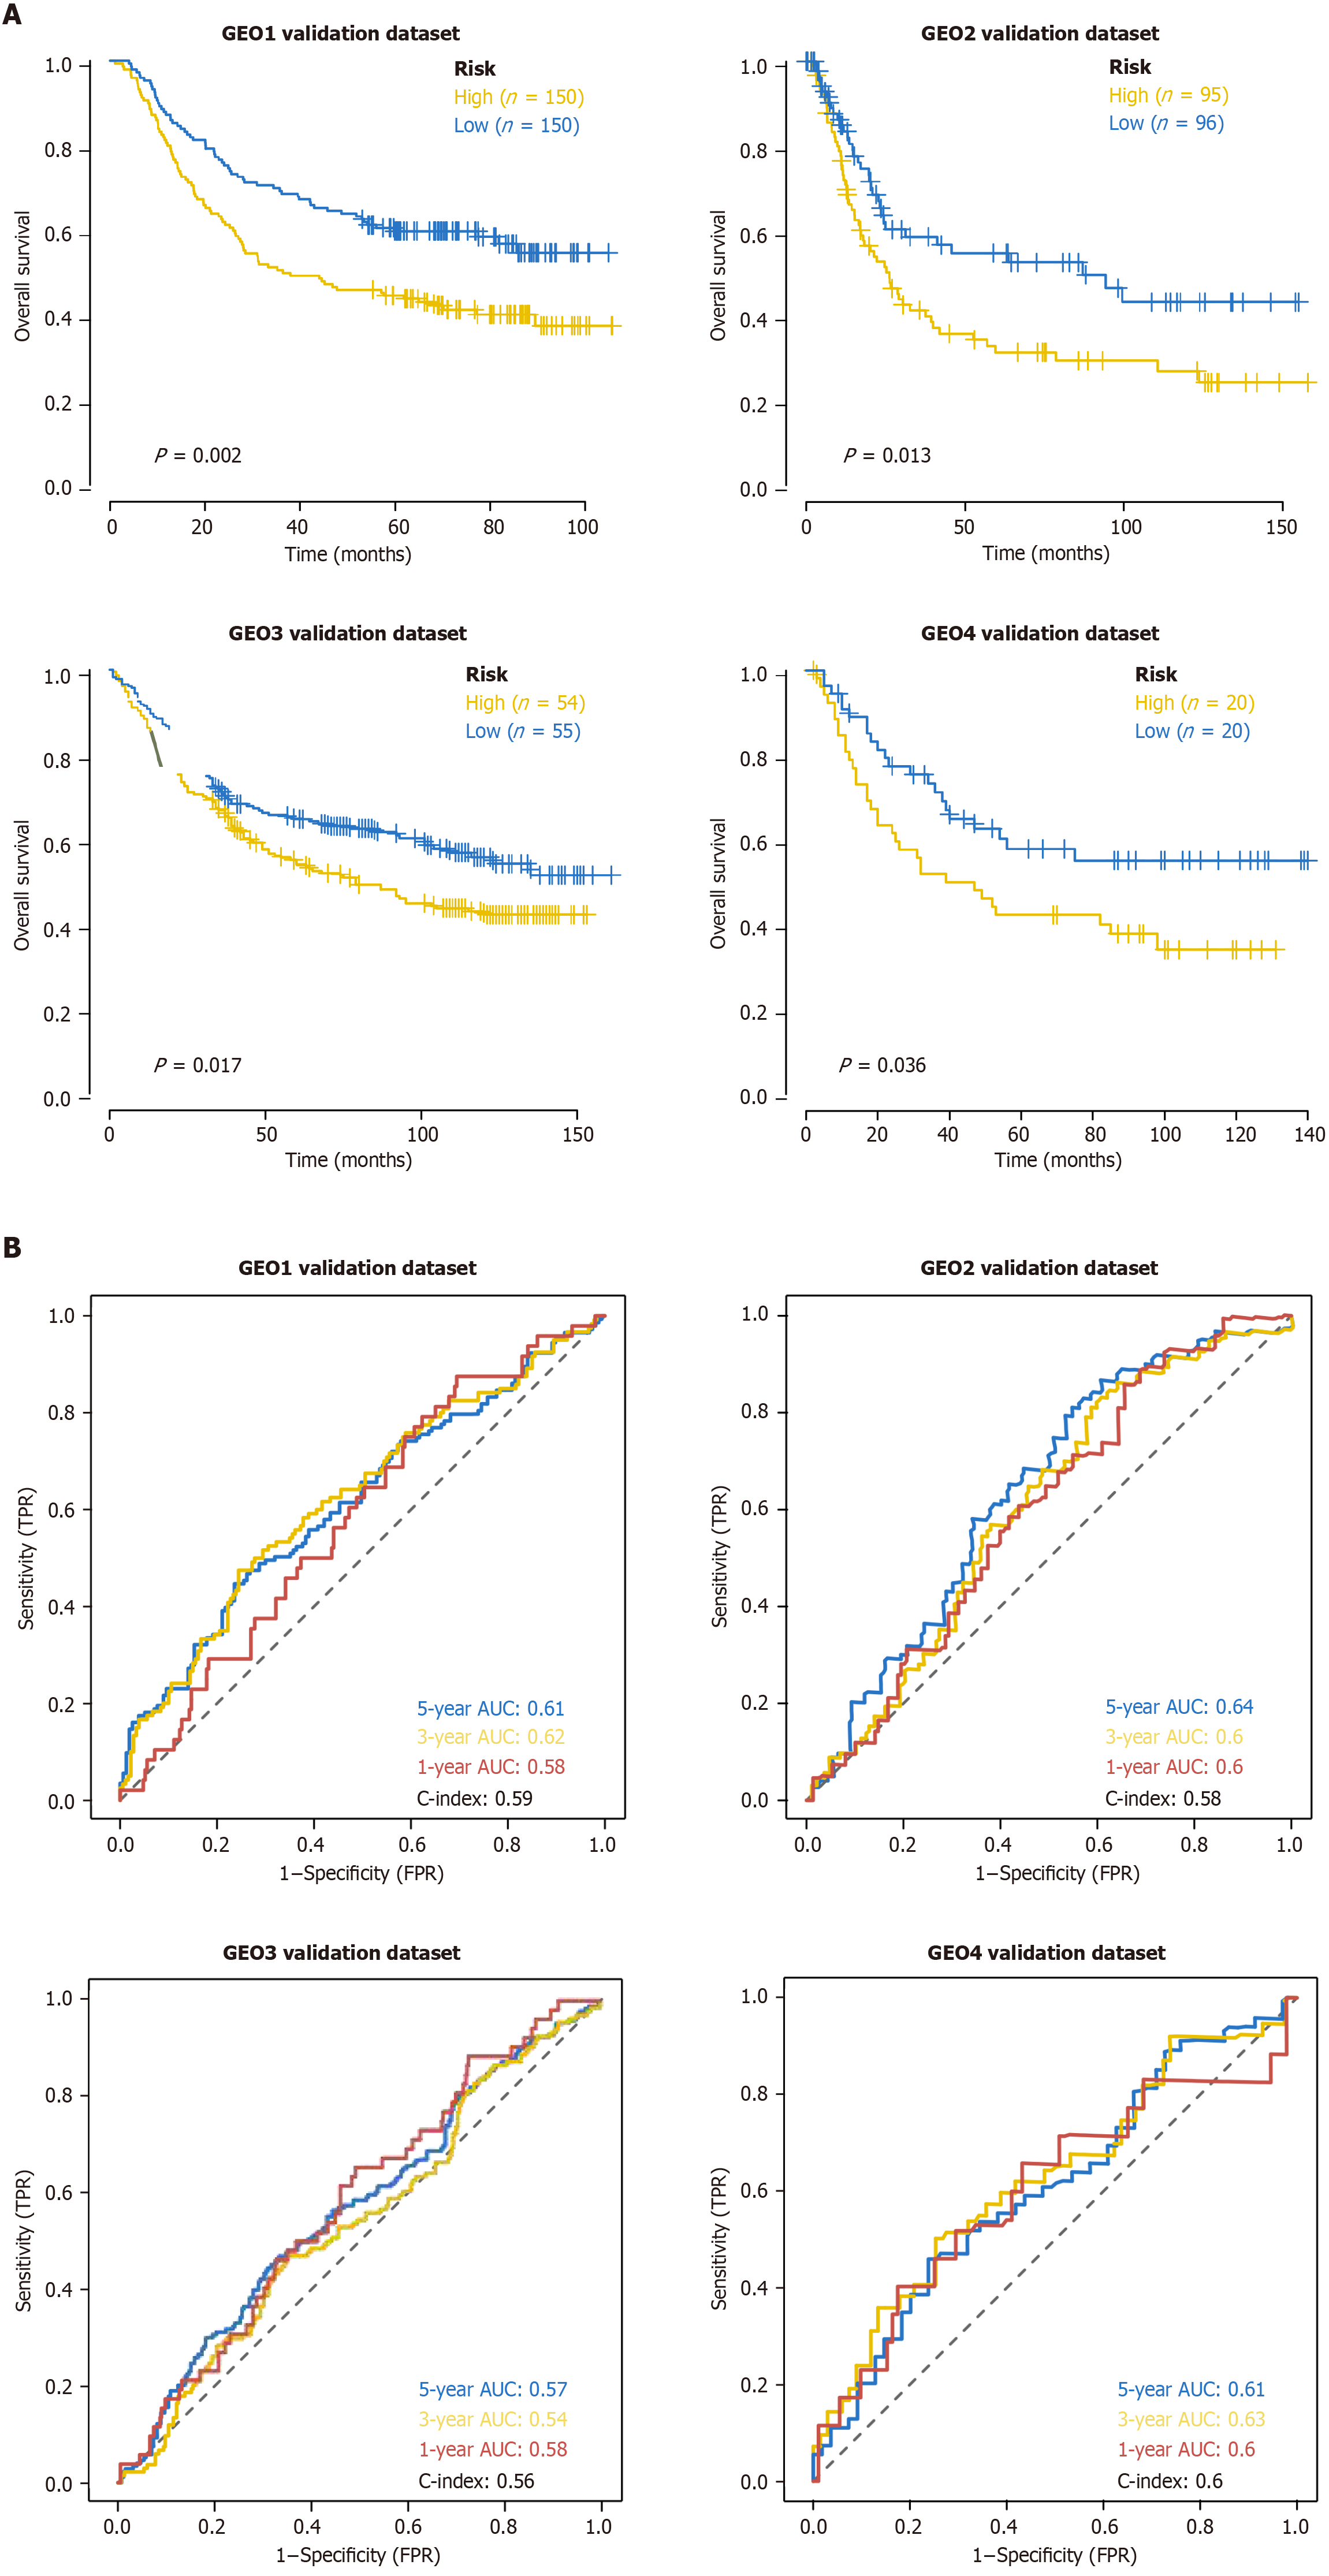
Figure 4 External validation of risk model in different glycolysis status.
A: Kaplan-Meier survival analysis of different glycolysis status in four external validation data (yellow: High glycolysis status; blue: Low glycolysis status); B: Receiver operating characteristic curves of four external validation data for risk models. Red: 1 year, yellow: 3 years, and blue: 5 years. TPR: True positive rate; FPR: False positive rate; AUC: Area under the receiver operating characteristic curve.
Figure 5 Nomogram combining glycolysis-related risk score and clinicopathological parameters for predicting gastric cancer patients’ survival.
A: Construction of a nomogram including age, gender, grade, stage, T, N, M and risk score to predict 3- and 5-year overall survival (OS); B and C: A greement between predicted and observed 3- and 5-year OS. Dashed line indicated ideal performance. The actual performances were indicated by blue line (3-year OS) (B) and red line (5-year OS) (C); D: Merged results. OS: Overall survival.
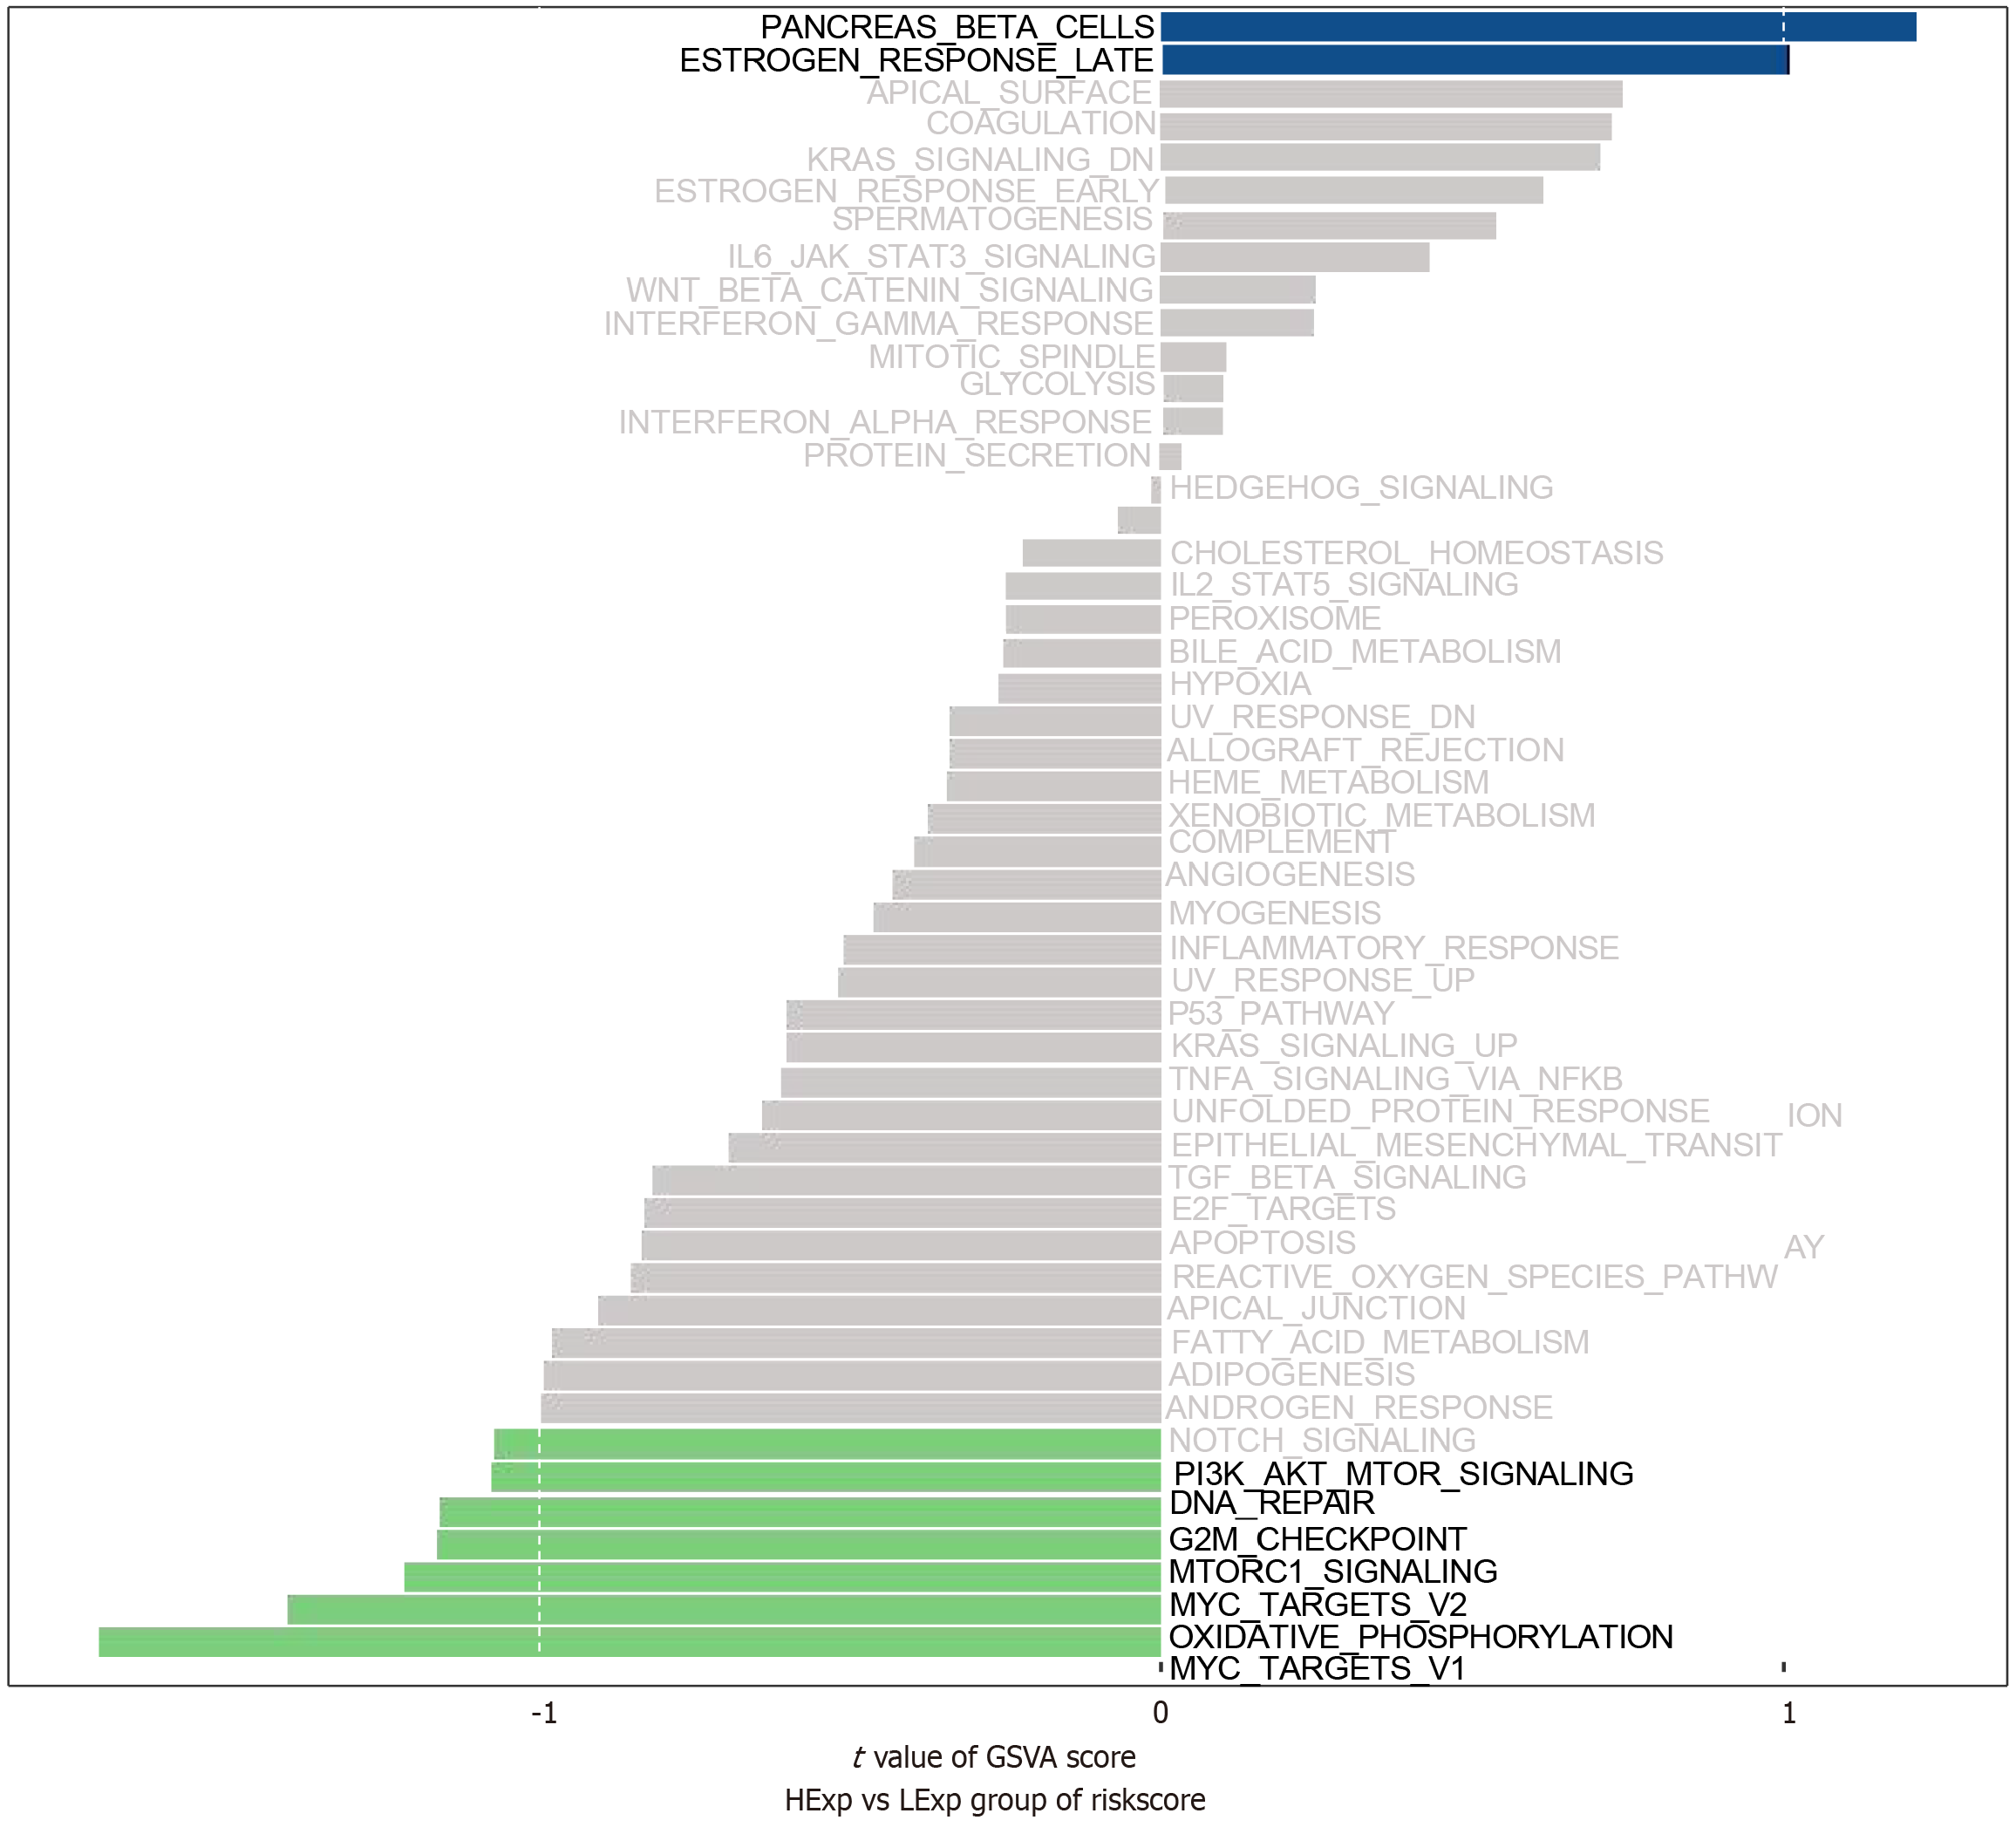
Figure 6 Gene-set variation analysis and correlation between different glycolysis status in gastric cancer.
Blue: High glycolysis status group. Green: Low glycolysis status group.
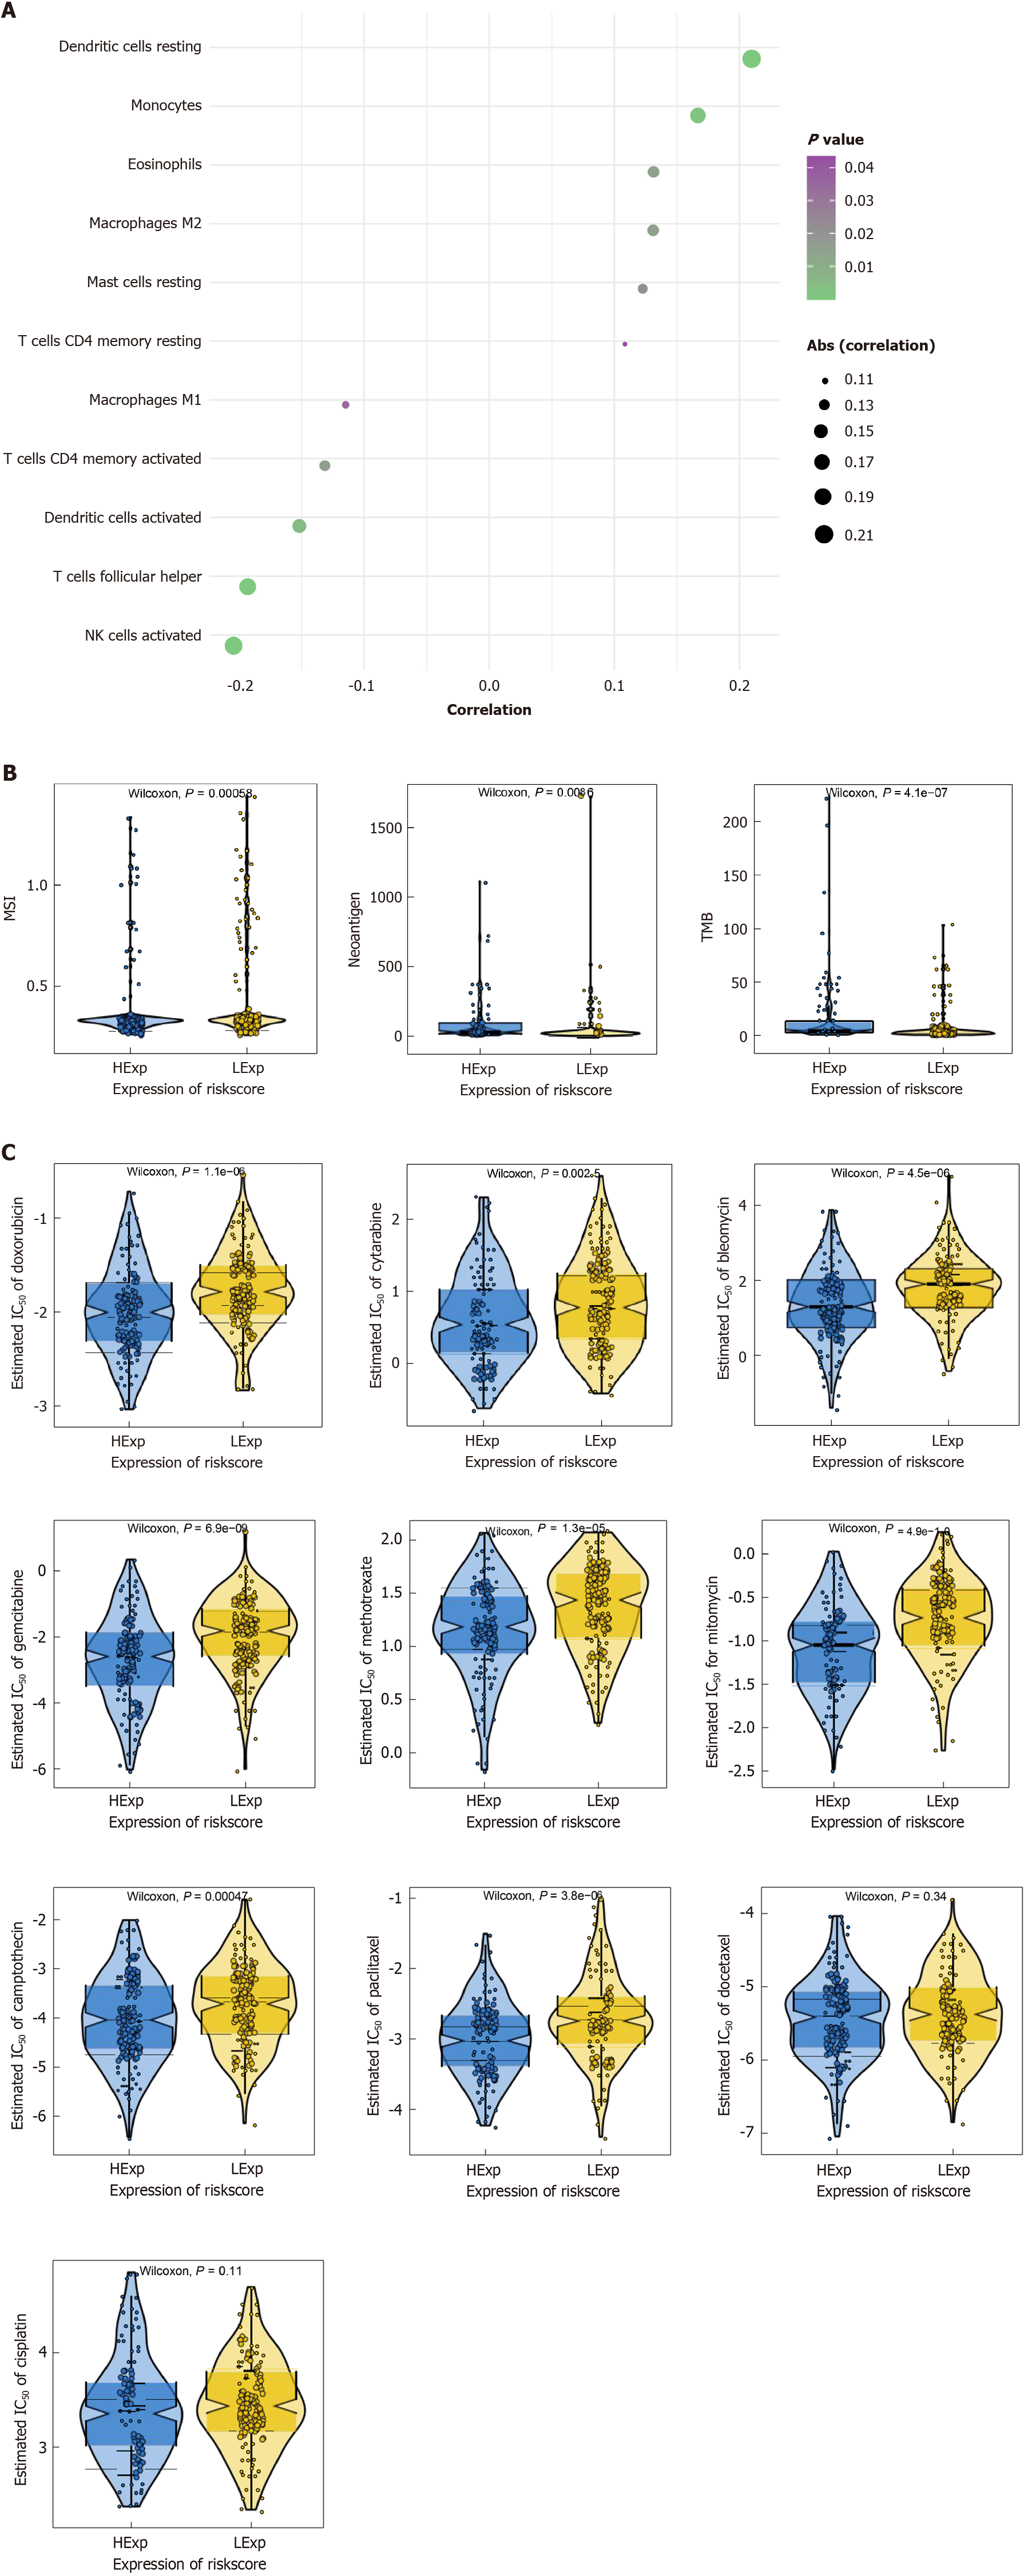
Figure 7 Correlation between different glycolysis status and immune cell infiltration and multiomics analysis including tumor mutational burden, neoantigen, microsatellite instability and drug sensitivity in patients with different glycolysis status.
A: Different immune cell infiltration between different glycolysis status; B: Tumor mutational burden, neoantigen, microsatellite instability between patients with different glycolysis status; C: Drug sensitivity between patients with different glycolysis status. P < 0.05 indicates statistical significance. TMB: Tumor mutational burden; MSI: Microsatellite instability.
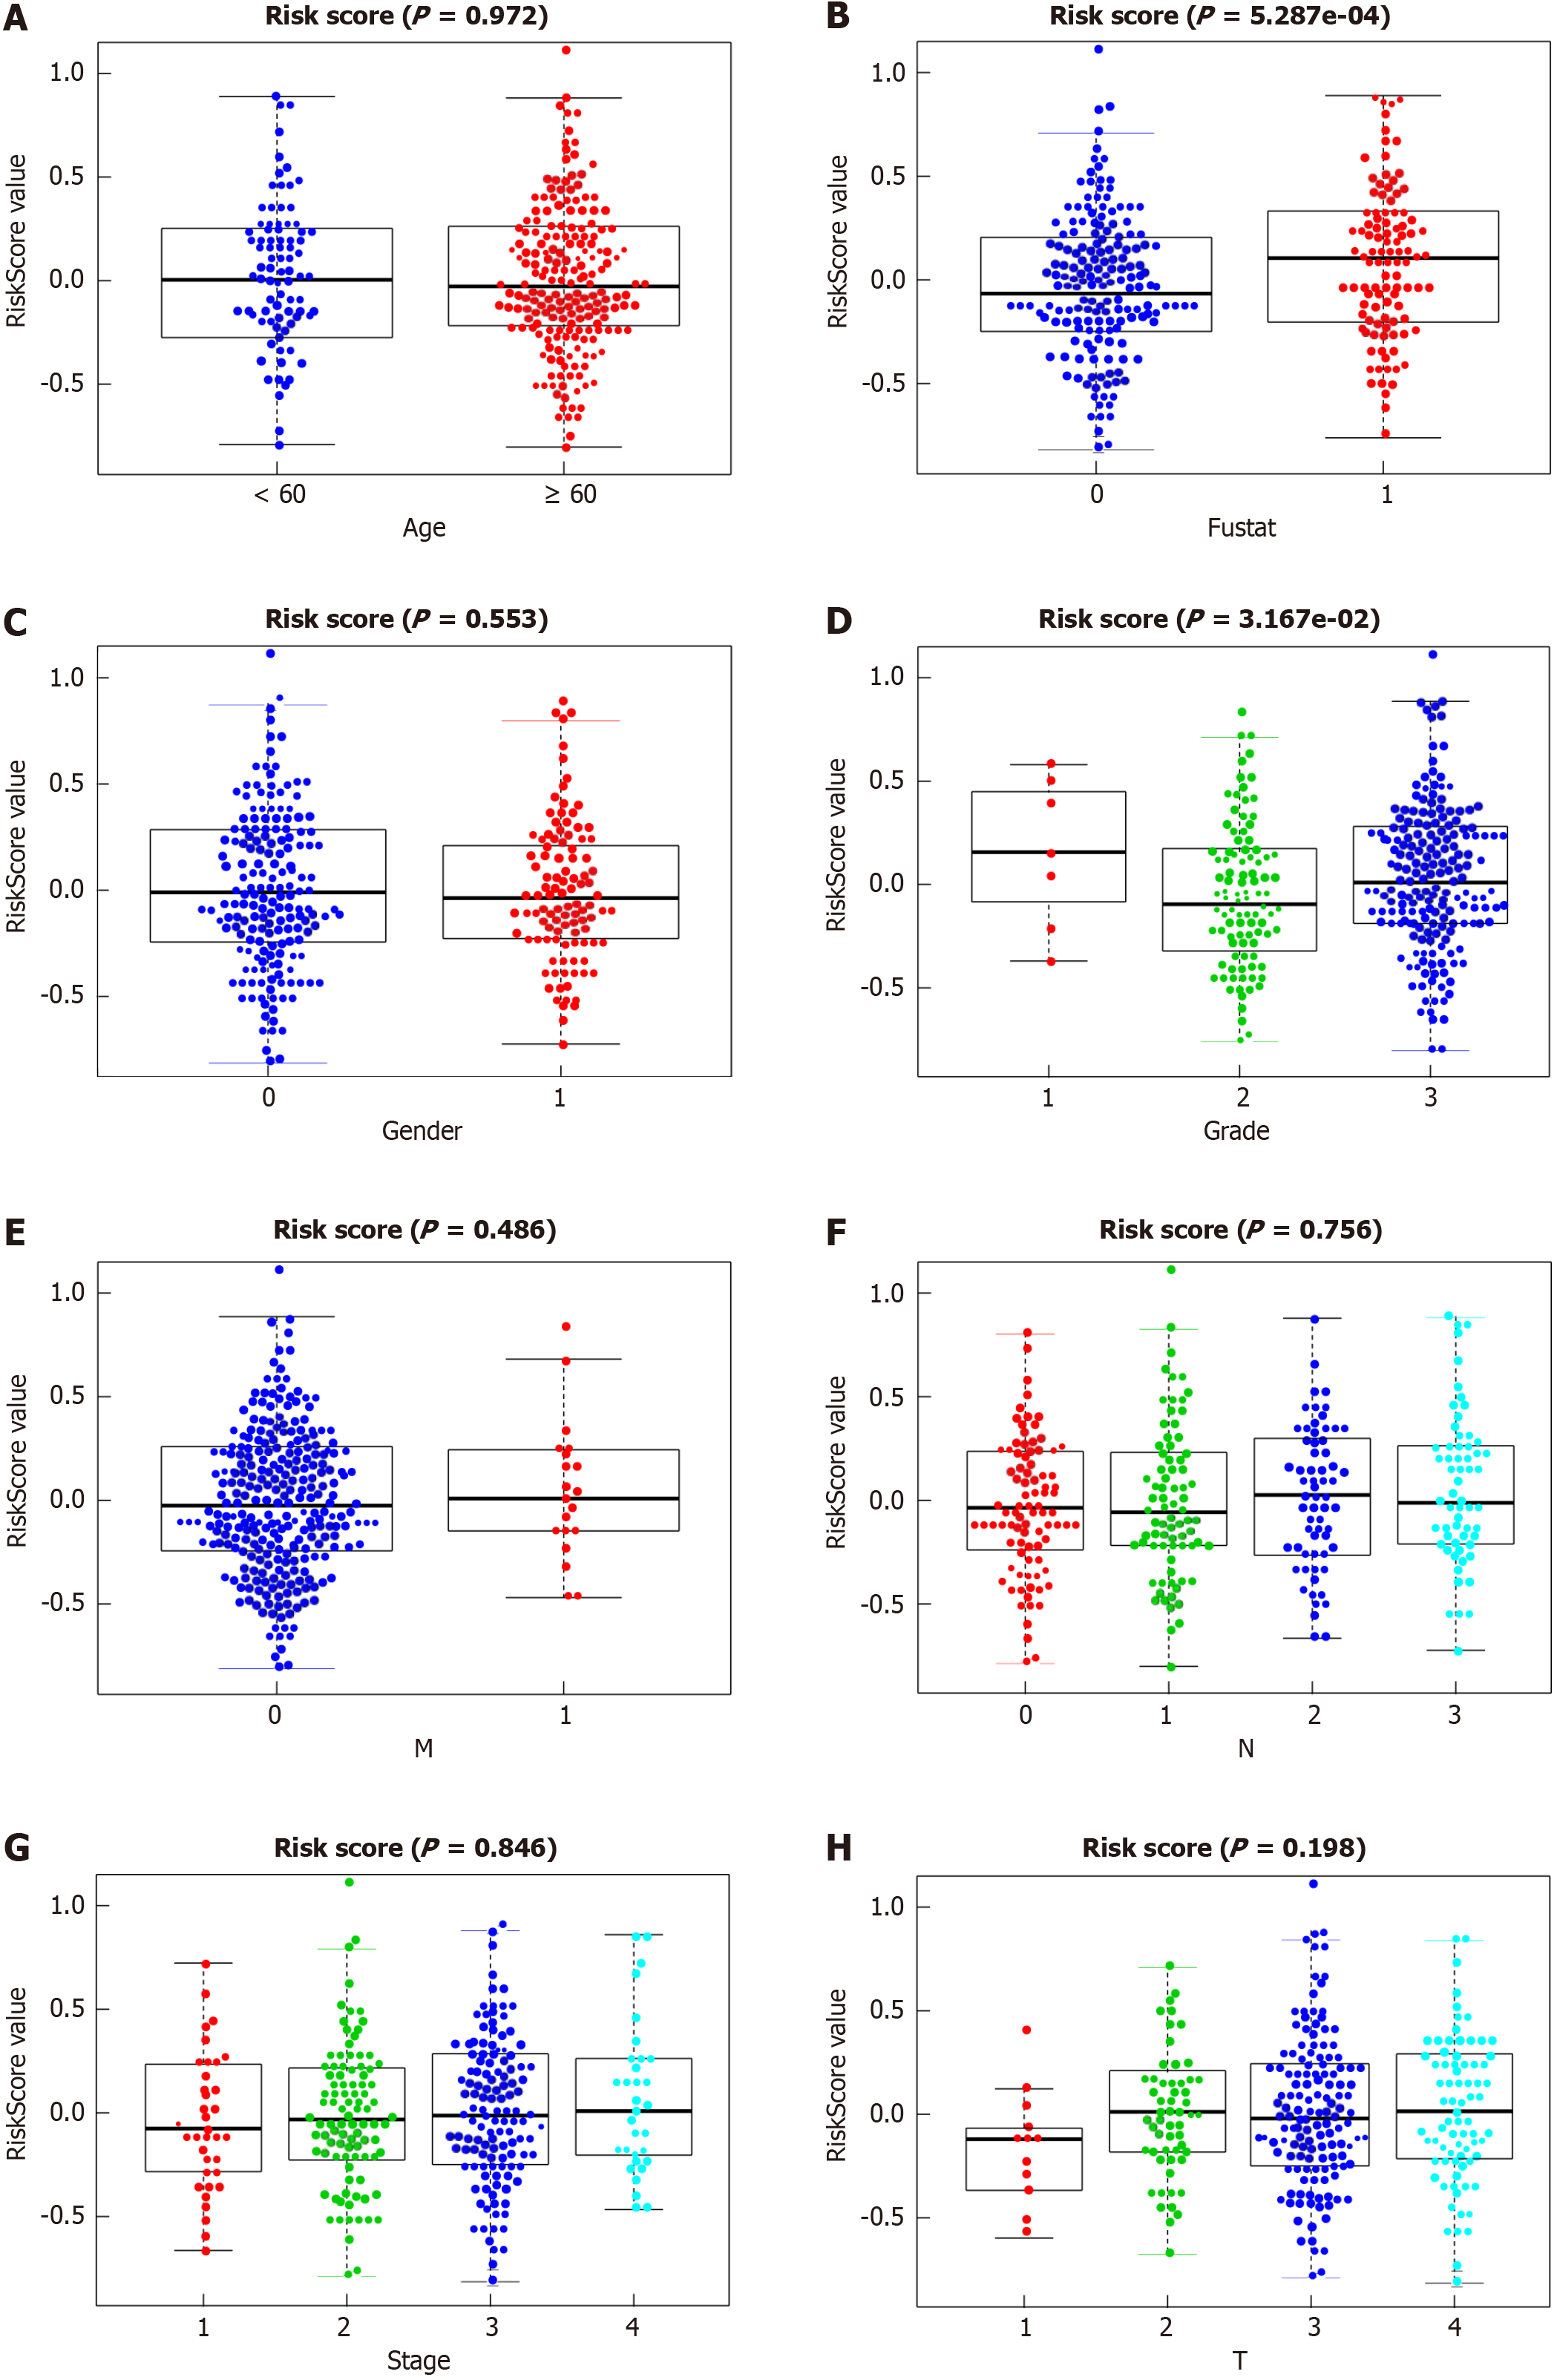
Figure 8 Correlation between patients with different clinicopathological parameters and different glycolysis status.
Gender (0: Male, 1: Female), fustat (0: Live, 1: Dead). P < 0.05 indicates statistical significance. A: Age; B: Survival state; C: Gender; D: Pathological grade; E: M stage; F: N stage; G: Tumor-node-metastasis stage; H: T stage.
- Citation: Meng XY, Yang D, Zhang B, Zhang T, Zheng ZC, Zhao Y. Glycolysis-related five-gene signature correlates with prognosis and immune infiltration in gastric cancer. World J Gastrointest Oncol 2024; 16(7): 3097-3117
- URL: https://www.wjgnet.com/1948-5204/full/v16/i7/3097.htm
- DOI: https://dx.doi.org/10.4251/wjgo.v16.i7.3097


