Copyright
©The Author(s) 2024.
World J Gastrointest Oncol. Jul 15, 2024; 16(7): 2988-2998
Published online Jul 15, 2024. doi: 10.4251/wjgo.v16.i7.2988
Published online Jul 15, 2024. doi: 10.4251/wjgo.v16.i7.2988
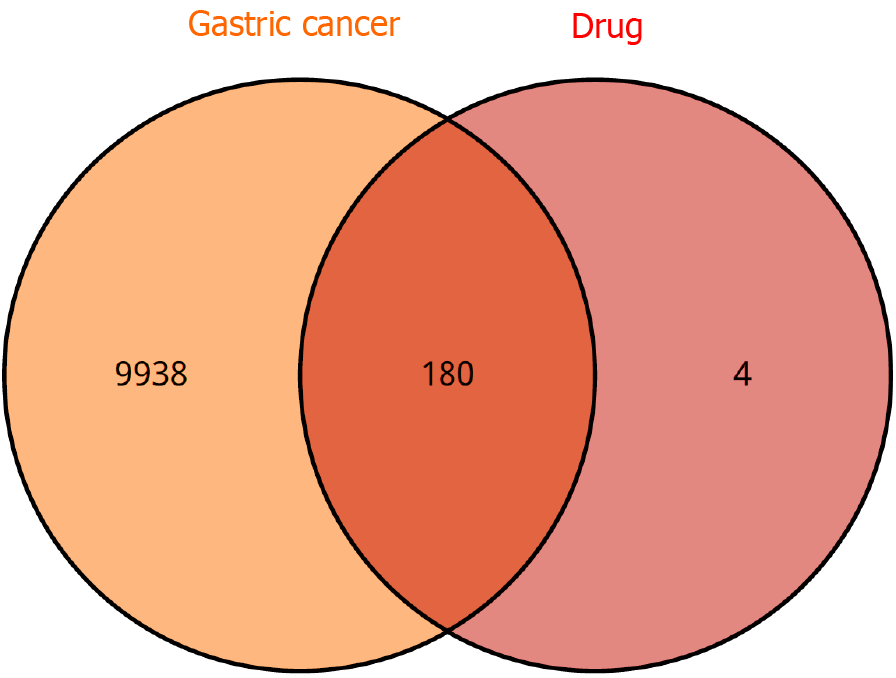
Figure 1 Venn diagram of drug targets and disease targets.
In total, 180 overlapping genes were identified between gastric cancer-related genes and drug-related genes.
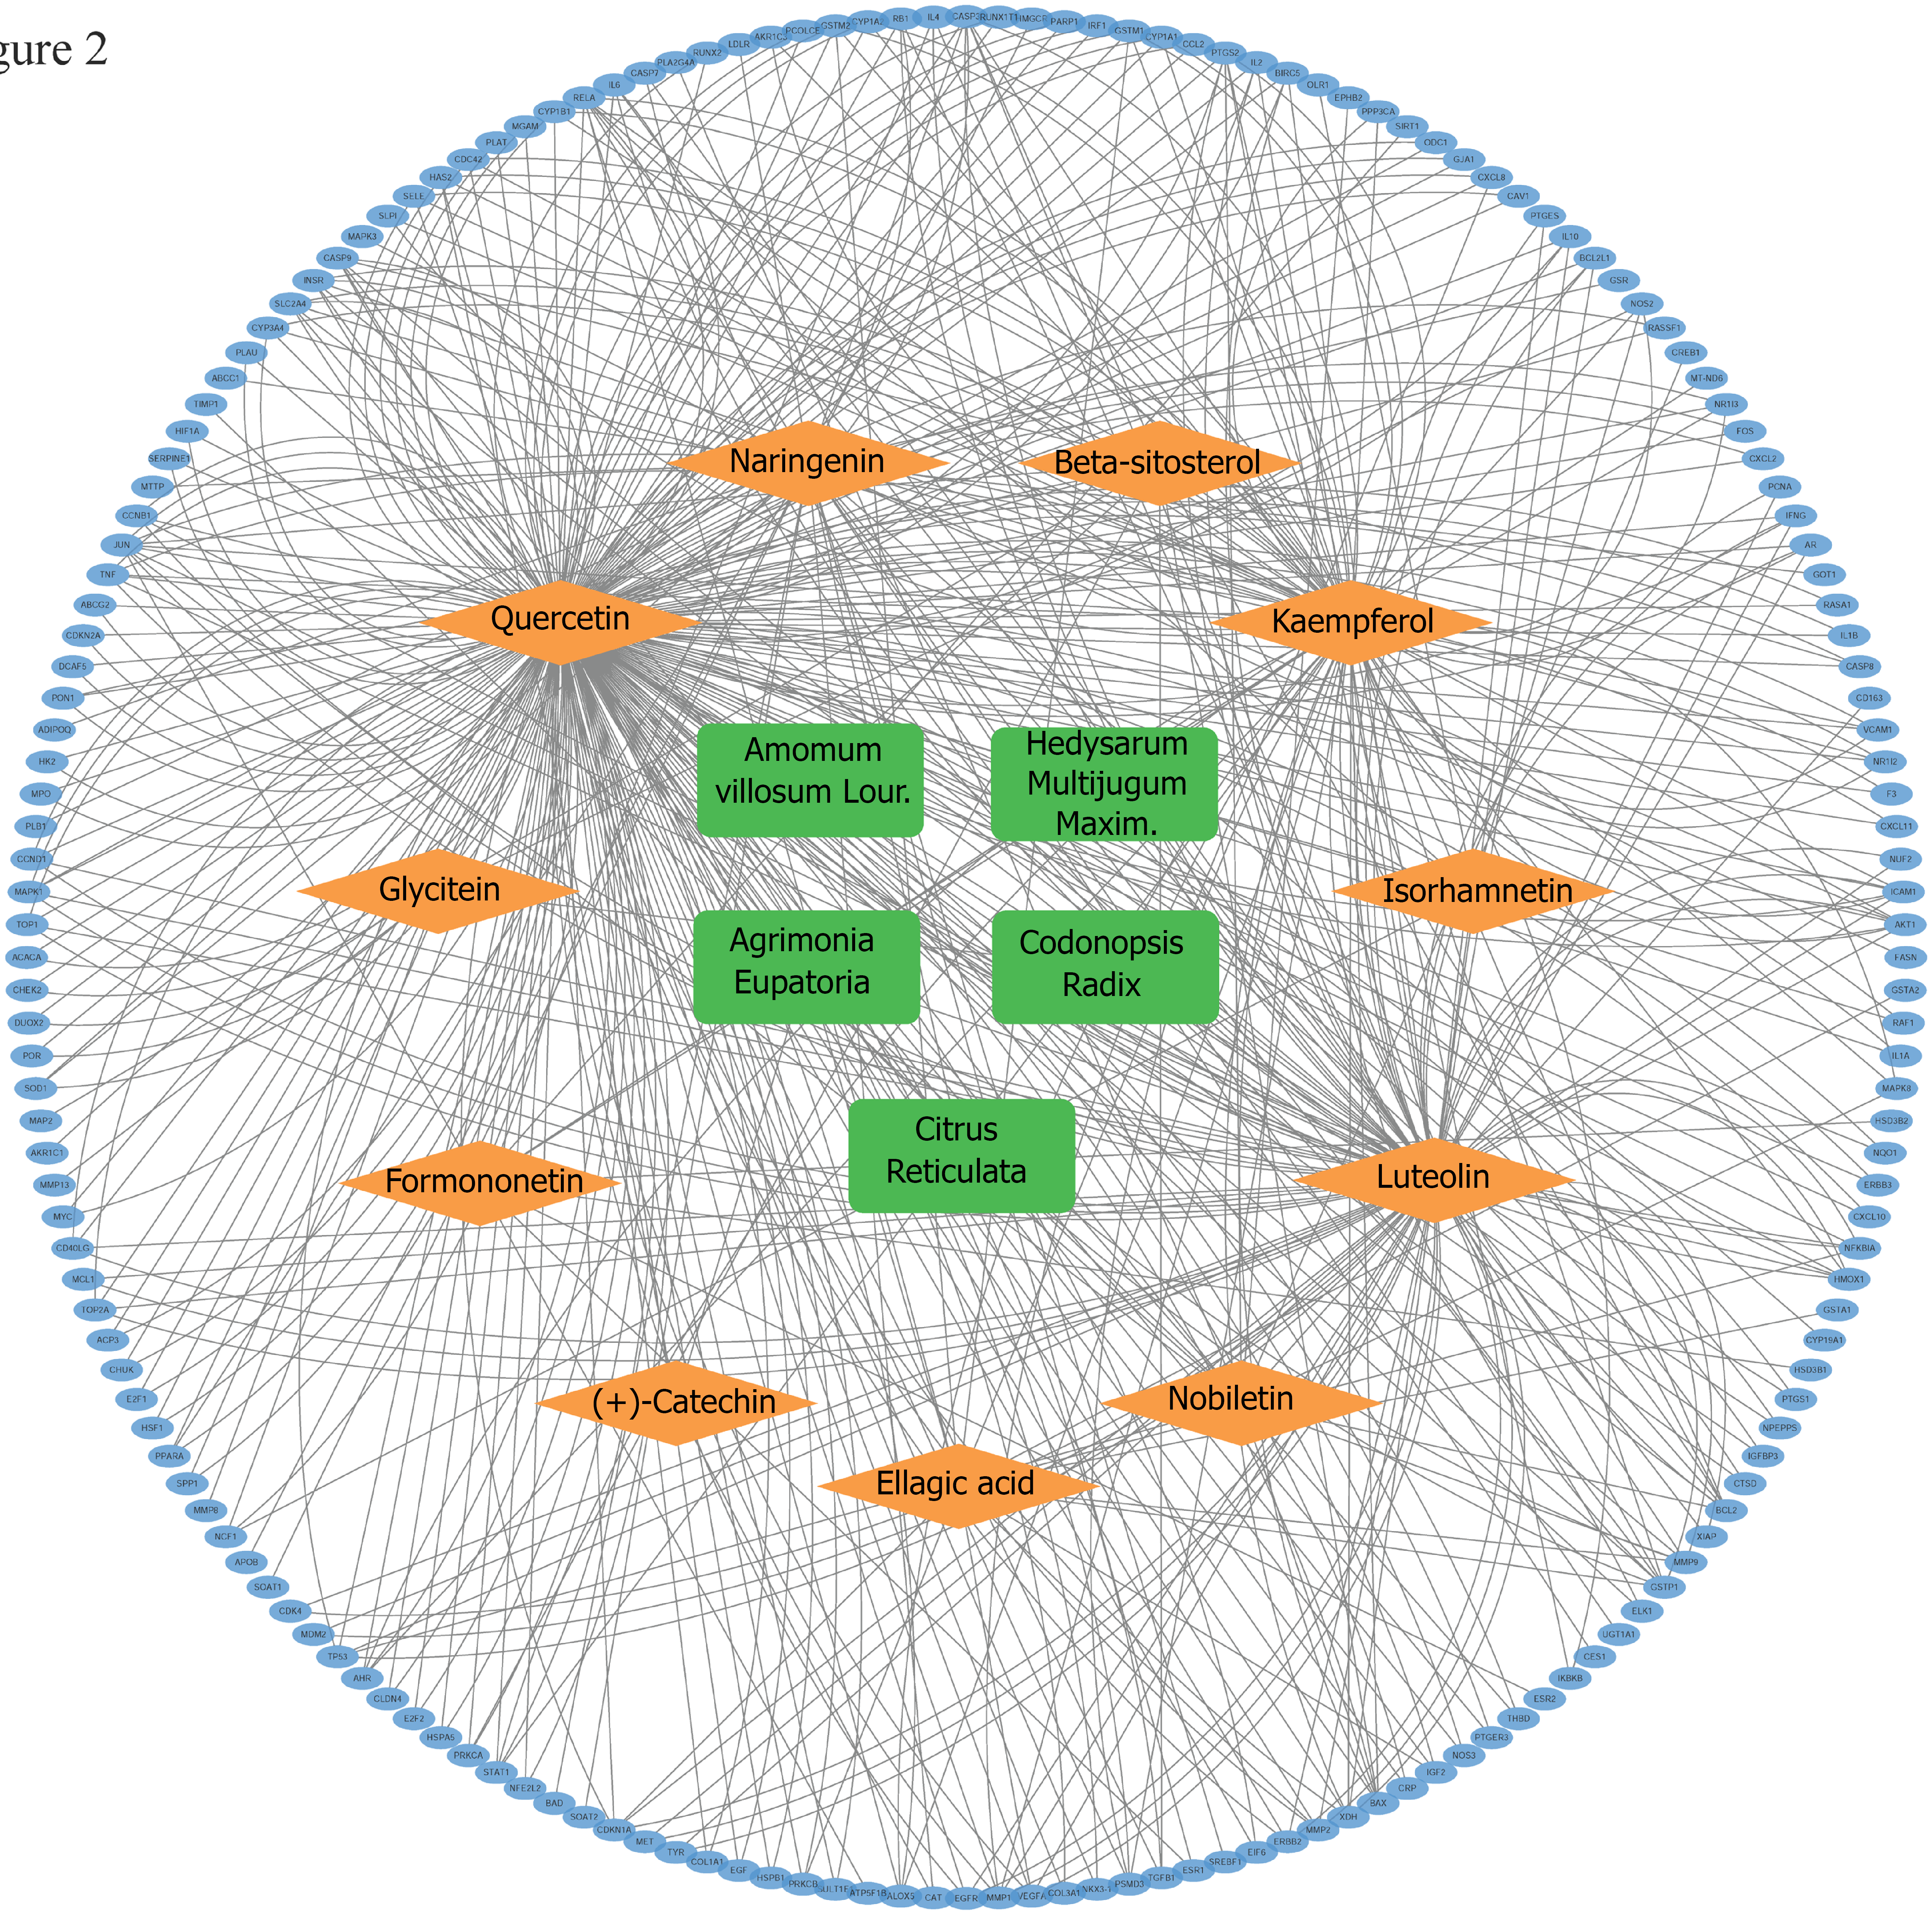
Figure 2 Active ingredient-core target interaction network.
Green, orange, and blue indicate drug, active ingredient, and targeted gene, respectively.
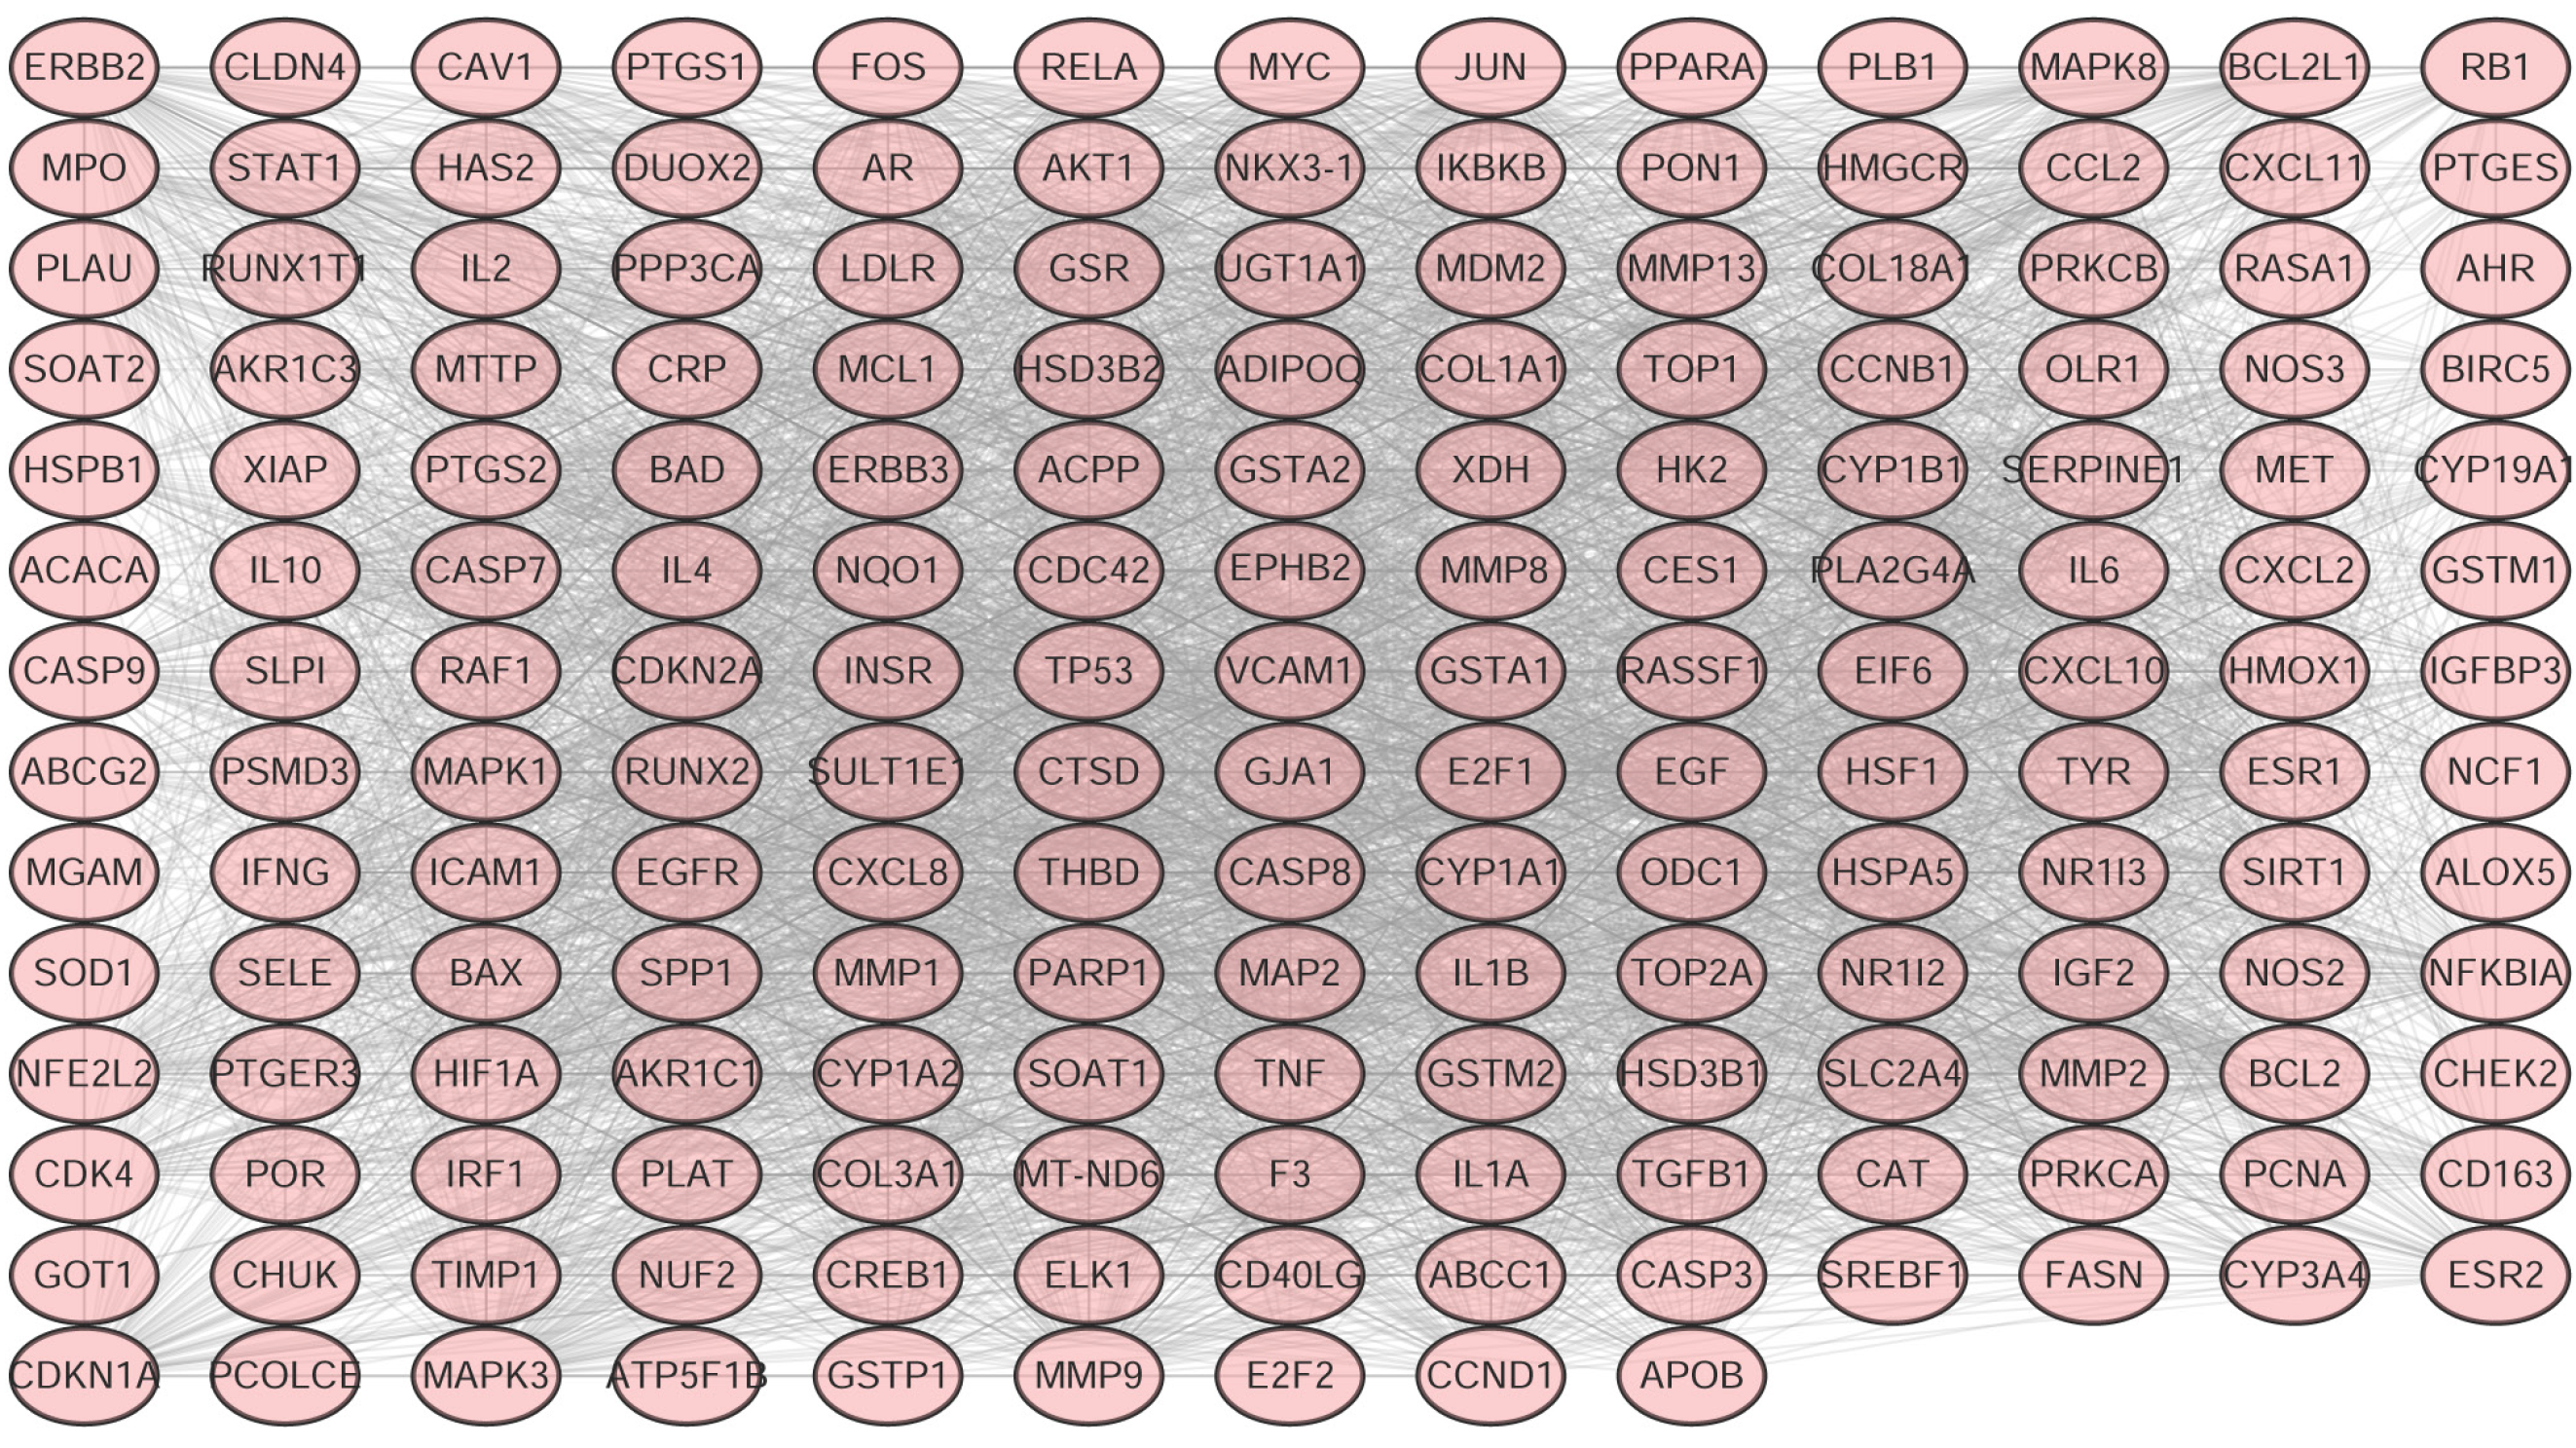
Figure 3 Protein-protein interaction network of intersecting genes.
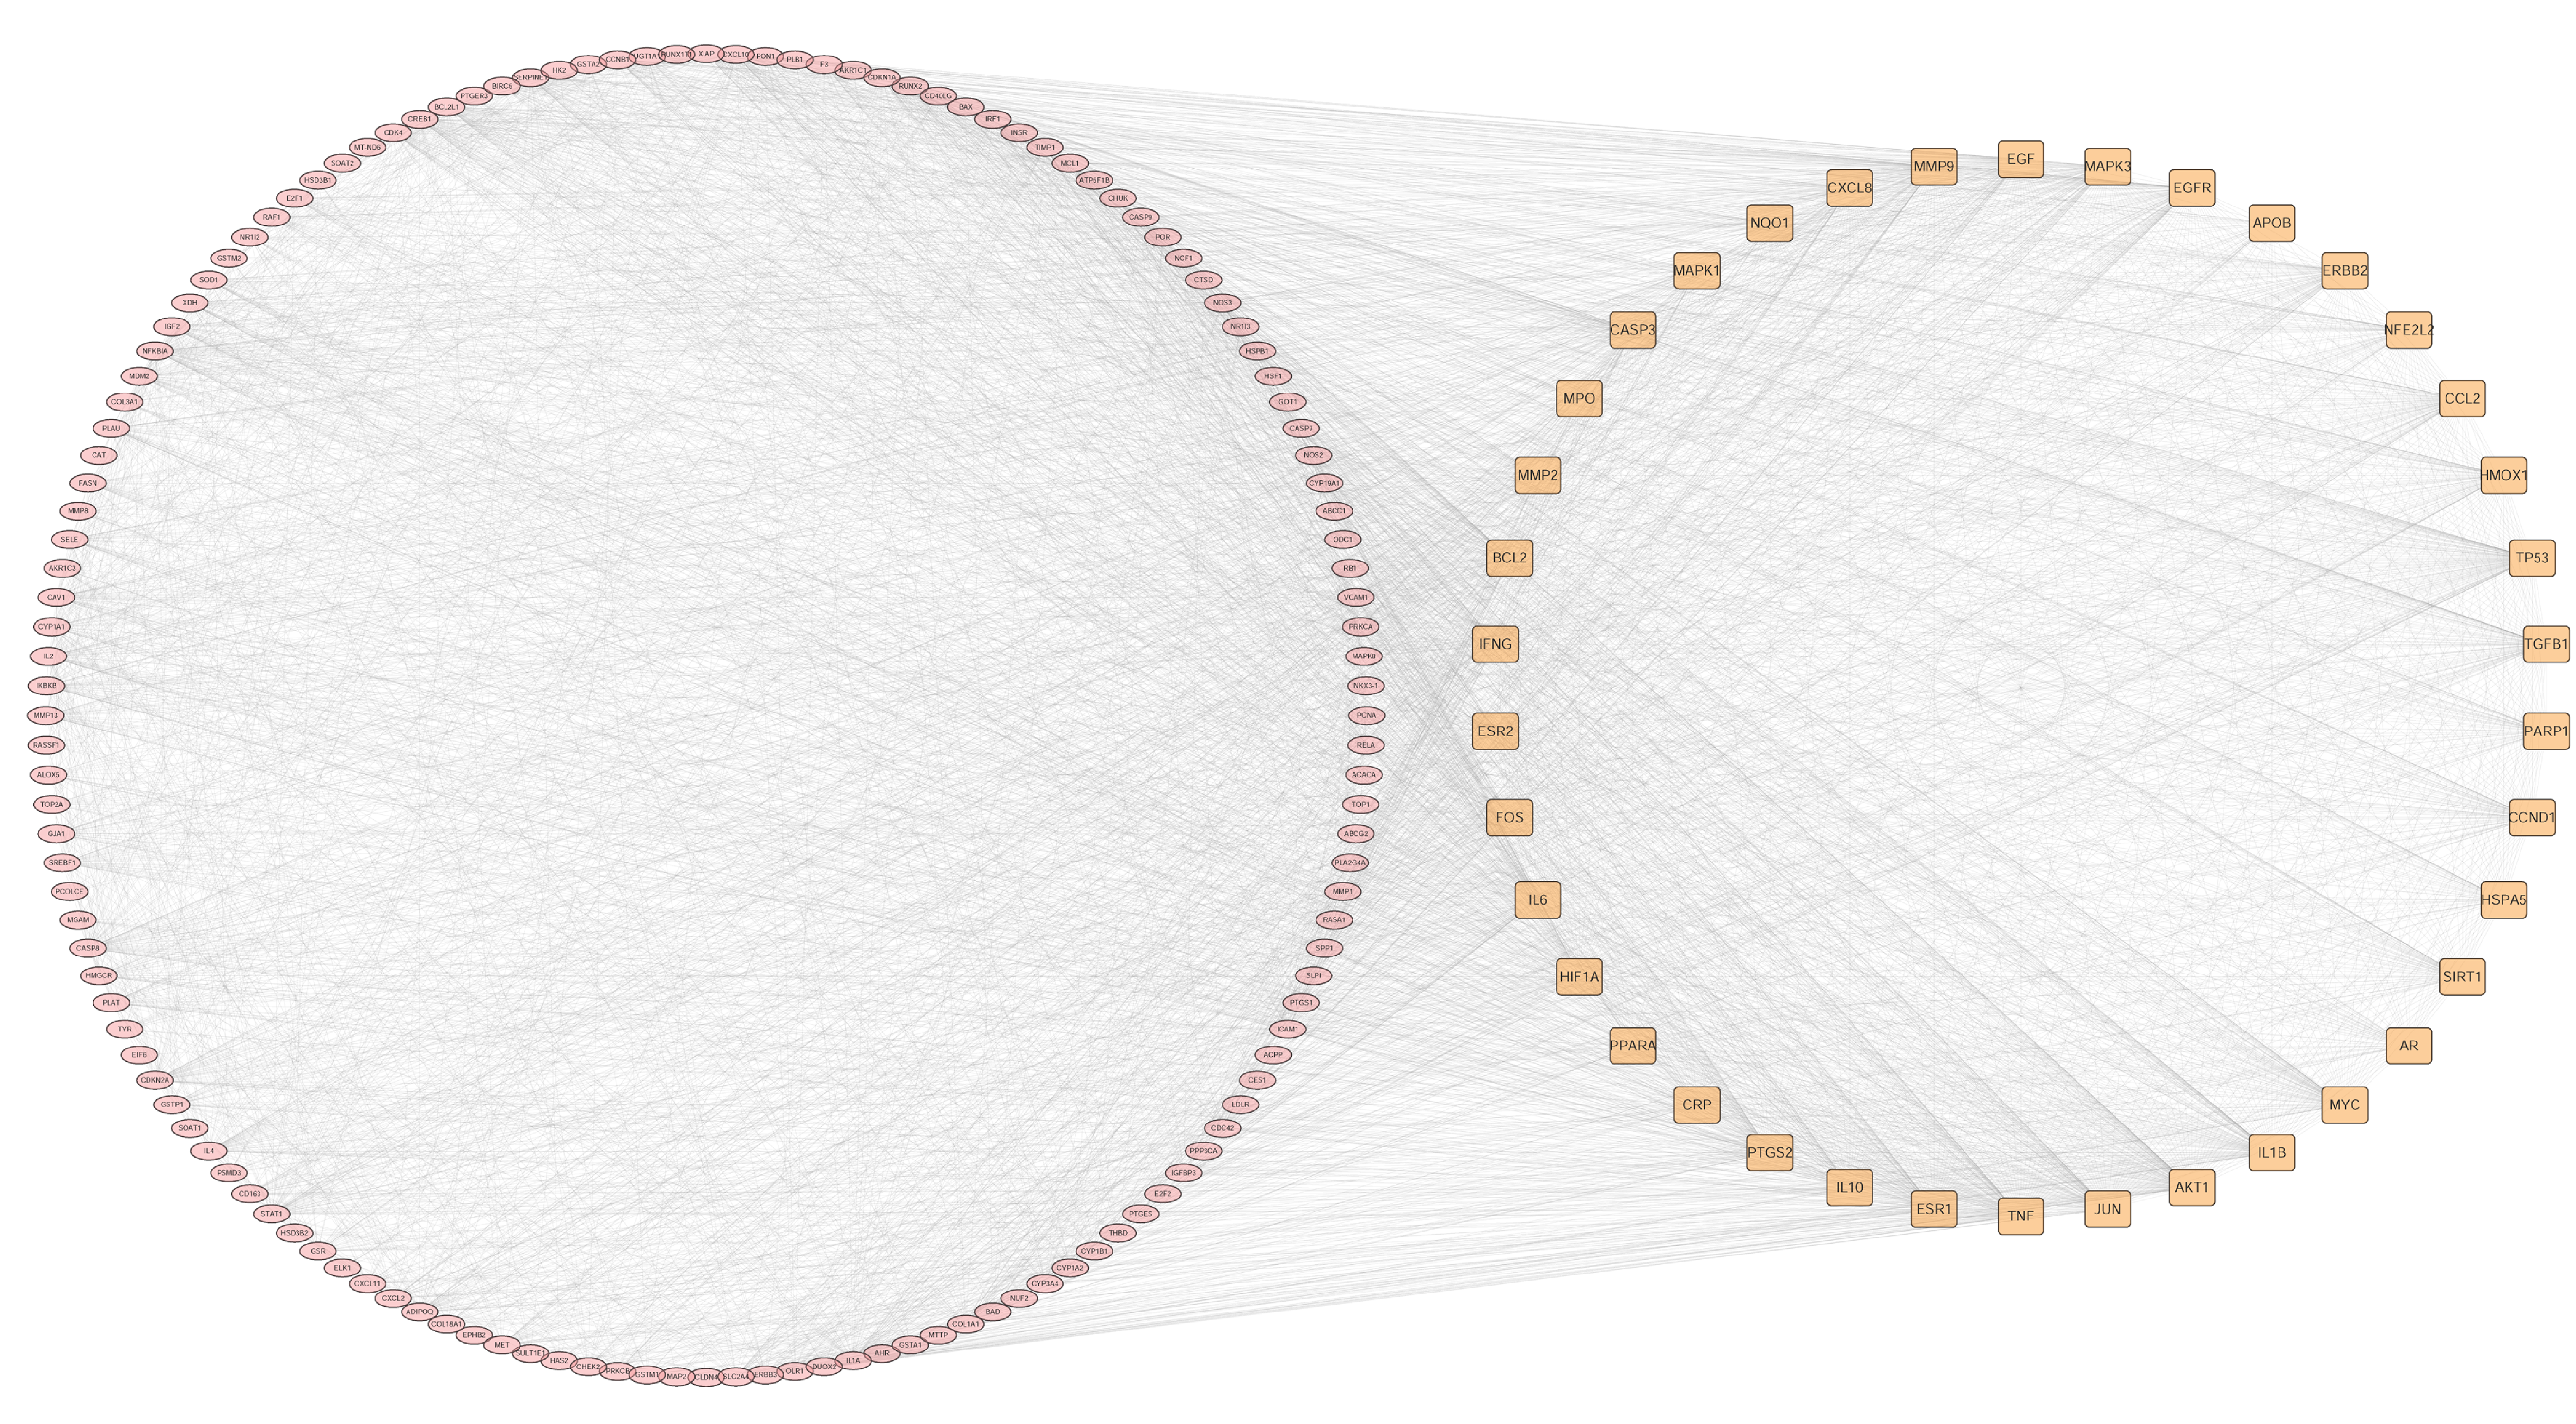
Figure 4 Screening of key genes by topology analysis of the protein-protein interaction network.
Pink indicates targeted gene, yellow indicates key genes identified using the NetworkAnalyzer plug-in.
Figure 5 Kyoto Encyclopedia of Genes and Genomes and gene ontology enrichment of key genes.
A: Gene ontology enrichment analysis, including biological process, cellular component, and molecular function; B: Top 20 Kyoto Encyclopedia of Genes and Genomes pathway enrichment.
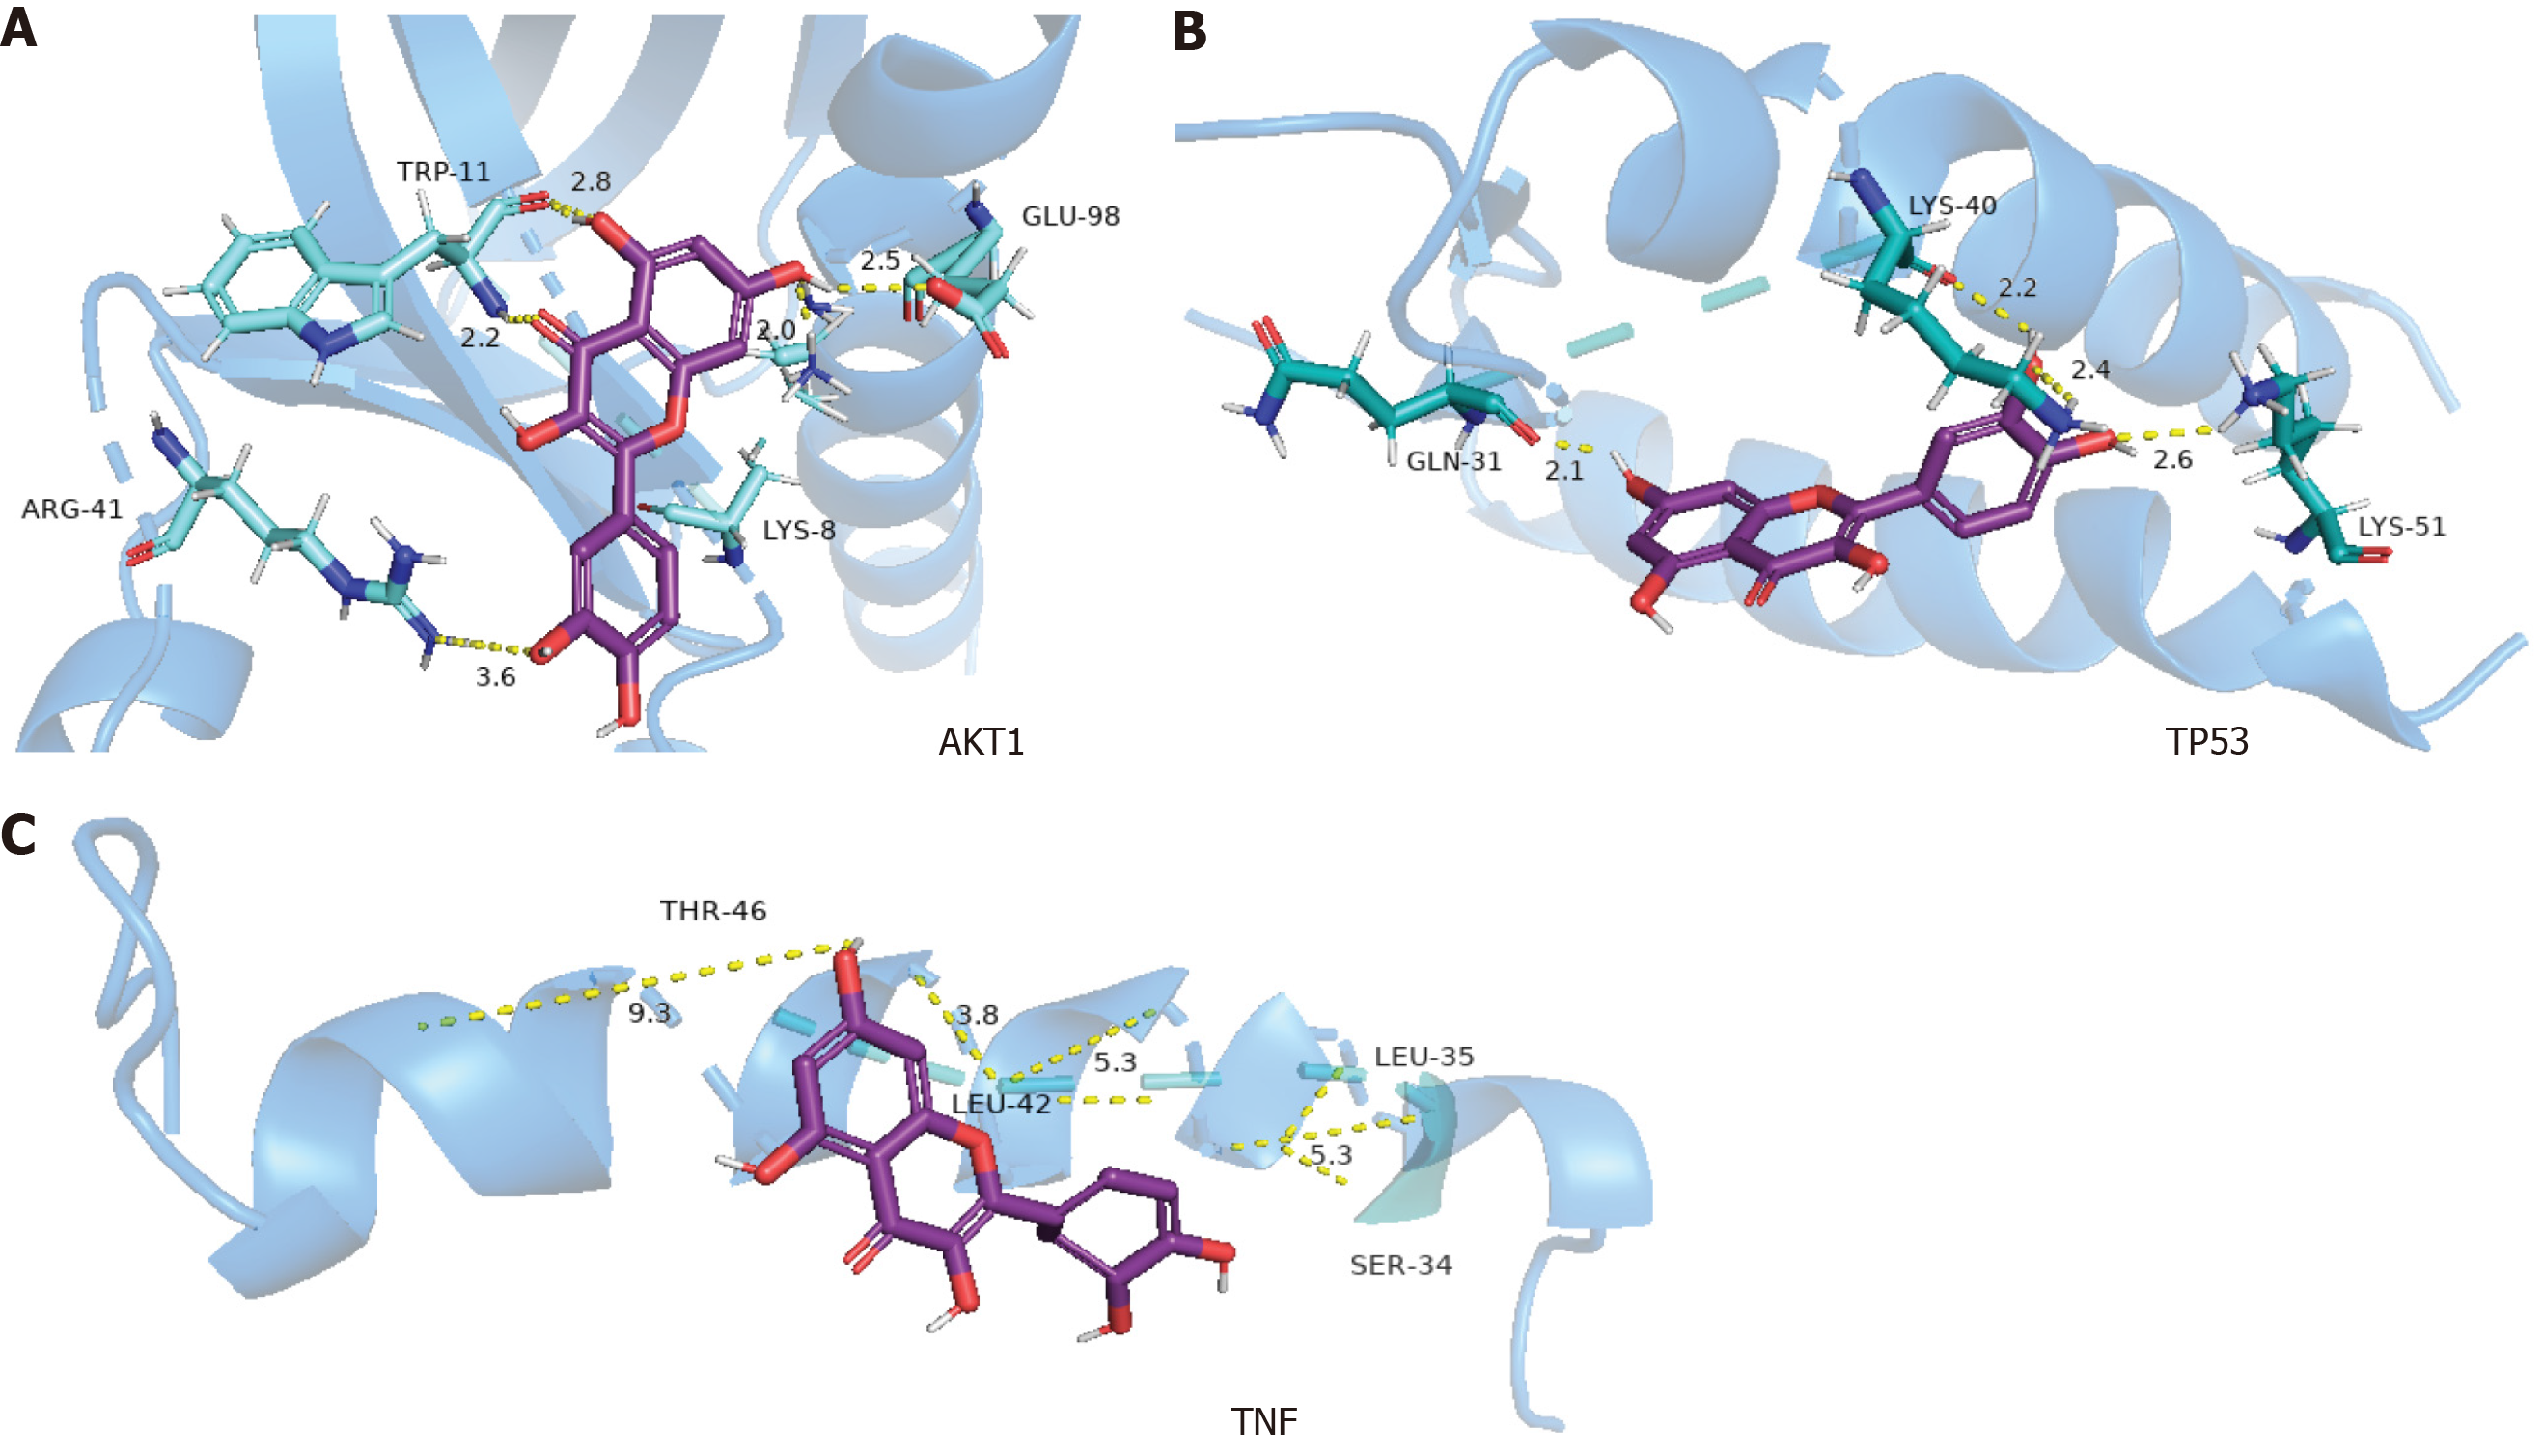
Figure 6 Molecular docking of quercetin with various targets.
A: Action mode of quercetin with target AKT1 (PDB ID: 1UNQ); B: Action mode of quercetin with target TP53 (PDB ID: 1A1U); C: Action mode of quercetin with target tumor necrosis factor (PDB ID: 7ATB). TNF: Tumor necrosis factor.
- Citation: Chen P, Wu HY. Network pharmacology- and molecular docking-based exploration of the molecular mechanism underlying Jianpi Yiwei Recipe treatment of gastric cancer. World J Gastrointest Oncol 2024; 16(7): 2988-2998
- URL: https://www.wjgnet.com/1948-5204/full/v16/i7/2988.htm
- DOI: https://dx.doi.org/10.4251/wjgo.v16.i7.2988


